Hadronic Reaction Zones in Relativistic Nucleus-Nucleus Collisions
Abstract
On the basis of the proposed algorithm for calculation of the hadron reaction rates, the space-time structure of the relativistic nucleus-nucleus collisions is studied. The reaction zones and the reaction frequencies for various types of reactions are calculated for AGS and SPS energies within the microscopic transport model. The relation of the reaction zones to the kinetic and chemical freeze-out processes is discussed. It is shown that the space-time freeze-out layer is most extended in time in the central region, while, especially for higher collision energies, the layer becomes very narrow at the sides. The parametrization of freeze-out hypersurface in the form of specific hyperbola of constant proper time was confirmed. The specific characteristic time moments of the fireball evolution are introduced. It is found that the time of the division of a reaction zone into two separate parts does not depend on the collision energy. Calculations of the hadronic reaction frequency show that the evolution of nucleus-nucleus collision can be divided into two hadronic stages.
1 Introduction
In the heavy-ion collisions, a strongly interacting hadronic system is formed – a fireball. This system is identified with a space-time region, in which the intensive hadronic reactions are running. With regard for a model describing the system, we can separate such stages of the fireball evolution as the formation of a fireball, its thermalization, hydrodynamic expansion, freeze-out, etc. The detailed knowledge of space-time structure of a fireball can serve as a way for formulation and selection of models used to address different problems in the field.
As parameters for the determination of the stages of evolution of a system, one can take the particle density [1, 2], energy density [2, 3], temperature [4, 5], mean free path, rate of collisions of particles , etc. The same parameters are also used for the determination of the chemical and kinetic freeze-out processes [6, 7, 8]. Depending on the chosen parameter, one can get various fireball representations. In the present work, we use the hadron reaction rate (number of reactions in a unit volume per unit time) in a given four-dimensional region of the space-time as a parameter of the spatial evolution of the interacting system. Such a quantitative estimate allows one to define the reaction zone [9], which study gives a possibility to establish the space-time structure of a fireball from the viewpoint of the interaction (collision) intensity at every point of the space-time. Then, the regions of a fireball can be distinguished by the interaction intensity that can be characterized by the number of collisions in a unit volume of the space-time. We use this quantity to estimate and to quantify various regions of the reaction zone.
Another important question which can be clarified by the study of the zone of reactions is how the space-time boundary of a particular region of the reaction zone is related to the processes of kinetic and chemical freeze-outs. Since the kinetic freeze-out is the process of establishment of a final distribution of hadrons in the momentum space, the sharp kinetic freeze-out hypersurface is an imaginary hypersurface, outside of which there are no collisions between radiated hadrons (or a very small amount of collisions is admitted). This kind of picture is an idealized description for heavy-ion collisions, and studies within microscopic models have shown that freeze-out happens in the extended space-time domain rather than on some 3-dimensional space-time hypersurface [10, 11, 12], however, the sharp freeze-out hypersurface is frequently used within the Cooper-Frye prescription [13], e.g. for calculations of the hadron spectra in hydrodynamical description or for making transition from the fluid dynamical stage of collision to the stage of dilute hadron gas in hybrid models. In this sense, the space-time boundary of a reaction zone and the sharp kinetic freeze-out hypersurface can be put in correspondence.
2 Reaction zones
The number of reactions in the given space-time region can be evaluated in the following way:
| (1) |
where the four-density of reactions can be evaluated, in turn, in the framework of a certain model approximation, e.g., like that in [14, 15]. In particular, can be calculated with the use of a distribution function within a transport model.
The reaction zone is defined as the space-time region where a certain fraction of all reactions of a certain type take place [9]. This space-time region is chosen so that it should be the most intense with respect to the reaction rate, i.e., it has the smallest possible volume. Reactions are classified by the type and the number of particles taking part in these reactions (see Table 1). The reaction zone can be calculated for various types of reactions with the use of the particular rate for a given reaction type.
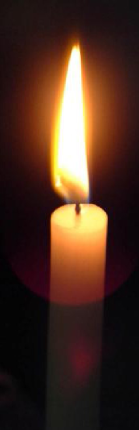
One can get a feeling of the definition given above, while associating the reaction zone with the flame of a candle (see Fig. 2). Indeed, it is the region that is the most intense with respect to exothermic “luminous” reactions and is basically a reaction zone (as usual, we do not care about the regions which contain the products of the oxidizing reaction that are not visible to us).
In the present paper, we investigate the most central nucleus-nucleus collisions. Because of the symmetry of central collisions, the reaction density does not depend on the azimuthal angle in the - plane in the cylindrical coordinates, i.e., . In this case it is possible to build a three-dimensional reaction zone in coordinates , where .
Our task is to determine a hypersurface that confines the volume containing a certain part of the total number of all hadronic reactions . This hypersurface can be determined by the equation
| (2) |
where the critical value satisfies the equation for a given value of
| (3) |
It is obvious that the value of “determines” the “luminous” part of the reaction zone analogously to the luminous region of the flame of a candle.
| 1 | decay | |
|---|---|---|
| 2 | fusion | |
| 3 | elastic scattering | |
| 4 | inelastic reaction |
To carry out evaluations, we use the microscopic transport model UrQMD v2.3 [16, 17], which allows one to calculate the four-density of reactions at every point of the space-time and to select the reactions of a necessary type and the species of particles. We take a large four-volume of reactions , which is determined in the cylindrical coordinates as: , and .
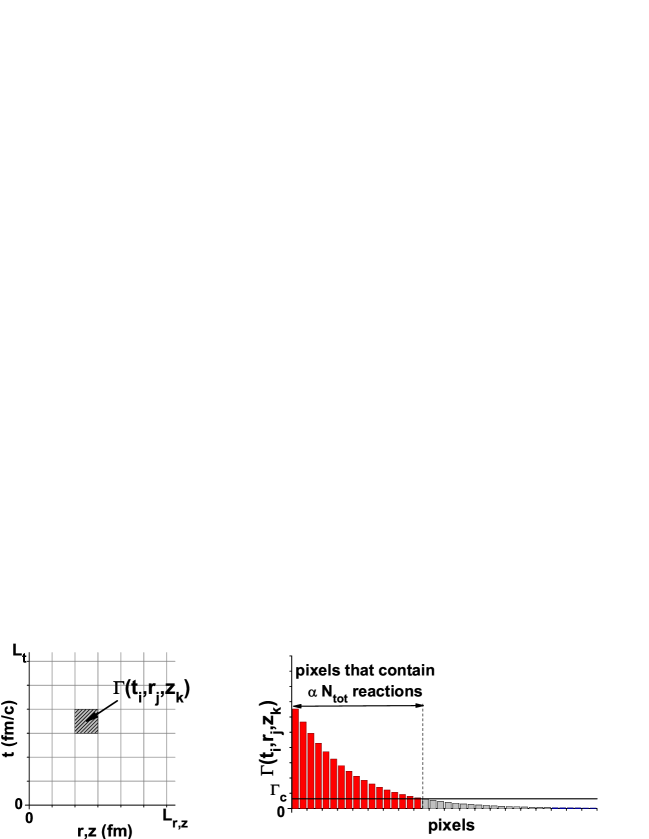
To calculate the critical rate and to determine the reaction zone, we divide the four-volume into cells (pixels), i.e., elements of the four-space, as shown in Fig. 1 (left panel). Let be the four-volume of a pixel with coordinates of its center. Hence, this pixel is defined as
| (4) |
where fm in our calculations. The values of determine the sampling accuracy in our method. The four-volume of a pixel with coordinates is . Then, for each three numbers , which determine a certain pixel, we can calculate the reaction density in the given pixel from UrQMD by calculating the number of reactions in that pixel and dividing it by the four-volume of the pixel. After this, we put all pixels on the line in the form of bins of equal width and of a height, which is equal to the pixel intensity . We sort the bins (pixels) from left to right by the following hierarchy: from a pair of bins (pixels), the left bin is higher (the pixel has a larger reaction density), see Fig. 1 (right panel). The total integral of (the sum of -values in pixels multiplied by corresponding pixel four-volume ) is equal to the total number of all hadron reactions in the four-volume of reactions .
Let us sum the values of reaction densities multiplied by the corresponding beginning from the left according to the obtained hierarchy. We recall that the value of each gives the number of reactions in the corresponding pixel. Increasing the number of pixels in the sum, we can reach the value of sum that is equal to a given number , where is a given fraction of the absolute number of all reactions , see Fig. 1 (right panel) and Eq. (3). For instance, for the critical density of reactions will corresponds to the % of the total number of reactions. The current value of reaction density in the hierarchy at that point is .
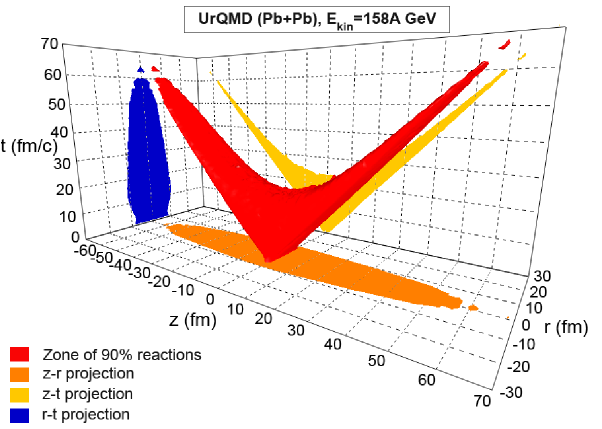
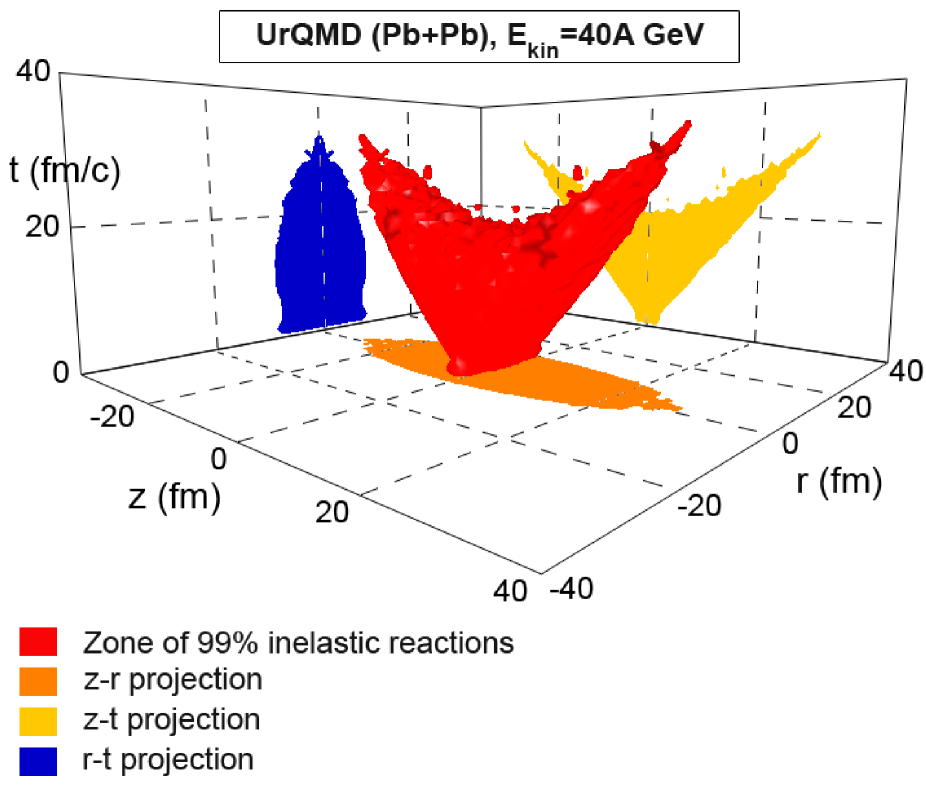
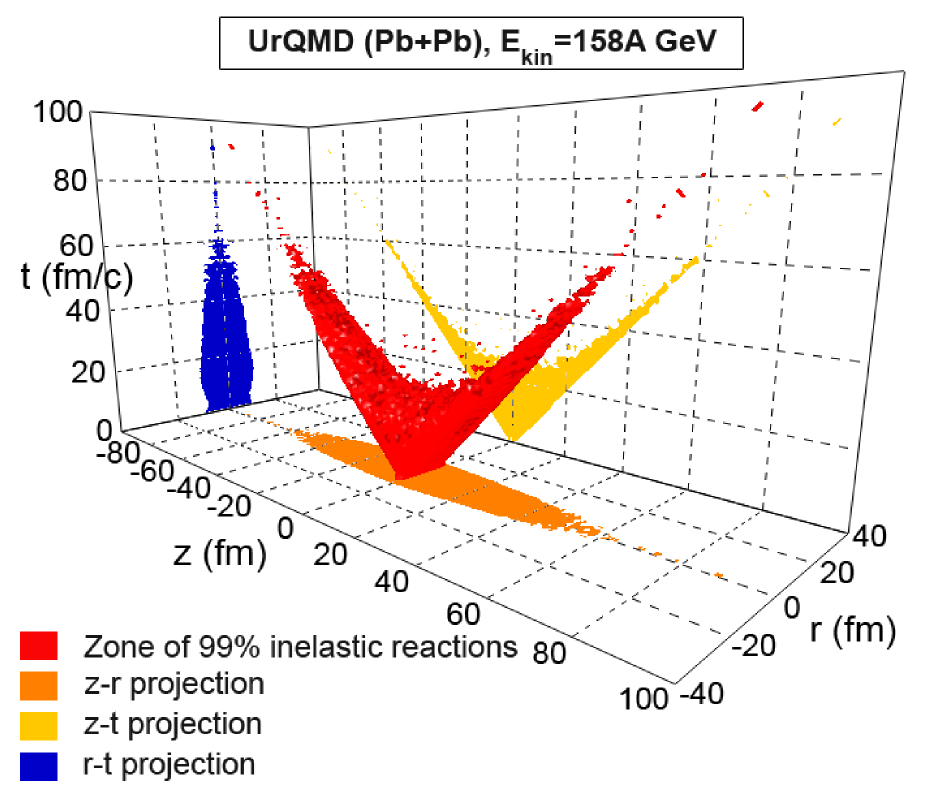
In Fig. 2, we show the calculation results under conditions at the CERN Super Proton Synchrotron (SPS), Pb+Pb at 158A GeV in the case of central collisions. The figure depicts the space-time region, where 90% of all hadronic reactions take place. For this calculations, we use the coordinates (), where . In addition, we show the different orthographic projections of the reaction zone on the coordinate planes - (yellow), - (blue), and - (orange).
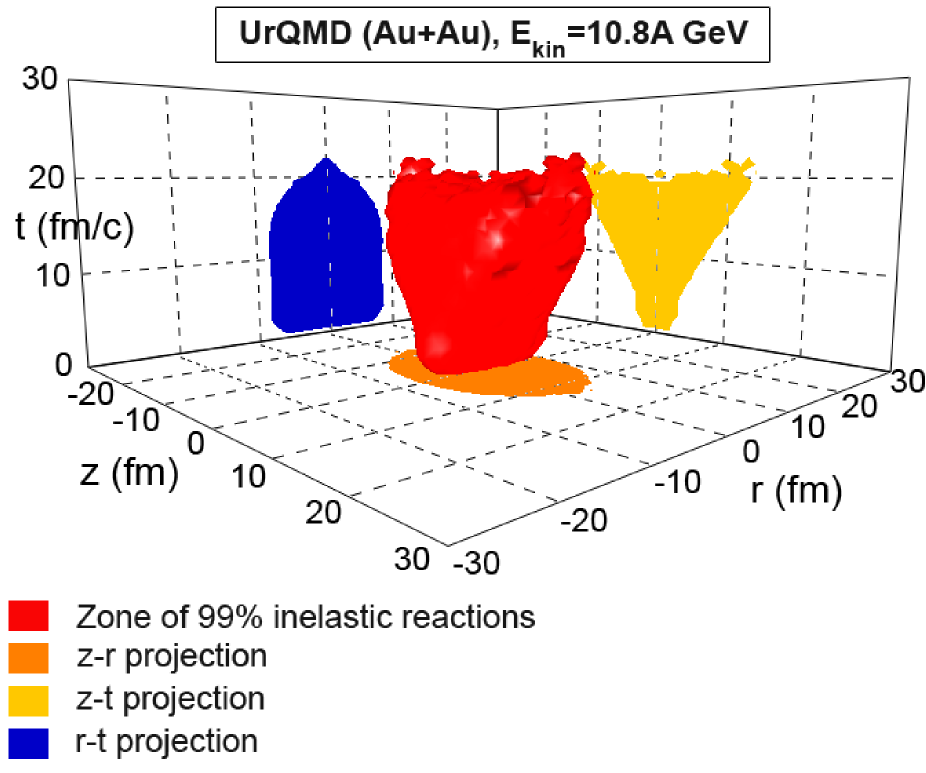
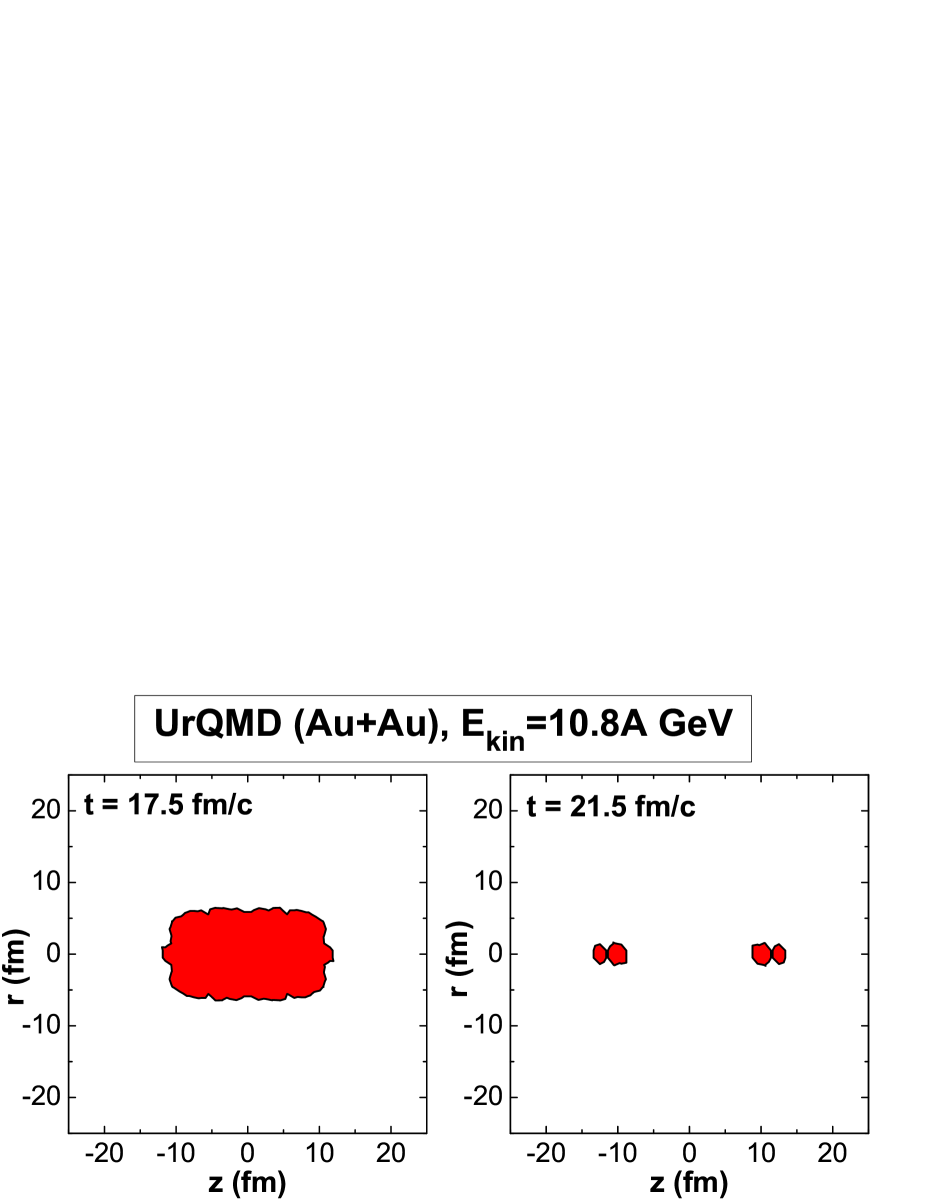
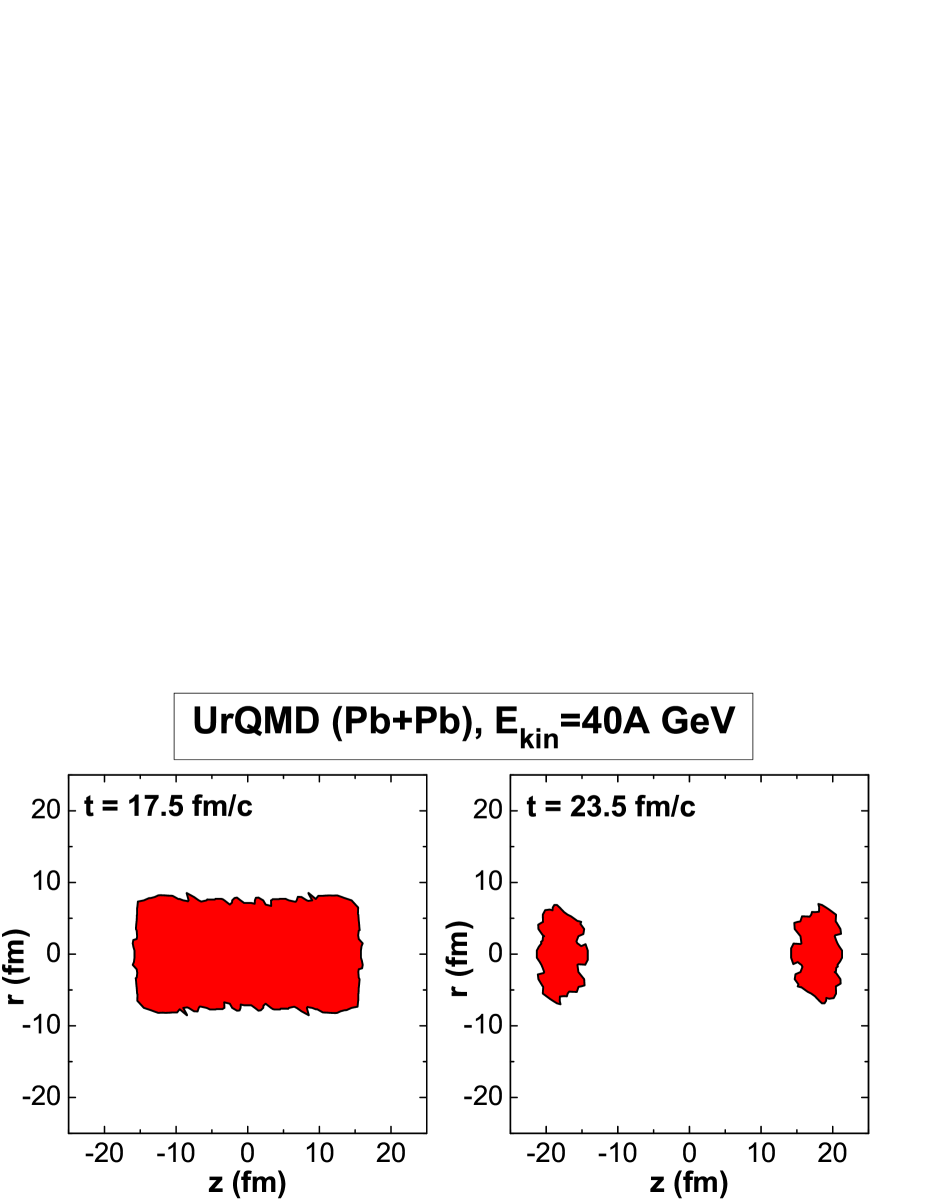
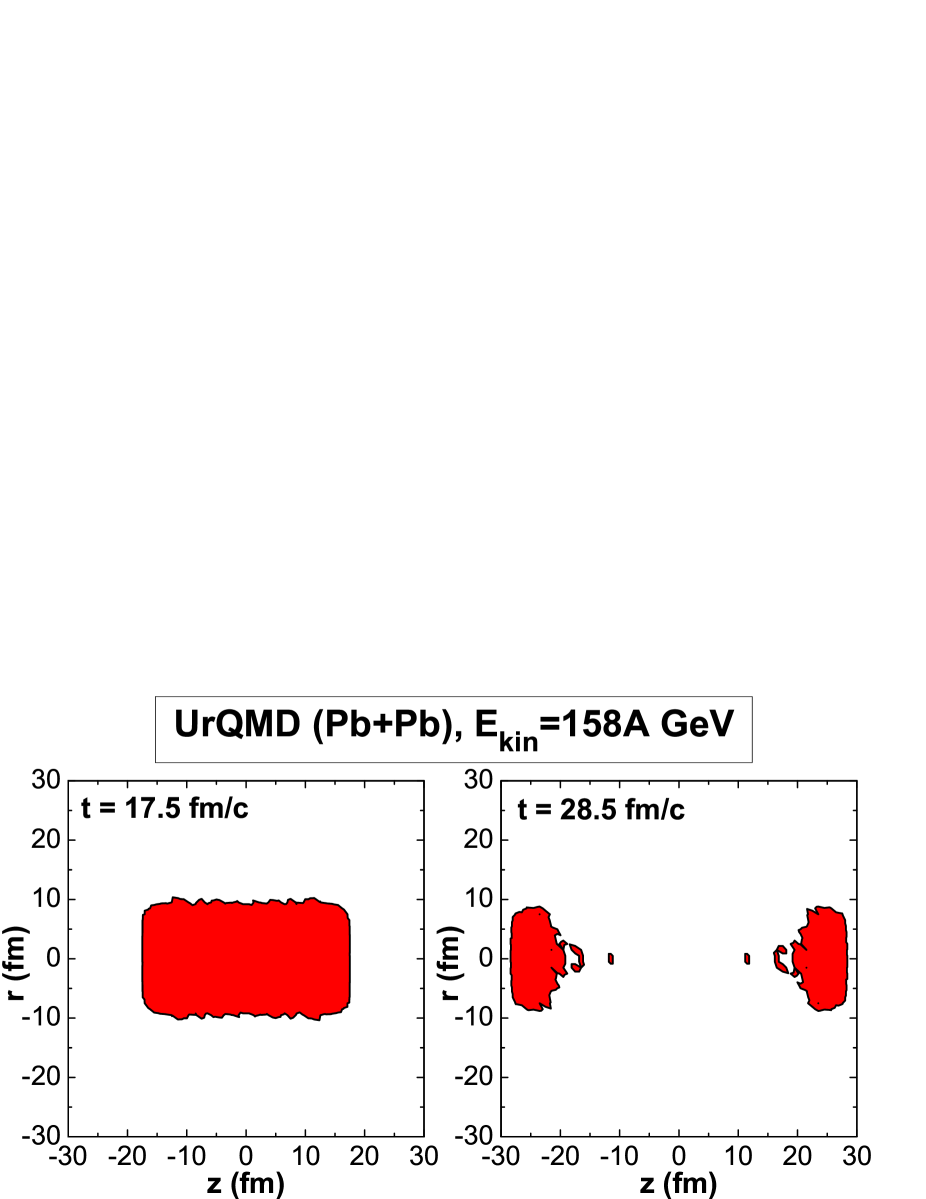
Then we apply the same evaluation procedure to determine the three-dimensional reaction zone of the inelastic hadronic reactions (). In Figs. 3-5, the results of calculations under conditions at the BNL Alternating Gradient Synchrotron (AGS), Au+Au, and at the SPS, Pb+Pb, are depicted. It is seen that, at SPS energies, the reaction zone (fireball) breaks-up into two spatial parts. Meanwhile, at AGS energies, there is virtually no break-up of a fireball, but the fireball disappears almost immediately as a whole. The reaction zones in the - coordinates at times before and after the break-up of a fireball are also shown in Figs. 3-5.
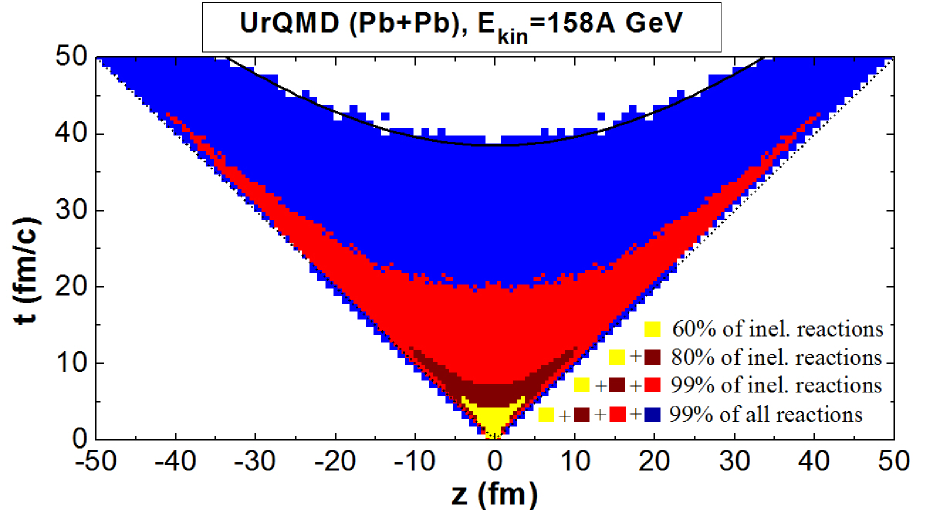
While comparing the results of calculation for the energy 158A GeV for all reactions (Fig. 2) and for inelastic reactions (Fig. 5), it is obviously seen that the reaction zone containing 90% of all reactions roughly coincides with the reaction zone containing 99% of all inelastic reactions. We name this part of the reaction zone as a hot fireball. Hence, everything that is beyond a hot fireball contains approximately 10% of the total number of reactions and just 1% of all inelastic reactions.
In this study, we parameterize reaction zones by the global parameter (fraction of the total number of reactions contained in the corresponding reaction zone), rather than the local critical inelastic reaction density for various collision energies. We remind, that the hypersurface which separates different 4D zones is usually determined, for instance, for the density of particles as ; in our case this hypersurface can be determined as . The parameters and are related to one another via Eq. (3) for each particular collision energy. It is interesting to explore this relation in greater details. The values of for given different values of and different collision energies are presented in Table 2. It is seen that the values of are different at different collision energies.
Hence, our approach with fixed (which is a global parameter) for different collision energies is not exactly equivalent to that with fixed (which is a local quantity). However, it is seen from Table 2 that the values of for the same given are of the same order of magnitude for different energies, whereas the change of from 0.8 to 0.99 leads to a change in of two orders of magnitude. Therefore, the differences in for different energies are not very significant. This means that the approach, where is fixed, should yield qualitatively the same results as those in the case where the fixed quantity is because the inverse dependence of on , i.e. , is weak. We have performed calculations of the three-dimensional inelastic reaction zone for different energies with values from Table 2, see Figs. 3-5. The resulting reaction zones for energies from Table 2 are roughly the same in the range of these values, at least till the time moment when the reaction zone separates into two different spatial pieces (drops).
| (A GeV) | (GeV) | |||
|---|---|---|---|---|
| 10.8 | 4.88 | |||
| 20.0 | 6.41 | |||
| 40.0 | 8.86 | |||
| 80.0 | 12.39 | |||
| 158.0 | 17.32 |
Henceforth, we will deal with the projection of the reaction zone on the - plane. To design this projection, we sum firstly all collisions along the transverse direction at the fixed coordinates (, ). Then, the reaction density in the - plane takes the form
| (5) |
Then the number of reactions in the given pixel on - plane is
| (6) |
To construct the reaction zone projection from UrQMD we divide the two-dimensional plane into rectangular cells (pixels) with lengths =1 fm/ and =1 fm. The volume of a pixel is then and does not depend on values of and , i.e. it is the same for all pixels. It is different from the case of coordinates where the four-volume of a pixel depended on transverse coordinate . This allows us to construct the reaction zone projection with the use of the above-mentioned algorithm where in place of the pixel intensity , which in the previous sorting problem determined the height of the bin, we put the number of collisions in the correspondent pixel , which is now the height of the bin (see details in Ref. [9]).
It is worth to note that this reaction zone projection onto the - plane does not necessarily coincide with the corresponding projections of the three-dimensional reaction zone in Figs. 3-5, which are just orthographic projections of the reaction 4-density . However, they are found to be roughly the same.
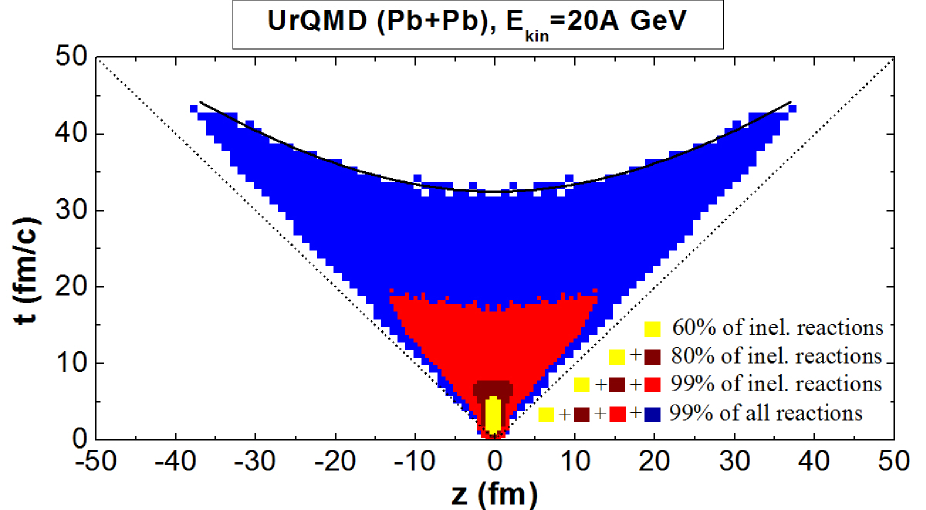
In Figs. 6, 7, and 8, we show the results of calculations under conditions at the BNL-AGS, Au+Au, and at the CERN-SPS, Pb+Pb, in the case of central collisions. In accordance with our algorithm, the volume that contains 60% of all hadronic inelastic reactions, is determined (depicted as the yellow area). Next, we determine the volume that contains 80% of all hadronic inelastic reactions and includes the previous zone (depicted as the dark red area plus the previous area). Finally, we determine the volume that contains 99% of all hadronic inelastic reactions and also includes the previous zone (depicted as the red area plus the previous two areas). As was previously mentioned, this zone is named as the region of a hot fireball. We determine also a volume that contains 99% of all possible hadronic reactions and includes, of course, the previous zone. We name the region of 99% of all hadronic reactions excluding the zone of the hot fireball as a cold fireball (blue area).
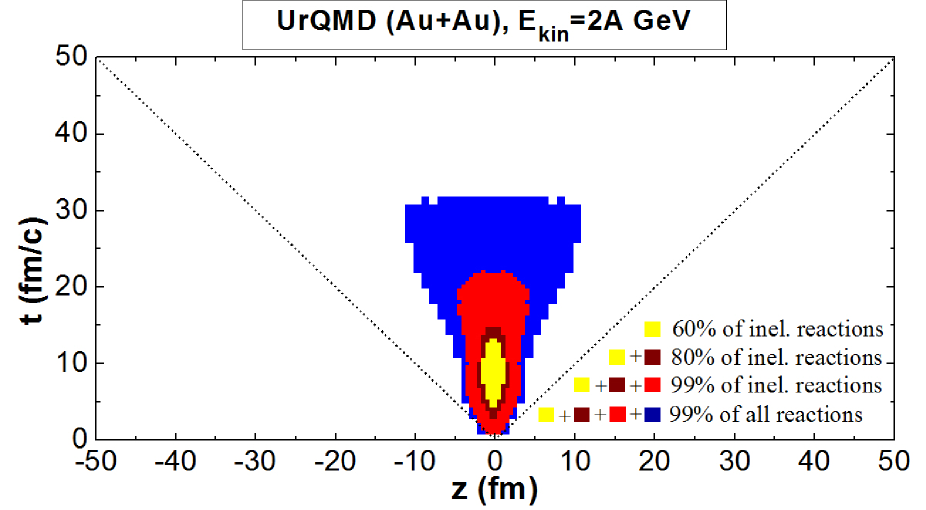
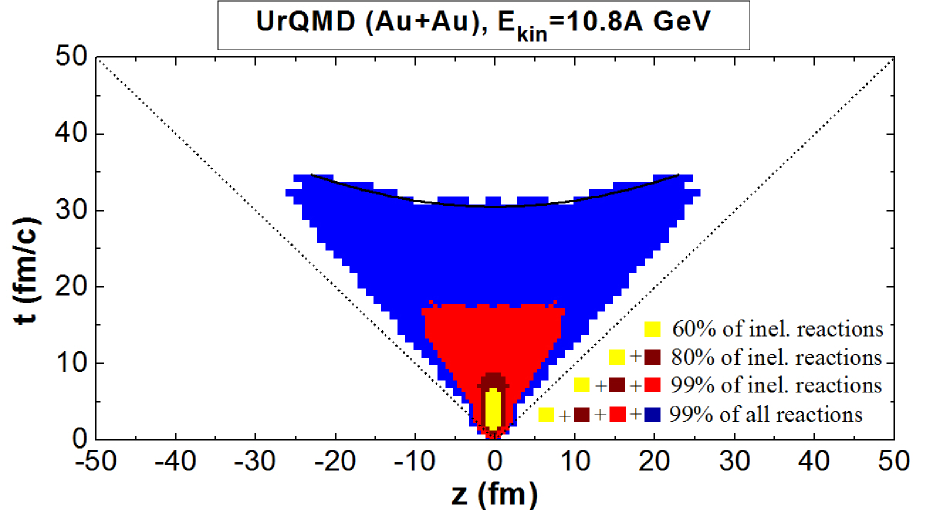
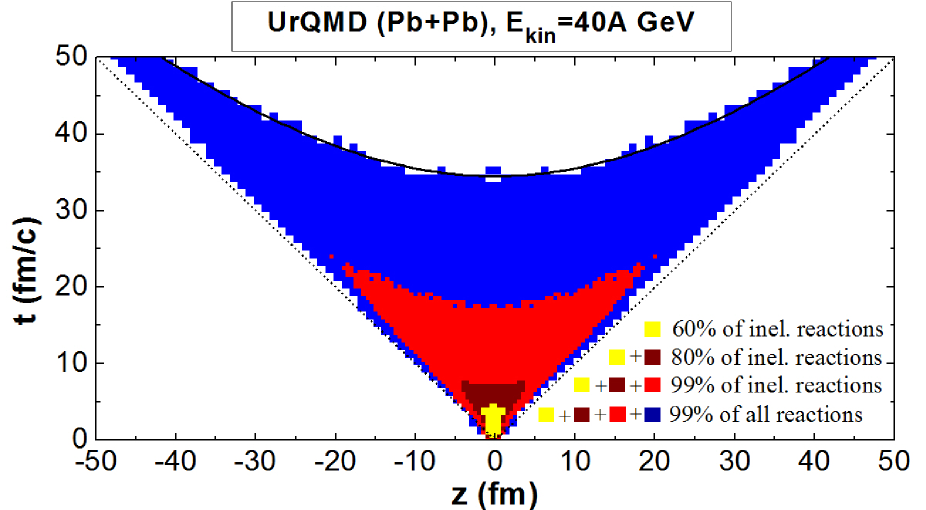
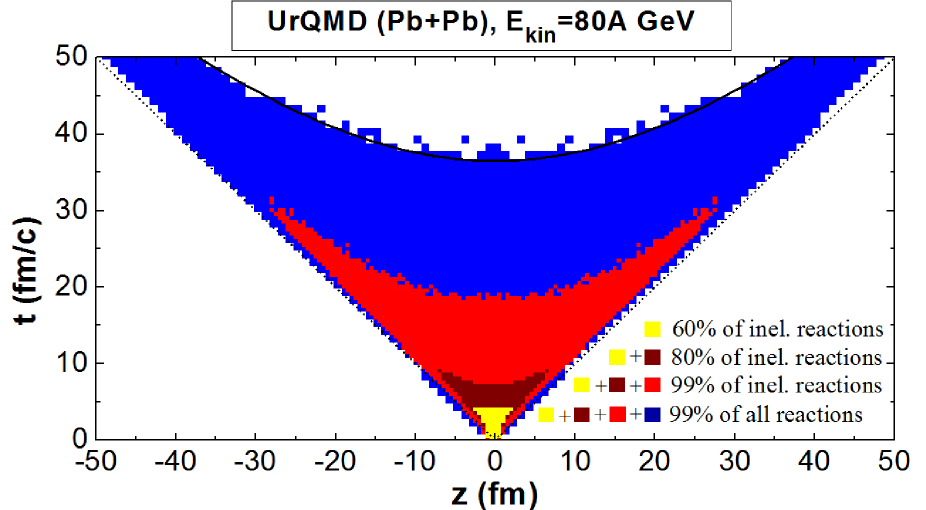
After some time , the inelastic reaction zones studied in this work either decay completely, or are spatially divided into two parts, which move away from each other in opposite directions, see Figs. 6-8. This division time , which depends on the fraction , can be defined as , where the time dependence defines the border between two reactions zones. For details see Fig. 9 which represent in big scale the corresponding reaction zone in the central region. The values of for different values of and different collision energies are depicted in Table 3.
| | | | | |
| (A GeV) | (GeV) | (fm/) | (fm/) | (fm/) |
| 10.8 | 4.88 | 6.5 | 8.5 | 17.5 |
| 20.0 | 6.41 | 5.5 | 7.5 | 17 |
| 40.0 | 8.86 | 4.5 | 7 | 17.5 |
| 80.0 | 12.39 | 4.25 | 7 | 18 |
| 158.0 | 17.32 | 4.25 | 7 | 19.5 |
One of the main features seen from Table 3 is that the division time of a separation of the particular reaction zone into two different spatial parts depends weakly on the collision energy for different values of . That is especially true for higher values of and in the case where the reaction zones are divided into two parts at rather than in the case where they would decay completely (see Figs. 6-8).
Similar result was also reported in studies of space-time structure of multipion system created in heavy-ion collisions [2]. In that work the hypersurfaces which correspond to some invariant constant densities were studied. These hypersurfaces are defined by equations and , where is the critical number density and the critical energy density of pi-mesons created in heavy-ion collision. It was found that for each particular value of critical density (or ), the division time depends weakly on collision energy similarly to the case of reaction zones studied in this work. These results indicate that the weak dependence of fireball division time on collision energy is a universal feature of space-time structure of heavy-ion collisions.
![[Uncaptioned image]](/html/1302.6190/assets/x16.png)
Figure 9: Central part of the reaction zones under SPS conditions (Pb+Pb at GeV), where the inelastic reaction zone division times are indicated for different values of : 60%, 80%, and 99%.
The zone including the hot and cold fireballs together contains 99% of all reactions by definition (see the colored area in Figs. 6-8). We can compare this reaction zone with the zone which is wrapped by the freeze-out hypersurface. Following the “classical” definition of the sharp kinetic freeze-out hypersurface, it is some boundary that separates the interacting system from the space-time domain, where the particles do not interact, and almost all particles are evaporated (freezed out) from the thin space-time layer determined by this hypersurface. Then, it seems evident that the sharp kinetic freeze-out hypersurface should be inside the reaction zone, rather than outside it. In addition, we note that the sharp chemical freeze-out hypersurface should be inside the hypersurface that separates the region of a hot fireball containing 99% of all inelastic reactions which corresponds to the area covered by the first three zones together depicted in Figs. 6-8.
In the coordinates , the curve which is the upper space-like boundary of the cold fireball (“blue” zone) can be well approximated as a hyperbola originating from a possibly different time, , than the initial time of the collision. This approximation was already used to describe the -projection of hypersurface of constant invariant pion density [2]. The equation for this hyperbola has the form
| (7) |
The fireball division time is related to hypersurface parameters as
| (8) |
The values of parameters and for different energies are presented in Table 4. It is seen that the parameter takes negative values and approaches zero with increase of the collision energy. In that case, the reaction zone boundary can be regarded as the hypersurface of a constant proper time , which originates from initial time and which is then equal to . It should be mentioned that coordinate in Eq. (7) takes values only in finite interval , where is -coordinate of the intersection point between upper space-like boundary of the reaction zone and lower time-like boundary.
The upper space-like boundary of the “blue” zone can be parameterized in a different way. For instance, it can be approximated as a hyperbola of the form [9], where , fm at the AGS energy ( GeV) and , fm at the SPS energies ( GeV). Here, parameter approaches unity with increase of the collision energy, and the space-like boundary takes the form of the hypersurface of a constant proper time , which originates from initial time and coincides with previous parametrization at high energies. At AGS and SPS energies, however, the space-like boundary has a more complex structure and both parameterizations can be used to describe it. We note, that the presented parameterizations can be used to describe upper space-like boundaries of also other reaction zones, rather than “blue” zone alone, provided that there is a spatial division of that zones (see different zones in Figs. 6-8).
(space-like boundary of cold fireball)
| (A GeV) | (fm/) | (fm/) |
|---|---|---|
| 10.8 (AGS) | -30 | 60.5 |
| 20 (SPS) | -20 | 52.5 |
| 40 (SPS) | -14 | 48.5 |
| 80 (SPS) | -8 | 44.5 |
| 158 (SPS) | -5 | 43.5 |
The time-like hypersurface bounding cold fireball from below has the form of a straight line , where is close to zero, and at AGS energies and at SPS energies ( increases with the collision energy). At AGS energies, the time-like boundaries of the reaction zones differ significantly from one another and the light cone (see Fig. 6). However, at higher SPS energies (for example, at GeV), the time-like hypersurfaces bounding all three zones of a fireball practically coincide with one another and are close to the light cone (see Fig. 8). Thus, we can predict that time-like hypersurfaces which bound different reaction zones from below merge at the energies available at the Relativistic Heavy Ion Collider or Large Hadron Collider and virtually coincide with the light cone.
3 Temporal structure of reactions
The structure of hadronic reactions in a fireball can be analyzed within UrQMD, which allows one to calculate the reaction density for various types of reactions.
The reactions can be classified by the type and the number of participants in a reaction (see Table 1), and the contributions of different types of reactions to the system evolution can be explored. For this purpose, we analyze the time dependence of the reaction frequency for different types, , of reactions:
| (9) |
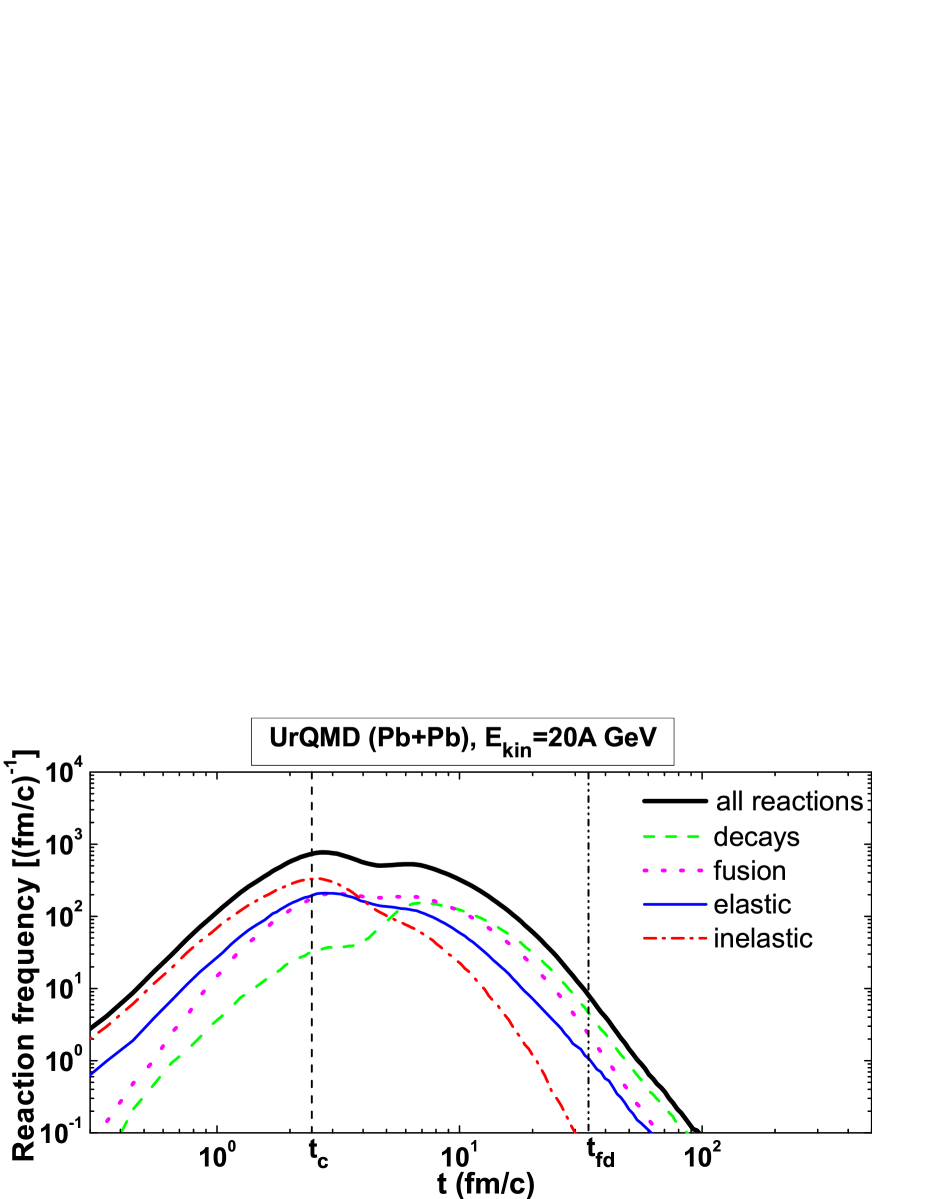
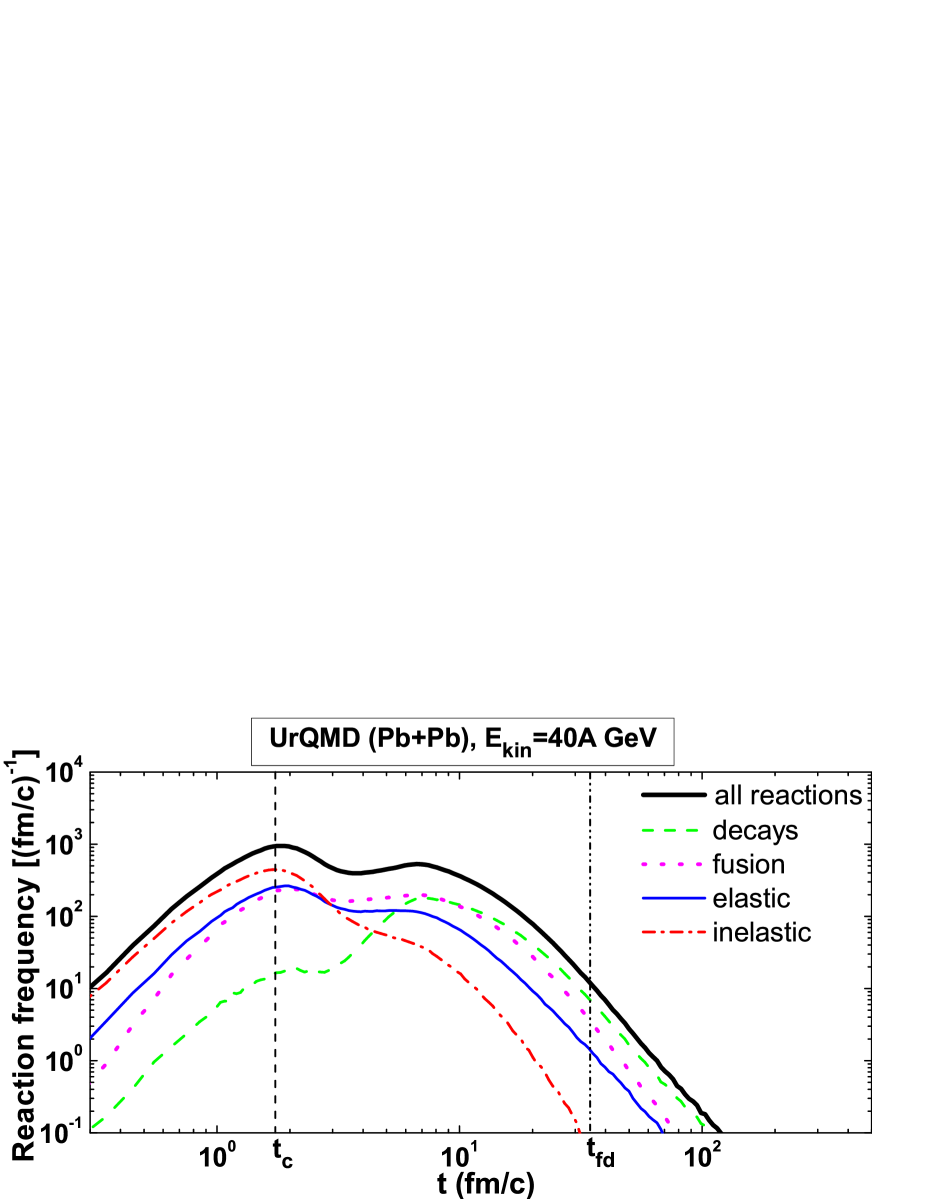
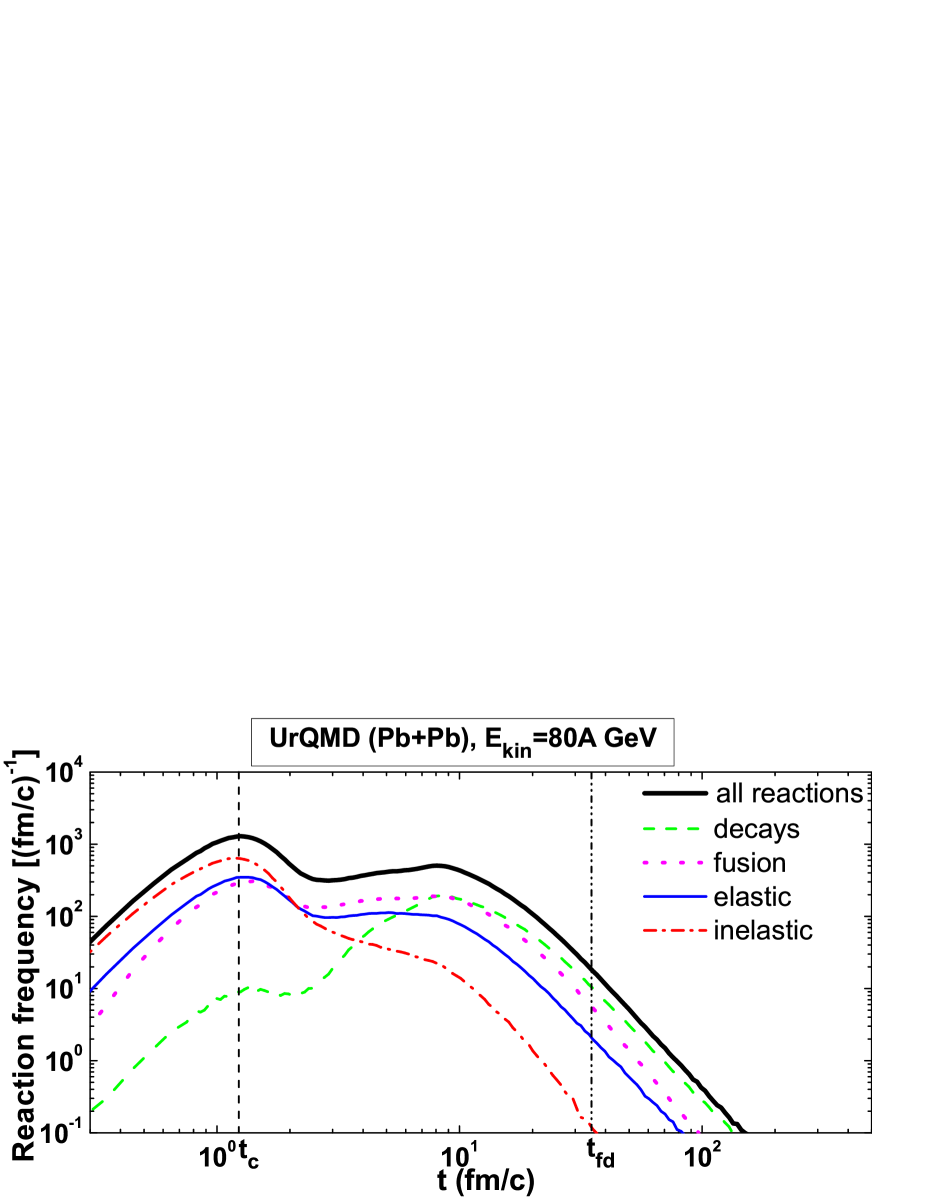
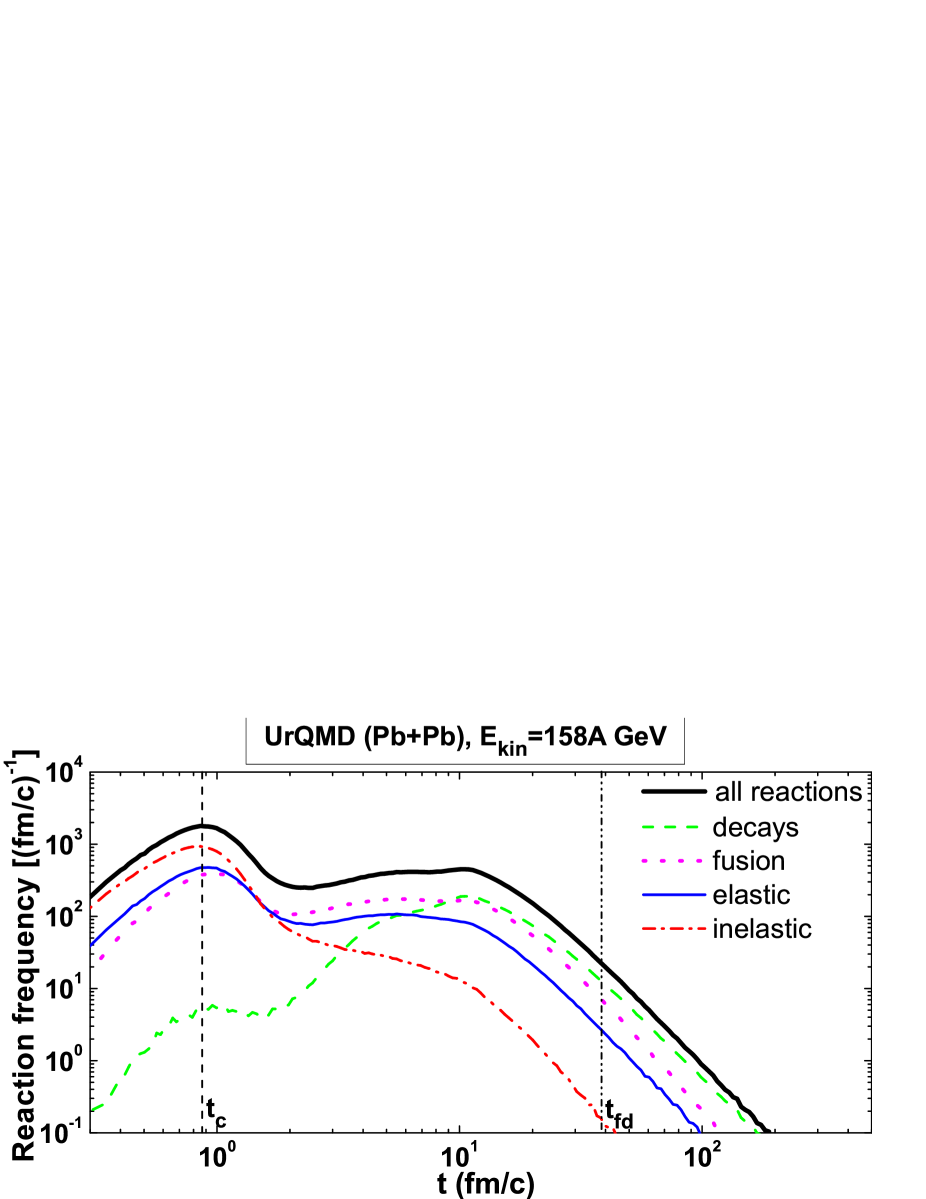
The results of evaluations of the time dependence of the reaction frequency (9) at the AGS and SPS energies are depicted in Figs. 10, 11 and 12. The thick solid line indicates all reaction rates in a fireball, the thin solid line indicates only the elastic scattering of hadrons (), the dash-dotted line shows all inelastic reactions (, where ), the dotted line stands for fusion reactions (), and the dashed line distinguishes decays ().
| (A GeV) | (GeV) | (fm) | (fm) | (fm) | (fm) |
|---|---|---|---|---|---|
| 2.0 | 2.70 | 7.66 | 9.7 | 33.0 | |
| 10.8 | 4.88 | 3.30 | 3.9 | 30.5 | |
| 20.0 | 6.41 | 2.46 | 2.73 | 6.1 | 34.0 |
| 40.0 | 8.86 | 1.74 | 1.85 | 6.7 | 34.5 |
| 80.0 | 12.39 | 1.23 | 1.27 | 8.2 | 35.0 |
| 158.0 | 17.32 | 0.87 | 0.88 | 10.3 | 38.5 |
The main feature of the reaction frequency (thick solid lines in Figs. 10-12) is its increase up to fm at AGS energies and fm at SPS energies where it has its first maximum . This can be explained by an increase of the number of nucleons as participants of the reactions, when one nucleus penetrates into another one. Indeed, the maximum overlap of two nuclei happens, when their centers coincide. This time can be estimated as
| (10) |
where is the nucleus radius, , , is the initial nucleon momentum in the center-of-mass system of two nuclei, and is the nucleon mass. We call as the fireball formation time. The values of (see Table 5) are very close to the time moments that correspond to the first maximum of the reaction frequency (thick solid lines in Figs. 10-12). A slight difference of and the time point of the real maximum can be explained by some decrease of the nucleon velocity, which is due to inelastic and elastic reactions (stopping) of nucleons.
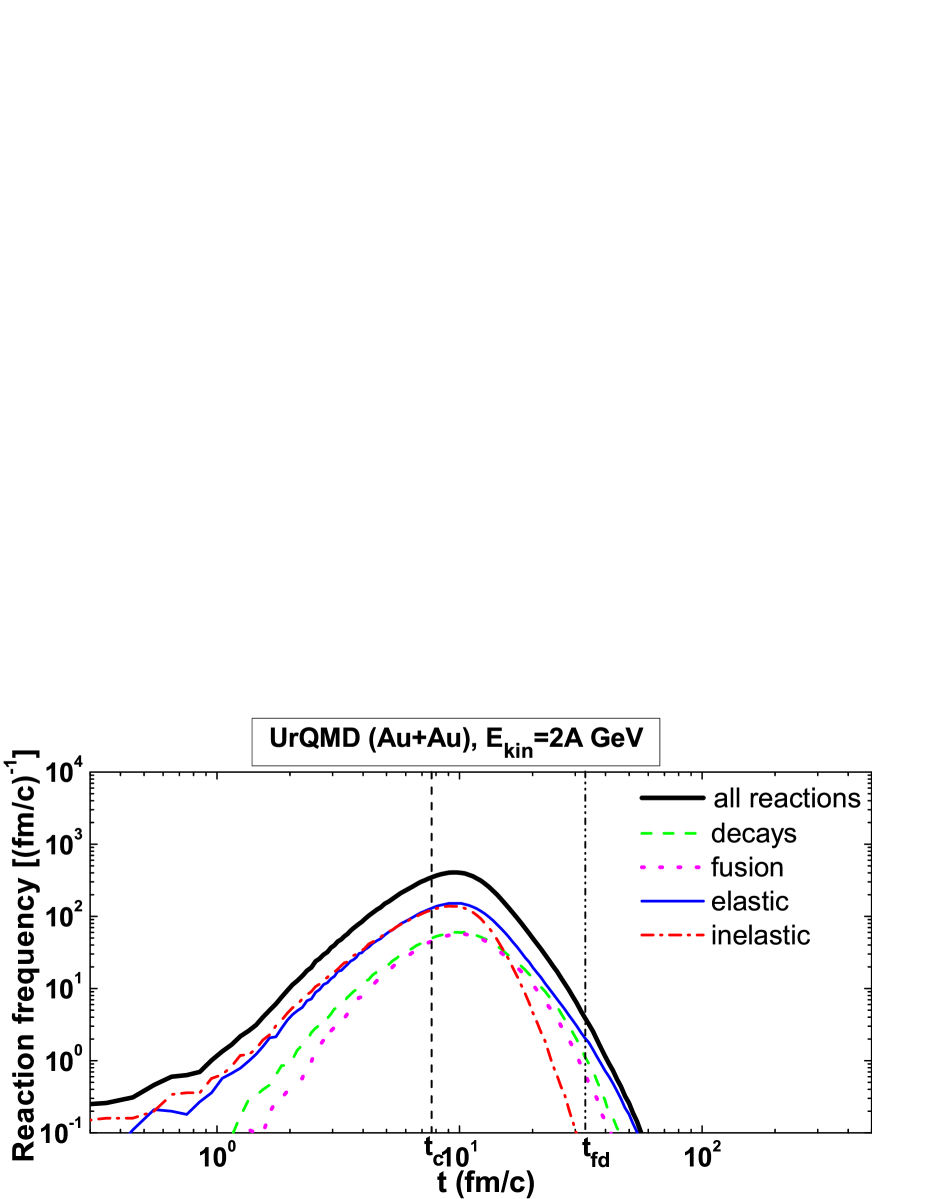
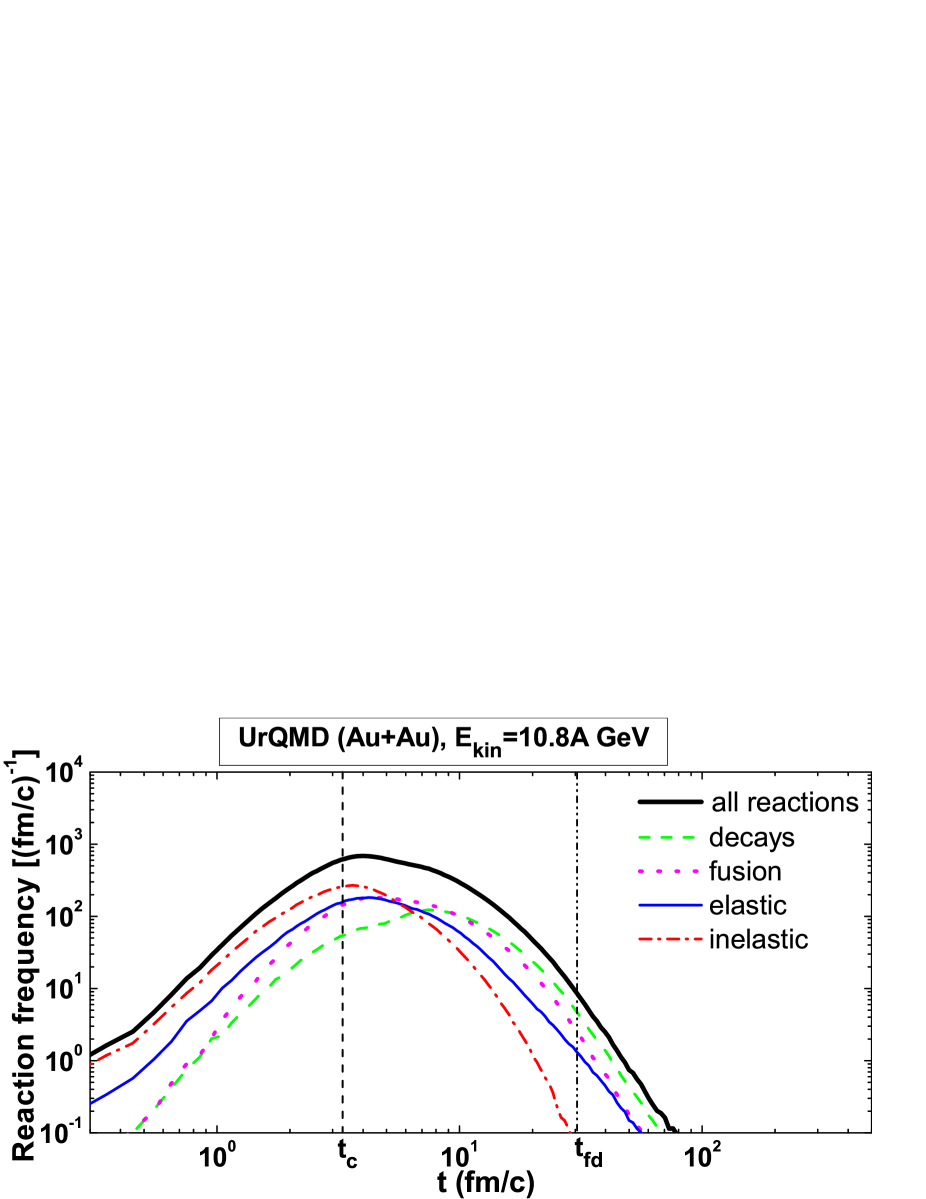
As it is seen in Figs. 10-12, for all energies, the inelastic and elastic nucleon collisions dominate at the first stage, , of a nucleus-nucleus collision. At AGS energies, these reactions are most dominant at all times except for very late time moments. After the full overlap of the nuclei, the created system begins to expand in space, which results in a decrease of the reaction frequency, as the nucleon reactions and the reactions involving secondary particles become less and less intense.
The structure of the reaction frequency changes at higher energies available at SPS. As the collision energy increases, the maximum overlap of colliding nuclei happens at earlier times (see Eq. (10) and Figs. 11-12) due to a bigger initial velocity and the Lorentz contraction of colliding nuclei and more secondary particles are created at this stage. The total contribution of the secondary particles becomes more significant at SPS energies, than at AGS energies, due to an increase of the number of secondary particles with the collision energy. The number of secondary particles (mainly mesons) is approximately per nucleon under AGS conditions [18] and under SPS conditions [19, 20]. Frequency of hadronic reactions at subsequent times after nuclei overlap may be somewhat specific to the implementation of string dynamics in UrQMD. New hadronic particles are created in UrQMD through string fragmentation and have a formation time, whereas the dynamics of the partons during that formation time are not implemented in UrQMD. The contribution of the unformed hadrons, where explicit treatment of partonic degrees of freedom is important, to the energy density and collision dynamics of system was studied within UrQMD model in Ref. [21]. Those studies indicate that, after the maximum overlap of nuclei, the partonic degrees become dominant for some duration, hence this indicates the emergence of a partonic stage and possible reason why the reaction frequency goes down at SPS energies after nuclei overlap (see Figs. 11-12). The processes involving already formed secondary hadrons (mainly, decays and fusions) are most intense at later times in the interval of fm/. Evidently, this causes the appearance of the second local maximum of the hadronic reaction frequency at SPS energies (see values in Table 5), which coincides with the local maxima of the decay and fusion reactions (see the thick solid line in Figs. 11 and 12). Similar behavior of the reaction frequency can be seen as well in Ref. [22], Fig. 1, for Pb-Pb collisions at GeV.
Naturally, we come to the prediction concerning higher energies. With increase of the collision energy, the appearance of two local maxima indicates a separation of the total frequency of hadron reactions into two parts: the first part is mainly attributed to nucleon processes with the most intensive reactions occurring when two colliding nuclei fully overlap, see Eq. (10), and the second part is mainly attributed to decay, fusion, and elastic reactions involving already formed secondary particles, the total duration of the second stage gradually increases with the collision energy. For accurate treatment of the intermediate stage, which emerges after the nuclei overlap, an explicit account for partonic degrees of freedom appears to be necessary, especially at higher collision energies.
At later times after , the reaction frequency goes down, which results in the division of a fireball into two spatial parts at the time moment and in the further breakup. The fireball division time is defined as the minimum value of time on the space-like hypersurface, which bounds the region of the cold fireball (blue area) from above, i.e., (see Figs. 6-8). We note that the time moment depends weakly on the collision energy (see Table 5). It is seen that, after the time moment , the rates of elastic and inelastic reactions vanish. In other words, the system behavior is determined since this moment mainly by the individual properties of particles (basically, by resonances). That is why, in spite of the sufficient difference of collision energies of the experiments under consideration, the times are approximately the same (see Table 5). For this reason, the longitudinal sizes of the fireballs at the time moment of division into two separate parts, , are approximately the same and equal to [ is defined in Eq. (10), see Figs. 6-8]. This fact can explain the weak dependence of the pion interferometric radius on the beam energy [23, 24] because . So, it can be claimed that the fireball achieves its maximum longitudinal size as one spatial object at the time moment , when it is divided into two different spatial parts.
4 Discussion and conclusions
Different parameters such as the energy density, particle density, mean free path, etc., can be used to analyze the fireball evolution. Our approach allows one to investigate the spatial and temporal structures of the hadron system created in relativistic nucleus-nucleus collisions in terms of hadronic reactions that occur in the system. In other words, the fireball is identified as a system of interacting hadrons. The proposed algorithm gives possibility to separate, with a given accuracy, the space-time region, where the most intense hadron reactions take place, i.e. we give the method to see a reaction zone in the 3D representation (see Fig. 2) and in different projections.
In the present microscopic study, we separate a fireball into the following regions, which characterize its evolution (see Figs. 6-8): (1) a fireball region, where 60% of all inelastic hadronic reactions have occurred (yellow area), (2) a fireball region, where 80% of all inelastic hadronic reactions have occurred (yellow plus dark-red area), (3) a hot fireball region, where 99% of all inelastic hadronic reactions have occurred (yellow plus dark-red plus red area), (4) a cold fireball region (blue area), which together with the hot fireball contains 99% of all hadronic reactions . The last region (blue area in Figs. 6-8) contains the hadron-resonance gas, and the reactions in this region are mainly presented by decays of resonances if we consider times , see Figs. 10-12.
The study of hadron reaction zones allows one to analyze the freeze-out process in relativistic nucleus-nucleus collisions. Indeed, in the literature, the sharp freeze-out hypersurface is usually defined with the help of some parameter which takes the critical value on the hypersurface, i.e. the equation for that hypersurface reads as . For instance, this quantity can be chosen as particle density [1, 2], energy density [2, 3], temperature [4, 5], etc. Moreover, the “classical” definition of sharp kinetic freeze-out assumes the Cooper–Frye picture [13]: a radiation of free particles or the freeze out process takes place within a thin layer determined by a freeze-out hypersurface; this approach is usually used to describe transition from the fluid dynamical stage of heavy-ion collision to the stage of dilute hadron gas. That is why, the initial value problem for the radiation of free hadrons is formulated with the use of the space-like piece of the hypersurface, whereas the boundary conditions are formulated exploiting the time-like part of the hypersurface. Thus, the knowledge of the freeze-out hypersurface is important for estimation of the spectrum of secondary particles, for instance pions. On the other hand, if we determine the reaction zone as that containing, for example, 99% of all reactions, then we can claim that the sharp kinetic freeze-out hypersurface should be definitely inside this zone (see Figs. 6-8) while the parametrization of iso- hypersurface of the form given in Eq. (7) can be used to define this hypersurface. Indeed, as was found in [2] the pion freeze-out hypersurface which is calculated from equation , where fm-3, approximately coincides with the hypersurface which bounds reaction zone that contains 80% of all inelastic hadronic reactions. (Here the value of is chosen from the condition that the freeze-out size of the pion system is to be adequate to known HBT radius.) Assuming that the chemical freeze-out occurs, when the inelastic reactions are completed (see Ref. [25]), we can also claim that the chemical freeze-out hypersurface should be inside the reaction zone, which contains 99% of all inelastic reactions.
While the Cooper-Frye picture is convenient to use and has many applications in heavy-ion collisions, it is also a rather crude idealization of the freeze-out process. The more realistic approach could be a description of the freeze-out process from the extended space-time layer (volume) rather than from the space-time hypersurface [26, 27]. Considering different reaction zones in particular projections, which are presented in our work, we can conclude that such a freeze-out layer is most extended in time in the central region and, especially at higher collision energies, it becomes very narrow at the sides of - projection, where the amount of matter which can leave the interacting system becomes minimal (see different areas in Figs. 6-8).
By studying the time dependence of the reaction frequency for different reaction types, we conclude that the total hadronic reaction rate is dominated by elastic and inelastic hadron collisions at the early stage, whereas the individual properties of particles (basically, resonances) and reactions involving secondary particles determine the behavior of the system at later stages. The initial stage is characterized by the fireball formation time which is defined as the time of the full overlap of two nuclei and thus it is determined by collision energy [Eq. (10)]. With increase of collision energy this time moment is a good estimation of the time moment , which is a maximum of nucleon-nucleon reaction frequency. During the initial stage a hot and dense nuclear matter is created, while the partonic degrees of freedom play more important role in subsequent evolution of the system, especially at higher collision energies. At later times, the hadronic evolution is determined mainly by decay and fusion reactions which are most intense at time moment (see Table 5), and the total duration of this stage increases with collision energy. Hence, the features of the second stage are mainly determined by the individual properties of secondary particles. Another specific time point in the evolution of a hadron fireball is the fireball division time , which corresponds to the separation of the fireball into two different spatial parts and depends weakly on the collision energy (see the last column in Table 3).
Acknowledgements
Authors are thankful to L. Csernai for useful discussions and to L. Bravina for valuable comments. D.A. was supported by the program “Microscopical and phenomenological models of fundamental physical processes at micro and macro scales” (Section of physics and astronomy of the NAS of Ukraine).
References
- [1] D. Adamova et al. (CERES Collaboration), Phys. Rev. Lett. 90, 022301 (2003) [arXiv:nucl-ex/0207008].
- [2] D. Anchishkin, V. Vovchenko and L.P. Csernai, Phys. Rev. C 87, 014906 (2013) [arXiv:1211.1927 [nucl-th]].
- [3] V.N. Russkikh and Y.B. Ivanov, Phys. Rev. C 76, 054907 (2007) [arXiv:nucl-th/0611094].
- [4] H. von Gersdorff, L. McLerran, M. Kataja, and P.V. Ruuskanen, Phys. Rev. D 34, 794 (1986).
- [5] P. Huovinen, Eur. Phys. J. A 37, 121 (2008) [arXiv:0710.4379 [nucl-th]].
- [6] J. Cleymans, H. Oeschler, K. Redlich, and S. Wheaton, Phys. Rev. C 73, 034905 (2006) [arXiv:hep-ph/0511094].
- [7] B.I. Abelev et al. (STAR Collaboration), Phys. Rev. C 79, 034909 (2009).
- [8] M.M. Aggarwal et al. (STAR Collaboration), Phys. Rev. C 83, 034910 (2011) [arXiv:1008.3133 [nucl-ex]].
- [9] D. Anchishkin, A. Muskeyev, and S. Yezhov, Phys. Rev. C 81, 031902 (2010) [arXiv:1004.0431 [nucl-th]].
- [10] L.V. Bravina, I.N. Mishustin, N.S. Amelin, J.P. Bondorf, and L.P. Csernai, Phys. Lett. B 354, 196 (1995).
- [11] L.V. Bravina, I.N. Mishustin, J.P. Bondorf, Amand Faessler, and E.E. Zabrodin, Phys. Rev. C 60, 044905 (1999) [arXiv:nucl-th/9907061].
- [12] S.A. Bass, A. Dumitru, M. Bleicher, L. Bravina, E. Zabrodin, H. Stöcker, and W. Greiner, Phys. Rev. C 60, 021902 (1999) [arXiv:nucl-th/9902062].
- [13] F. Cooper and G. Frye, Phys. Rev. D 10, 186 (1974).
- [14] B. Tomasik and U.A. Wiedemann, Phys. Rev. C 68, 034905 (2003) [arXiv:nucl-th/0207074].
- [15] C.M. Hung and E. Shuryak, Phys. Rev. C 57, 1891 (1998) [arXiv:hep-ph/9709264].
- [16] S.A. Bass et al., Prog. Part. Nucl. Phys. 41, 255 (1998) [arXiv:nucl-th/9803035].
- [17] M. Bleicher et al., J. Phys. G 25, 1859 (1999) [arXiv:hep-ph/9909407].
- [18] J.L. Klay et al. (E895 Collaboration), Phys. Rev. C 68, 054905 (2003) [arXiv:nucl-ex/0306033].
- [19] C. Alt et al. (NA49 Collaboration), Phys. Rev. C 77, 024903 (2008) [arXiv:0710.0118 [nucl-ex]].
- [20] S.V. Afanasiev et al. (NA49 Collaboration), Phys. Rev. C 66, 054902 (2002) [arXiv:nucl-ex/0205002].
- [21] H. Weber, C. Ernst, M. Bleicher, L. Bravina, H. Stöcker, W. Greiner, C. Spieles, and S.A. Bass, Phys. Lett. B 442, 443 (1998) [arXiv:nucl-th/9808021].
- [22] M. Bleicher and J. Aichelin, Phys. Lett. B 530, 81 (2002) [arXiv:hep-ph/0201123].
- [23] C. Adler et al. (STAR Collaboration), Phys. Rev. Lett. 87, 082301 (2001) [arXiv:nucl-ex/0107008].
- [24] J. Adams et al. (STAR Collaboration), Phys. Rev. C 71, 044906 (2005) [arXiv:nucl-ex/0411036].
- [25] U. Heinz, Nucl. Phys. A 661, 349 (1999) [arXiv:nucl-th/9907025]; Nucl. Phys. A 685, 414 (2001).
- [26] E. Molnár, L.P. Csernai, V.K. Magas, A. Nyíri, and K. Tamosiunas, Phys. Rev. C 74, 024907 (2006) [arXiv:nucl-th/0503047].
- [27] E. Molnár, L.P. Csernai, V.K. Magas, Zs.I. Lázár, A. Nyíri, and K. Tamosiunas, J. Phys. G 34, 1901 (2007) [arXiv:nucl-th/0503048].