Life after eruption – II. The eclipsing old nova V728 Scorpii
Abstract
The old nova V728 Sco has been recently recovered via photometric and spectroscopic observations, 150 years after the nova eruption. The spectral properties pointed to a high-inclination system with a comparatively low mass-transfer rate. In this paper we show that the object is an eclipsing system with an orbital period of 3.32 h. It has enhanced long-term variability that can be interpreted as ’stunted’ dwarf-nova-type outbursts. Using the ingress and egress times of the eclipsed components we calculate the radius of the central object. The latter turns out to be significantly larger than a white dwarf and we identify it with a hot inner disc. The implications for models on the behaviour of post-novae are discussed.
keywords:
binaries: close – eclipsing – novae, cataclysmic variables1 Introduction
A nova eruption is a thermonuclear explosion on the surface of an accreting white dwarf. In the process, a part of the outer layers of the white dwarf is ejected as a nova shell. It is not clear if the expelled material amounts to less or more than the accreted material, although the newest studies point to the former possibility (Zorotovic, Schreiber, & Gänsicke, 2011). In the case of classical novae, the donor usually is a late-type main-sequence star. This makes the system hosting the nova event a cataclysmic variable (CV). Since the CV is not destroyed by the explosion, it is safe to assume that a nova eruption is a recurrent event. A typical shell mass of – (e.g., Yaron et al., 2005) and an upper limit of the average mass-transfer rate of (Townsley & Gänsicke, 2009) then translates to recurrence times . This is now also supported observationally (Shara et al., 2012a).
Nova eruptions can thus be expected to be part of the evolution of every CV, assuming that the mass-transfer rate is high enough to accumulate the necessary critical amount of material on the surface of the white dwarf within the lifetime of the system. Hence, once the effects of the nova eruption have worn off, the behaviour of the underlying CV should be determined (once again) by the properties that make it part of one of the many subtypes of CVs, i.e. especially its orbital period, mass-transfer rate and the magnetic field strength of the white dwarf. There are several post-novae that corroborate this assumption, e.g. DQ Her (Nova Her 1934) is the prototype intermediate polar (Warner, 1983), and RR Pic (Nova Pic 1925) belongs to the SW Sex stars (Schmidtobreick, Tappert, & Saviane, 2003). Of special importance in this context is the discovery of an ancient nova shell around the dwarf novae Z Cam and AT Cnc (Shara et al., 2007, 2012b), which made these the first CVs to be established as post-novae not based on the observation of the actual nova eruption.
Within our project to establish a sample of post-novae to compare their characteristics as a group we have recently recovered the position of the system V728 Sco (Nova Sco 1862; Tebbutt, 1878) 150 yr after its eruption (Tappert et al., 2012, hereafter Paper I). The spectral characteristics indicated a high system inclination and a comparatively low mass-transfer rate. Here we present a more detailed study of that object.
2 Observations and reduction
| Date | Filter/grism (Å) | (s) | (h) | |
|---|---|---|---|---|
| 2012-03-25 | #20 [6035–7135, 3.8] | 3 | 900 | 1.78 |
| 2012-03-26 | #20 [6035–7135, 3.8] | 24 | 600/300 | 2.37 |
| 2012-03-27 | #20 [6035–7135, 3.8] | 41 | 300 | 3.84 |
| 2012-03-28 | 299 | 20 | 4.59 | |
| 2012-04-01 | 151 | 20 | 2.54 | |
| 2012-05-15 | 61 | 40 | 1.29 | |
| 2012-05-16 | #7 [3015–5190, 7.0] | 12 | 300 | 1.04 |
| #16 [5965–10250, 13.6] | 10 | 300 | 1.09 |
We observed V728 Sco during observing runs in 2012 March and in May, using EFOSC2 (Eckert, Hofstadt, & Melnick, 1989) mounted on the ESO-NTT at La Silla, Chile. We employed the Bessell filter to obtain a photometric light curve, the medium resolution grism #20 to measure radial velocities and the two low resolution grisms #7 and #16 to examine the spectral variation of the blue and the red part of the spectrum throughout eclipse. The observations are summarized in Table 1. It states the start of the night of the observations and the filter or grism used for the photometric or spectroscopic observations, respectively. The column for the latter also includes the nominal wavelength range and the spectral resolution as the typical full width at half-maximum (FWHM) of an arc line. The actual useful wavelength range is somewhat shorter for the low resolution grisms: due to the efficiency limits the signal-to-noise ratio (S/N) decreases strongly at wavelengths 3650 Å (grism #7) and 9500 Å (grism #16). The latter grism additionally suffers from fringing for wavelengths 7000 Å. Table 1 furthermore contains information on the number of frames taken, the exposure time of an individual data frame, and the time range covered by the observations.
2.1 Photometry
The reduction of the photometric data includes the subtraction of bias frames, but no flat-field correction because EFOSC2 flats are affected by a central light concentration. Using iraf’s daophot package, relative photometric magnitudes were obtained for all stars that were found by the daofind algorithm. On some frames during deep eclipse, the target (V728 Sco) was not detected by that routine, and its position was determined with respect to a number of neighbour stars. An aperture radius of 3.0 pixels was used for all measurements. The data subsequently served as input for the standalone daomatch and daomaster routines (Stetson, 1992). Differential magnitudes for V728 Sco were computed with respect to the average of 11 suitable comparison stars in the neighbourhood (200 pixels). Since no standard star data were taken during these observing runs, calibrated magnitudes were obtained by comparison with the photometric data reported in Paper I. We furthermore computed differential light curves for all other stars on the field, but did not find any clear intrinsic variability for any of them.
2.2 Spectroscopy
The spectroscopic data were reduced by subtracting the nightly average bias frame and by dividing them by an average flat-field. The latter had been normalised for its spectral energy distribution by division through a high-order cubic spline fit along the dispersion axis. The spectra were subsequently extracted using the implementation of the optimal extraction algorithm (Horne, 1986) in IRAF’s apall routine. Wavelength calibration was performed using Thorium-Argon spectra that were taken during the afternoon. Flux-calibrated spectra for grisms #7 and #16 were obtained in comparison to the standard star LTT 7987 that was observed during the same night. Since an absolut flux calibration was not necessary for our purposes we did not perform any correction for slit losses. No flux standards were observed for the grism #20 spectra, which nevertheless were corrected for the instrumental response function using previously taken data.
3 Results
3.1 Light curves and the orbital period
| HJD2 450 000 | (mag) | (mag) | Notes |
|---|---|---|---|
| 4972.5 | 18.47(11) | Calibrated data | |
| 5742.5 | 17.431(03) | 18.03(01) | Acquisition frame |
| 6012.5 | 16.41(02) | 17.01(02) | Acquisition frame |
| 6013.5 | 16.49(03) | 17.08(03) | Acquisition frame |
| 6014.5 | 16.61(02) | 17.21(02) | Acquisition frame |
| 6015.5 | 17.33(09) | Light curve | |
| 6019.5 | 18.43(20) | Light curve | |
| 6063.5 | 17.36(14) | Light curve | |
| 6064.5 | 16.81(01) | 17.41(02) | Acquisition frame |
| Cycle | Data | OC | OC | |
| (HJD245 6000) | ( d) | (orbits) | ||
| 13.8704(23) | 14 | #20 | 2.37 | 0.0017 |
| 14.837 88(57) | 7 | #20 | 6.62 | 0.0048 |
| 15.807 30(23) | 0 | 3.80 | 0.0027 | |
| 19.818 24(31) | 29 | 5.34 | 0.0039 | |
| 63.672 88(58) | 346 | 4.08 | 0.0029 | |
| 64.6404(21) | 353 | #7 | 4.43 | 0.0032 |
| 64.7775(16) | 354 | #16 | 16.94 | 0.012 |
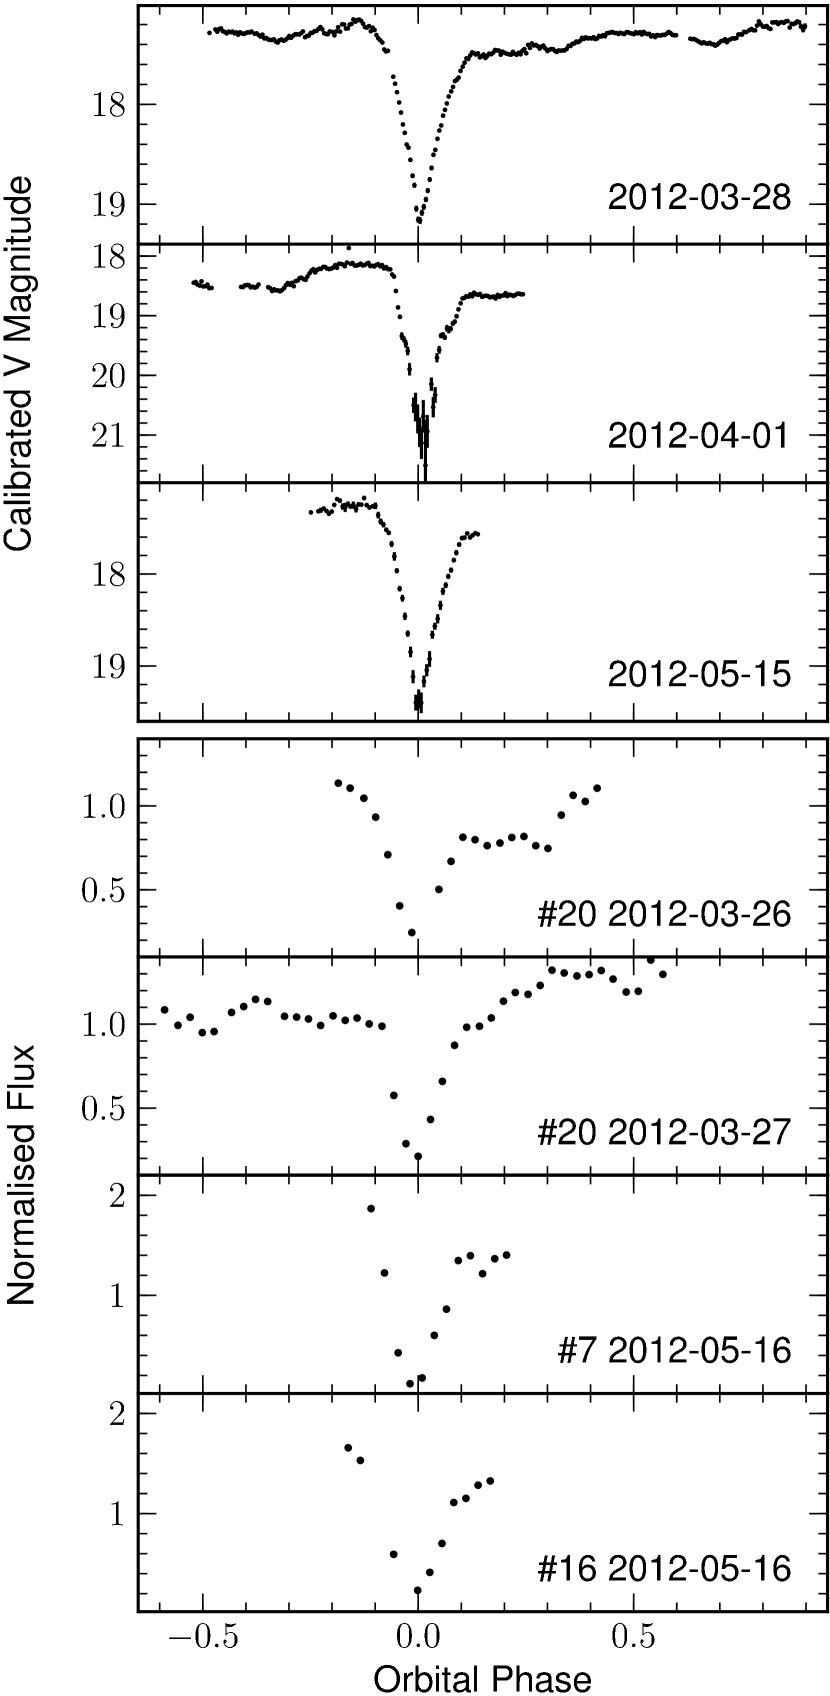
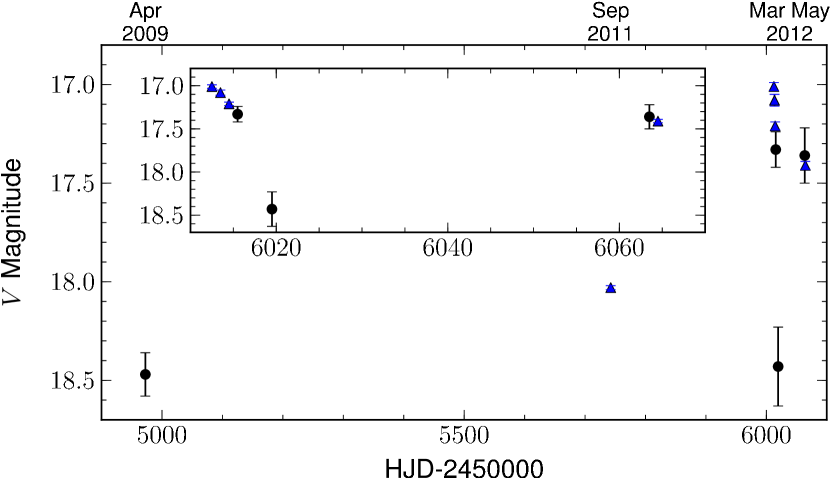
The photometric data yield the light curves shown in the top three panels in Fig. 1. The most prominent feature is doubtlessly the deep eclipse. We furthermore notice the presence of an orbital hump that lets the photometric brightness rise to a maximum just prior to the eclipse. This hump, which most probably corresponds to the hot spot, i.e. the region where the accretion from the secondary star impacts on the accretion disc, is more prominent in the second of the light curves, from April 1st, than in the other two, from March 28 and from May 15. In fact, the April data show the system in an 1 mag fainter brightness state. This bears consequences for the determination of the orbital period. In CVs, a difference in the state of brightness can correspond to different radii of the accretion disc (e.g., Smak, 1984), potentially affecting the position and the (relative) contribution of especially the hot spot. This, in turn, can have an effect on the phasing and the amplitudes of radial velocity and light curves.
Table 2 summarizes the photometric data from several observing runs. It contains the Heliocentric Julian Day (HJD) corresponding to the night of the observations, and photometric and magnitudes. The first data point was taken from the calibrated multi-colour photometry reported in Paper I, which furthermore yielded a colour index mag. The acquisition frame data correspond to the spectroscopic observing runs and were taken in the passband. The respective magnitude was calculated according to the above colour index. While the colour is supposed to change with the brightness of the system we can expect that change to amount to much less than 0.5 mag (see e.g. the series of papers by Spogli, Fiorucci, & Raimondo, 2000a, b, c). All data points were examined for their corresponding orbital phase, using equation (1). We find that none of them is affected by the eclipse. Specifically, the photometry was taken during phases 0.49–0.77, the acquisition frame of the low-resolution spectrum at phase 0.66, and the other acquisition frames just before the respective spectroscopic time series shown in Fig. 1. Lastly, the light-curve data are represented as nightly averages of the out-of-eclipse brightness. We can thus assume the influence of the orbital variability on the points shown in Fig. 2 to be minimal.
We can clearly see that V728 Sco appears to change frequently between brightness states. The photometry from 2009 May 20 and the time series photometry from 2012 April 1 find the system at out of eclipse, while the other light curves and the time series spectroscopic data catch it at an mag higher brightness. Furthermore, the low-resolution spectroscopy from 2011 June 29 apparently was taken when the system was in between the bright and the low state. While further implications of this behaviour are discussed in Section 4, at this point we regard the consequences with respect to the determination of the orbital period. The light curves in Fig. 1 indicate that the contribution of the asymmetrically placed hot spot is strongest in the low state and much fainter otherwise. We therefore assume that the eclipsed light in high state corresponds mainly to the accretion disc. The latter is situated symmetrically around the white dwarf, and thus mid-eclipse should represent the superior conjunction of the primary. In comparison, in low state the eclipse is much more structured, as different sources – the disc, the central object, the hot spot – are eclipsed, and the minimum is likely to be offset in phase with respect to superior conjunction. We thus determined the eclipse timings for the high-state data by fitting a second-order polynomial to the lowest points of the eclipses, while mid-eclipse for the low-state data was calculated from the ingress and egress times of the central object (see Section 3.5). These data are summarized in Table 3. Here, the fluxes of the spectroscopic data were calculated as the total flux in the spectral ranges 6200–7000 Å, 4000–5000 Å and 6200–8000 Å, for grisms #20, #7 and #16, respectively. They were subsequently normalized by dividing through the mean values. We then fitted the eclipse timings with a linear regression, weighting the data points according to their respective uncertainties. In this way we find the ephemeris
| (1) |
where is the cycle number.
We would like to point out that no two of our recorded eclipses are really the same. Even the two -band high-state eclipses have different depth and show different minor asymmetries and bumps. We have tested the robustness of our result by using different sets of eclipses for the determination of the orbital period. All permutations yield the same result within the errors.
3.2 Eclipse spectra
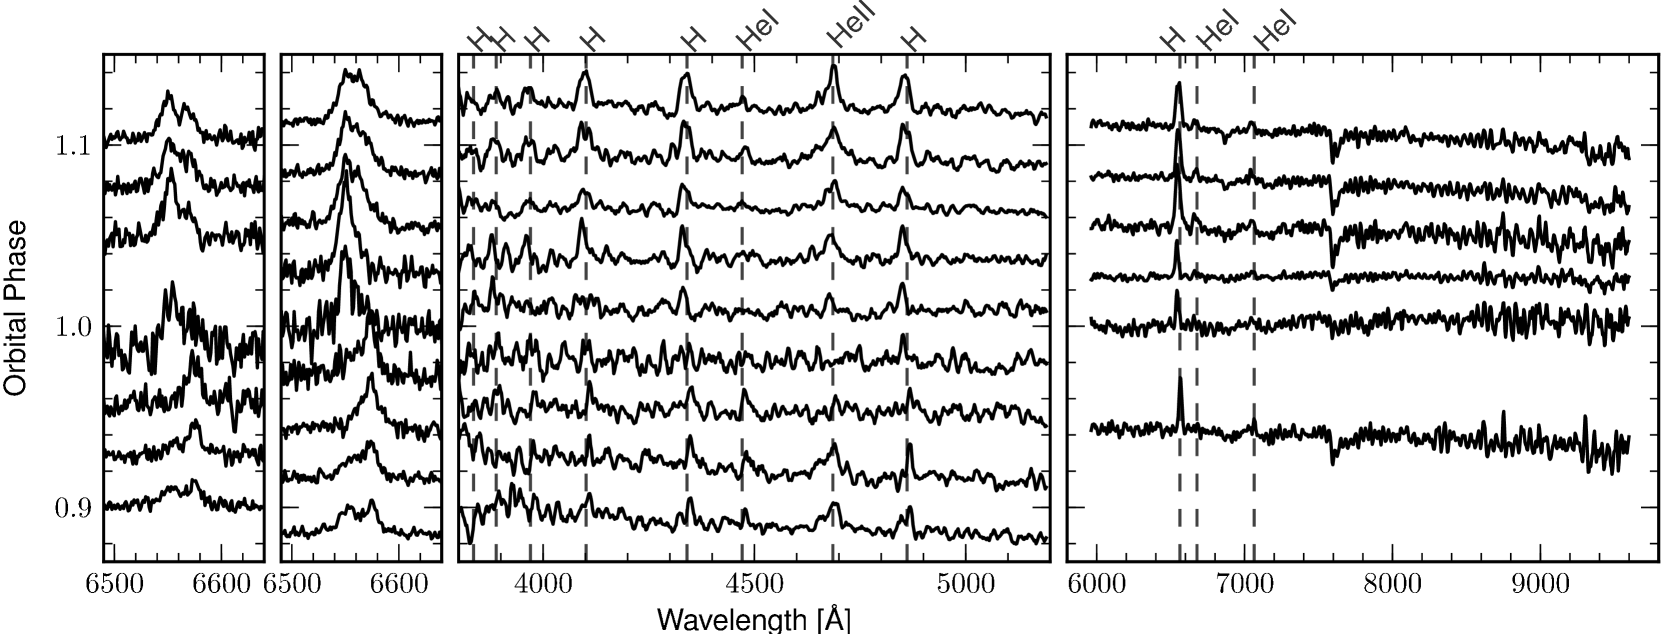
In Fig. 3 we have collected the spectral time-series throughout eclipse. These consist of the grism #20 data that show the behaviour of the H line on two subsequent nights during decline from an outburst, and the two low-resolution series of the blue and the red spectral range, taken in one night with grisms #7 and #16, respectively. The long-term light curve in Fig. 2 suggests that also the latter data were taken during decline, at an only slightly lower brightness state than the grism #20 spectra.
The high-resolution data (grism #20, the two left-hand plots) clearly show a double-peaked line profile out of eclipse. Throughout eclipse (phases 0.95–1.05) the line presents a single peak, which rapidly changes its position in mid-eclipse. This is the well-known ”Z wave“ behaviour, as first the part of the accretion disc with velocities towards the observer (that form the blue peak of the double-peak profile) and then the part with velocities away from the observer (the red peak) are eclipsed. This proves that V728 Sco is a disc system.
The grism #7 and #16 data have too low S/N to analyse the mid-eclipse spectra in detail, but they still present a couple of interesting phenomena. First, it can be clearly seen that the Heii 4686 line that out of eclipse rivals the H emission line in strength disappears completely within the limits of the S/N during mid-eclipse, while H remains visible (third plot from the left). This presents support for the existence of a hot inner disc (as discussed in Section 3.5). Secondly, we note that the slope of the red part of the spectrum (right plot) in mid-eclipse switches from negative to positive towards longer wavelengths. While such behaviour is expected during the eclipse of the hotter parts of the system, the continuum also becomes significantly more ”bumpy“ indicating that at this point and wavelength range the secondary star is the dominant light source. For that reason, there is a good chance that a high-S/N spectrum taken in mid-eclipse would be able to reveal the spectral type of that component.
3.3 Radial velocities and Doppler tomography
| Criterion | ||||
|---|---|---|---|---|
| (km s-1) | (km s-1) | (orbits) | (Å) | |
| 113(6) | 117(7) | 0.031(11) | 28 | |
| 92(9) | 128(3) | 0.037(03) | 32–44 | constant |
| 46(7) | 150(8) | 0.075(11) | 52 | Noise |
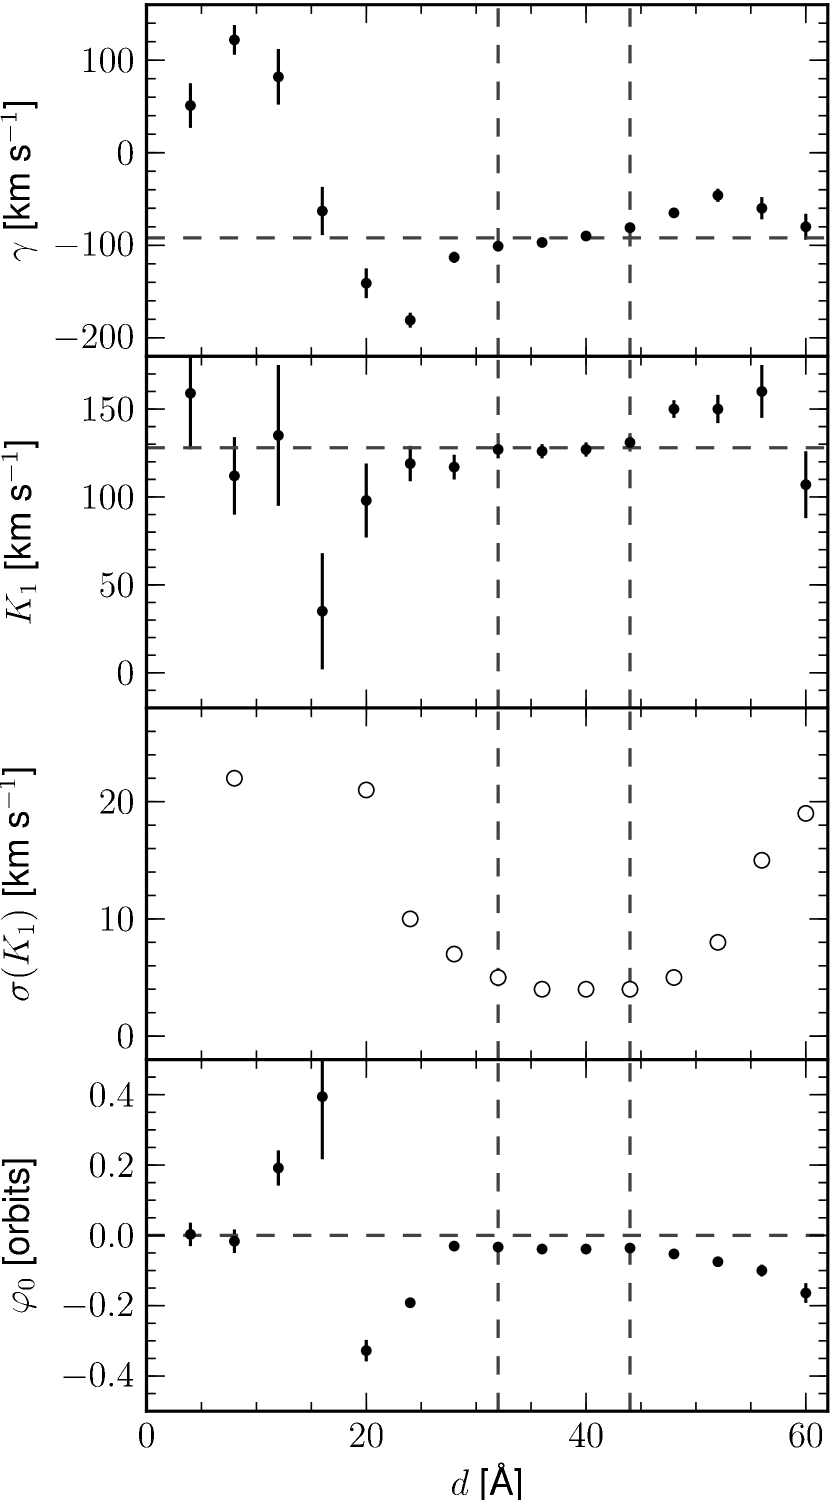
The H emission line in our data presents a broad and double-peaked line profile. We thus measure the radial velocities using the double-Gaussian technique (Schneider & Young, 1980; Shafter, 1983). Here, the line profile is convolved with two identical Gaussian curves, whose centres are separated along the wavelength axis by a quantity . The wavelength where the fluxes under the two curves are identical yields the Doppler shift of the line and thus its radial velocity. By varying and by employing sufficiently narrow Gaussian functions, different parts of the emission line can be measured. The usual assumption is that the centre of the emission line represents the part most likely affected by potentially present isolated emission sources (e.g., the hot spot or the secondary star), while the line wings are mostly formed in the inner disc and hence more faithfully reflect the motion of the primary star (see Horne & Marsh, 1986).
The useful lower limit for the FWHM of the two Gaussians is given by the spectral resolution of the data. For the grism #20 set we therefore use Gaussians with FWHM = 4 Å. As mentioned above, our two data sets were taken on two subsequent nights during decline from outburst. While the system’s brightness during that time changed by only slightly more than 0.1 mag, a visual inspection (Fig. 3) reveals significant differences both in the strength of the line and in the line profile. This is corroborated by comparing the equivalent widths and radial velocities for corresponding orbital phases. We are thus not allowed to mix the two data sets, and since the March 26 data do not cover a complete orbit, we choose the March 27 data for the further analysis, excluding the spectra around the eclipse (orbital phases 0.9–1.1).
The radial velocities measured in the way outlined above are fitted with a sinusoidal function of the form
| (2) |
where is the constant term, the semi-amplitude and the orbital phase with respect to . The phases have been calculated according to equation (1), and so one would expect for equation (2) describing the motion of the white dwarf with marking the point of its superior conjunction and thus coinciding with the photometric eclipse. In order to identify the region of the line that follows the motion of the white dwarf, Shafter (1983) introduced the so-called diagnostic diagram, where the parameters of equation (2) are plotted as a function of the separation of the two Gaussians. The diagram for our data is shown in Fig. 4. The parameters present strong fluctuations at small separations corresponding to the centre of the line, remain comparatively constant at medium separations and become variable again at larger separations when the noise begins to dominate the line wings. The plot gives us three possibilities to choose the parameters, summarized in Table 4. First, we can use the point where is closest to 0, corresponding to photometric eclipse. Ignoring the disturbed central part of the line this is the case for a separation . Secondly, we can take the average for the range , where is constant. And thirdly, represents the last point before the error of the semi-amplitude increases sharply, thus indicating the start of the noise-dominated parts. Since a closer inspection shows that Gaussians with still sample part of the peaks of the line, and since the radial velocity curve corresponding to already presents a large amount of noise, we favour the second criterion and adopt the respective parameters for the further analysis.
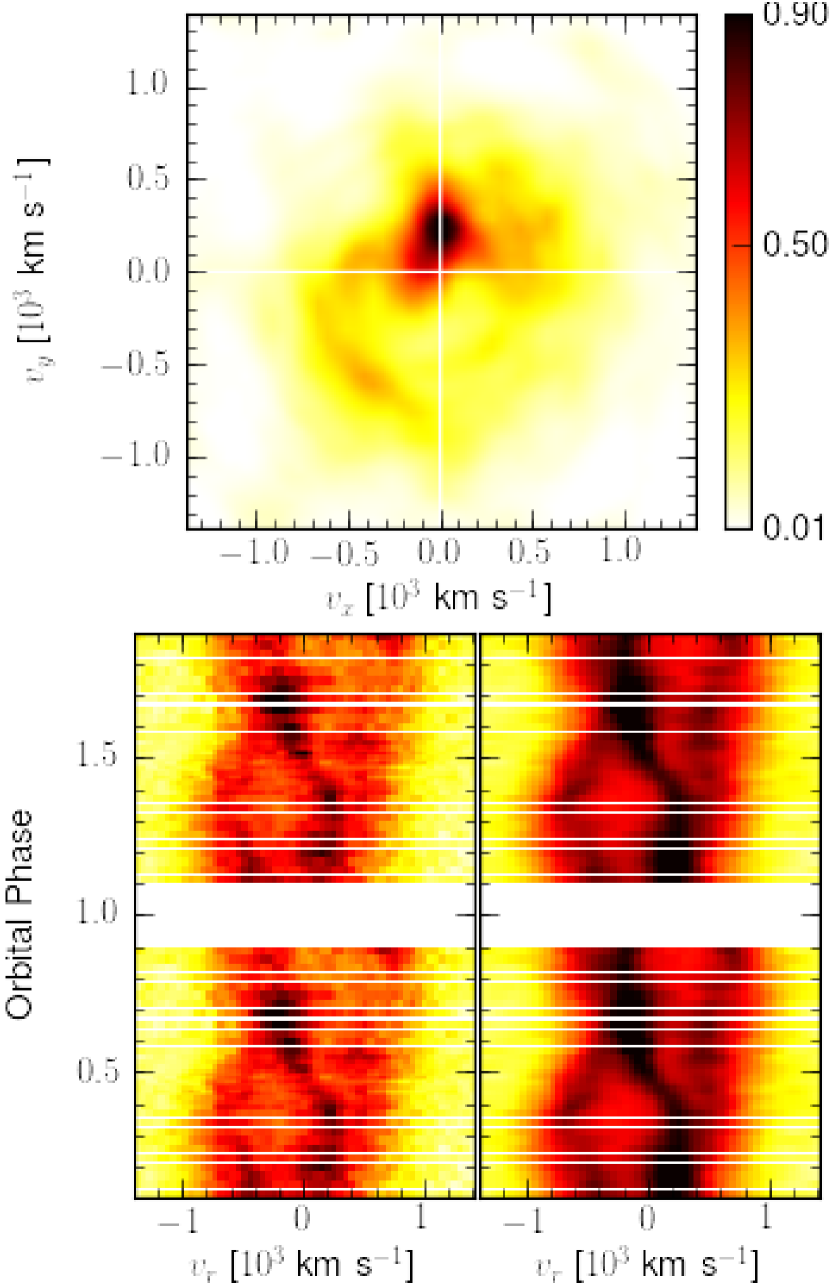
Fig. 5 shows the Doppler map for the same data set using the code from Spruit (1998) with the idl environment being replaced with a eso-midas routine (Tappert et al., 2003). The input data consist of the phase-sorted spectra (again excluding the phases around eclipse) and the velocity. The latter is iteratively adjusted by comparing the average input spectrum with the reconstructed one. The final result was . Doppler mapping visualizes the emission distribution in the system in velocity space. The orientation of the map is such that it shows the system at orbital phase 0.25, so that the primary star has velocities and the secondary star accordingly , where and are the semi-amplitudes of the radial velocity curves of the white dwarf and the red dwarf, respectively. The centre-of-mass is situated at and is marked in the plot as the point of intersection of the vertical and the horizontal line. The two lower plots show the trailed spectrogram (in phase) from the input data (left) and the one reconstructed from the Doppler map (right). We see that the velocity behaviour of the emission components is well reproduced; however, the variation in intensity is not. This is due to Doppler tomography assuming that all emission sources are constant in intensity at all phases (Marsh & Horne, 1988). This formal prerequisite is in practice almost never fulfilled, and especially not in high-inclination systems, where the individual emission sources at certain phases are obscured by other components. However, in the Doppler map this should only affect the relative intensities of the emission sources but not their positions.
We then find a prominent isolated component at velocities () = (-25,191) km s-1. Since the resolution of the map is 50 km s-1 per pixel, the offset in is sufficiently small to identify the orbital phase of the emission with that of the secondary star. For a more precise measurement we have fitted the component with a Gaussian in those spectra in which it was clearly visible. A Fourier fit to these data yielded and orbits, which confirms above interpretation. Apart from the emission lines our grism #16 spectra do not show any evidence of spectral features from the secondary out of eclipse, and it thus can be assumed that the observed emission component is not due to magnetic activity, but caused by illumination from the white dwarf or the accretion disc. The emitting source will then be limited to the side of the secondary star facing the white dwarf, and its velocity will not correspond to the centre-of-mass of the secondary star, but to a point in between that and the Lagrangian Point . We will come back to that in Section 3.4.
The area of the isolated emission is somewhat extended towards lower and more negative velocities, and is likely to represent emission from the gas stream or close to the hot spot. The latter itself is optically thick and does not present any (significant) contribution to the H line. This can also be seen in the behaviour of the H flux (lower plot of Fig. 6) which is declining as soon as the hot spot comes into the line of sight. We also see that this flux forms a second local minimum at orbital phase 0.45. A possible explanation is that part of the H emission is produced in the gas stream from the secondary and/or a shock front close to the hot spot, and that this part is eclipsed by the hot inner disc or the optically thick hot spot (see the sketch in the top panel of Fig. 6). Emission from the accretion disc is present, although its shape is not that of a closed circle but is rather more reminiscent of that of spiral waves (e.g., Steeghs, 2001). This would not be an unexpected feature in an outbursting CV, but here might just be an artifact, since the present data are very limited in both time- and spectral resolution, as well as in S/N.
3.4 System parameters from the spectroscopy
In order to obtain a more detailed picture of V728 Sco we need to know its system parameters. Since the present data lack completeness and quality we have to make several assumptions in the process. Consequently, this section will not describe the definite but a possible configuration of V728 Sco. Our assumptions are the following:
-
1.
The value extracted from the diagnostic diagram reflects the motion of the white dwarf. While the double Gaussians did not sample the extreme wings, the constancy of over a wide range of separations makes it a good candidate for .
-
2.
The additional emission component corresponds to an illuminated surface on the secondary star. The middle plot of Fig. 6 shows a close-up of the photometric light curves to emphasize the behaviour out of eclipse. The signature of the illuminated surface of the secondary star can be clearly seen as a broad maximum opposite the eclipse phase. While we do not know the extent of that surface, it is safe to assume that its velocity lies in between the velocity of the first Lagrange point and the velocity of the centre-of-mass of the red dwarf , and it probably will be closer to the former of those two. At the same time, the secondary star is elongated due to the Roche lobe deformation, and in the orbital plane the distance from L1 to the secondary’s centre-of-mass is larger than the equivalent radius of the red dwarf. For the sake of simplicity, we will assume that the distance from the centre-of-mass of the secondary to the centre-of-mass of the system is the sum of the distance of the centre of the additional emission component to the latter and the radius of the secondary, i.e. .
-
3.
The system is seen at a high orbital inclination. This is less an assumption rather than a conclusion from the presence of a deep and structured photometric eclipse. We have performed the subsequent calculations for several inclinations , finding only small differences in the respective results. Taking into account the photometric results (Section 3.5) we adopt .
-
4.
Our final assumption regards the type, size and mass of the secondary star. It is the least certain of all, because it is mainly based on statistics. Beuermann et al. (1998) find, based on the catalogue of Ritter & Kolb (2003), that the secondaries of the CVs in the period range of 3–4 h have spectral types M3–M5, with most of them being clustered at M4V. Boyajian et al. (2012) conducted an interferometric survey on late-type dwarfs. Their result for spectral type M4 is based on a single object, GJ 699, for which they determine and . In CVs, the respective parameters are likely to be different. A linear-weighted fit to the secondary masses collected in the Ritter & Kolb (2003) catalogue (version 3.18) for CVs with orbital periods between 3 and 4 h yields the formal relation
(3) for in M⊙ and in d. For the fit we have excluded masses without error estimates, as well as three ’outliers’ (UU Aqr, CN Ori, IP Peg). For the orbital period of V728 Sco this yields . Simply computing the average for the three CVs in the immediate period neighbourhood (DW UMa, V603 Aql, V1315 Aql, with orbital periods between 3.27 and 3.36 h) yields , proving that above fit is reasonable. We then can calculate the radius using the equation (16) from Knigge, Baraffe, & Patterson (2011) that corresponds to our mass and period regime,
(4) obtaining .
With these assumptions, we can calculate the velocity of the white dwarf
| (5) |
and its distance to the centre-of-mass
| (6) |
The corresponding distance for the secondary star is
| (7) |
yielding the distance between the stellar components to
| (8) |
The velocity of the red dwarf calculates as
| (9) |
and the mass ratio results to
| (10) |
which implies a white dwarf mass of
| (11) |
All these parameters are only weakly dependent on the inclination . The parameters (5) and (6) can directly be derived from the observed quantities, yielding the ranges and for . All the remaining parameters depend on the adopted value of and the respective from Eq. (4). We determine in (10) a mass ratio , and according to (11) a white dwarf mass , a value very typical for other CVs. We will adopt these values for the further analysis of the system parameters.
3.5 Analysis of the low-state eclipse
| (∘) | (∘) | ||||
|---|---|---|---|---|---|
| 90 | 0.256 | 0.819 | 0.325 | 48 | 0.21 |
| 85 | 0.271 | 0.834 | 0.318 | 50 | 0.25 |
| 82 | 0.291 | 0.852 | 0.312 | 54 | 0.36 |
| 80 | 0.309 | 0.866 | 0.308 | 56 | 0.45 |
| 75 | 0.364 | 0.898 | 0.300 | 62 | 0.83 |
| 82∘ | |
|---|---|
| 0.36 | |
| 0.81 M⊙ | |
| 0.29 M⊙ | |
| 0.38 R⊙ | |
| 1.31 R⊙ | |
| 1.12 R⊙ | |
| 0.41 R⊙ | |
| 0.09 R⊙ | |
| 0.10 R⊙ |
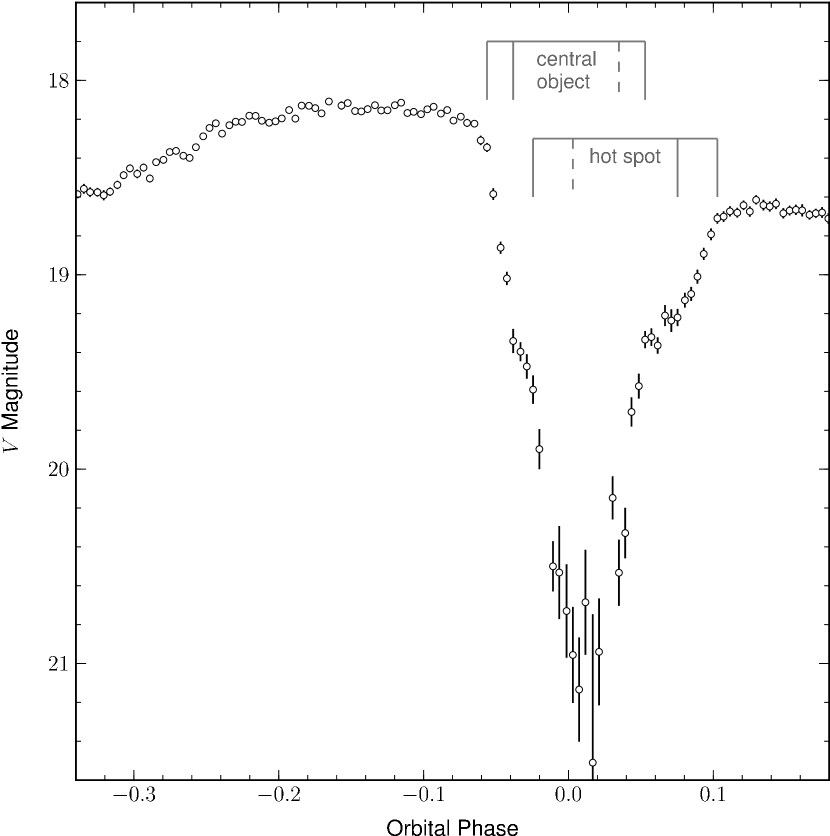
As shown in Fig. 1, we observed V728 Sco on 2012 April 1 in a brightness state that is about 1.5 mag fainter than the brightest observed value for the post-nova (from 2012 March 25). There are also remarkable differences in the corresponding light curve, showing a pronounced hump maximum at phase 0.85 and an eclipse light curve with a clear distinction of two totally eclipsed, but phase-shifted bodies: first that of a luminous source around the white dwarf location, which we will call ’central object’ (suffix CO), and later that of the hot spot (HS) (Fig. 7). Unfortunately, due to the very faint flux at eclipse minimum () some of the data points around these phases have rather large errors. In spite of this, we here present an attempt to determine some of the binary parameters in a preliminary manner.
For this purpose, we used the geometrical method described in detail by Ritter (1980) for the analysis of the data on Z Cha, a dwarf nova with similar eclipse characteristics. From our light curve, we derived for V728 Sco a total mean duration of 297 s for the ingress and egress of the central object, and 378 s for those of the hot spot. The total eclipse durations (the differences between the mean ingress and egress epochs) are 974 s for the central object and 1188 s for the hot spot. Finally, the time difference between both mid-eclipses was measured to 568 s. Applying equations 8, 9, 10 and 11 of Ritter (1980) we can derive several relations between binary parameters for different orbital inclinations, in particular the radius of the secondary star , the binary separation , the distance between the secondary star and the hot spot , the disc radius as the distance between the white dwarf and the hot spot, and the angle between the hot spot and the secondary star and with the compact object as vertex. If we adopt that is equal to the volume radius of the Roche lobe filling secondary, we can apply equations (2.5b) and (2.5c) in Warner (1995) in order to derive the mass ratio from . The results are listed in Table 5. Apparently, the mass ratio is strongly dependent on in the present analysis. On the other hand, there is only a weak dependence between and in our spectroscopic analysis (Section 3.4). We therefore use the spectroscopically determined mass ratio , in order to find the most probable orbital inclination for which this mass ratio is valid, according to the eclipse analysis. This yields .
We can now perform an approximate check on the consistency of our results. Using from Eq. (4), we derive from the photometry. This fits well with the spectroscopically determined . One has to keep in mind, however, that those results are not completely independent, because they both depend on our choice for . Another test can be done by using , , and to calculate from Kepler’s Third Law,
| (12) |
where is the gravitational constant. This results in . This differs from the photometric and spectroscopic results by 11 and 13 per cent, respectively, which still appears acceptable, regarding the uncertainties involved in our calculations of and .
In Table 6 we present a first parameter estimation of V728 Sco, using the photometrically determined value for the binary separation . The radii of the central object and the hot spot ( and , respectively) were calculated using equations 16 and 17 from Ritter (1980). The radius is at least a factor 6 larger than a typical white dwarf radius, an important observational fact which will be discussed in Section 4. The observed hump maximum at phase 0.85 mentioned above would correspond to an angle , in agreement with the calculated value in Table 5. This can be considered as an additional argument in favour of an orbital inclination near 82∘. Finally, we can compare the spectroscopically determined distance from the white dwarf to the centre-of-mass with the photometrically derived radius of the accretion disc . This yields the distance from the hot spot to the centre-of-mass to , which corresponds to a comparatively small Keplerian velocity . This fits quite well with our interpretation of the elongated extension of the emission from the secondary star seen in the quadrant of the Doppler map (Fig. 5). Note that while the latter was taken during decline from outburst, the photometric analysis corresponds to the low state, and thus the disc radii can be expected to be different (Smak, 1984). Still, due to the apparent short outburst recurrence time (Fig. 2) the changes in the disc radius during an outburst cycle are probably smaller than in other CVs.
Since there is only a single eclipse light curve available for our analysis, it was not possible to give any error bar on the estimates presented here. Furthermore it is worth repeating at this point that several parameters depend strongly on the mass of the secondary star. Its assumed value is exclusively based on statistics. The parameters in Table 6 should therefore not be taken at face value, and will have to be tested by future observations.
4 Discussion
It is of special interest that V728 Sco shows strong evidence of having a comparatively low mass-transfer rate. Its orbital period places it right into the regime of the SW Sex stars. These CVs are a group of nova-likes that dominate the orbital period range 2.8–4 h (Rodríguez-Gil et al., 2007b). The typical defining SW Sex features suggest that these are high mass transfer systems (Rodríguez-Gil, Schmidtobreick, & Gänsicke, 2007a). This is supported by their white-dwarf temperatures which is an indication for the accretion rate and which exceeds the values expected from angular momentum loss through the standard magnetic braking scenario (Townsley & Gänsicke, 2009). Recent investigations have shown that most of the non-magnetic CVs in this range and in fact all nova-likes seem to be of SW Sex type. This includes, e.g., the old nova RR Pic (Schmidtobreick et al., 2003). It has been suggested that SW Sex stars represent a stage in the secular evolution of CVs and that, in general, CVs reaching that period range share their characteristics (Schmidtobreick et al., in preparation).
In addition, most old novae are indeed high mass-transfer systems (Iben, Fujimoto, & MacDonald, 1992), and so V728 Sco appears as something of an oddball. However, it is not alone. The old nova XX Tau also shows the spectral appearance of a low mass-transfer system (Schmidtobreick et al., 2005). Rodríguez-Gil & Torres (2005) suggest an orbital period close to 3.26 h, i.e. in the immediate vicinity to V728 Sco. Another example is the system V446 Her, which has a longer orbital period (4.94 h; Thorstensen & Taylor, 2000), and shows ’stunted’ dwarf-nova-type outbursts (Honeycutt, Robertson, & Turner, 1995, 1998a) similar to what is implied by the long-term light curve of V728 Sco. Honeycutt, Robertson, & Turner (1998b) give a few more examples.
This behaviour of some post-novae has been seen as a strong indication for the validity of the hibernation model which predicts changes of the mass-transfer rate in the evolution of the pre- and post-nova (Shara et al., 1986; Prialnik & Shara, 1986). In that model the secondary star suffers an enhanced irradiation by the hot post-eruption white dwarf, is strongly driven out of its thermal equilibrium, and as a consequence maintains a much larger volume than according to its mass. The gradual cooling of the white dwarf permits the secondary to relax into its equilibrium state, ultimately losing contact with its Roche lobe, thus terminating the transfer of mass via L1, and so the post-novae enters into ’hibernation’. Hence, post-novae immediately after eruption are expected to drive a very high mass-transfer rate that will gradually decrease with time (Kovetz, Prialnik, & Shara, 1988). Once the mass-transfer rate has crossed the limit that allows for disc instabilities, dwarf-nova-type outbursts will occur (e.g., Osaki, 2005, for a review). The low-state behaviour of V728 Sco could be interpreted in this context, especially because we are here confronted with a ’rather-old’ nova, more than one century after eruption. Perhaps V728 Sco is just entering its transition from a high mass-transfer post-nova stage towards the onset of hibernation.
A different explanation for the observed large spread in mass-transfer rates for CVs was given by King et al. (1995). In their approach, the interplay between irradiation from the white dwarf and an increase in the Roche lobe radius during the phases of high mass-transfer causes long-term () oscillations of the secondary’s radius, inducing corresponding variations of the mass-transfer rate. Here, the fact that most post-novae seem to have high accretion rates would simply be a consequence of nova eruptions having a higher probability to occur during phases of high mass-transfer. This model predicts identical behaviour of the pre- and post-novae (beyond the immediate aftereffects of the nova eruption). With V446 Her, there is at least one low mass-transfer CV known that represents a strong support for this picture (Collazzi et al., 2009).
Finally, Schreiber, Gänsicke, & Cannizzo (2000) explain the low amplitudes of the outbursts in post-novae with the system maintaining a hot ionized inner disc due to irradiation by the eruption-heated white dwarf. This limits the area of the disc that can contribute to the outburst. As the white dwarf cools down, the size of the hot inner disc will gradually shrink, the outburst amplitude will increase, and the outburst frequency will decrease. The very similar amplitudes of the variation in pre- and post-eruption V446 Her (Collazzi et al., 2009) somewhat contradict that picture. Furthermore, there is as yet no evidence for a change in outburst amplitude or frequency in that post-nova (Honeycutt, Robertson, & Kafka, 2011). On the other hand, our analysis of the low state eclipse of V728 Sco yields a radius of the central object , at least a factor 6 larger than any white dwarf radius within the reasonable white dwarf mass range, and even more so for our estimated mass of 0.81 M⊙ (Provencal et al., 1998). This represents strong evidence for the existence of the predicted hot inner disc, which is furthermore supported by the presence of the strong HeII 4686 emission line in the spectra which disappears during eclipse (Section 3.2), and thus can be assumed to originate in that small part of the disc. Also, the low outburst amplitude of 1.5 mag and the high outburst frequency fit well within the framework of the Schreiber et al. model. Future long-term monitoring is desirable to properly investigate the characteristics of the outburst behaviour.
5 Summary
We have presented photometric and spectroscopic data on the recently recovered old nova V728 Sco, 150 yr after its eruption, that reveal it as an eclipsing system. Its orbital period places it in the midst of a region in the period distribution of CVs that is dominated by high mass-transfer systems. Still, the spectroscopic characteristics and the long-term variability that resembles dwarf-nova type outburst behaviour point to a comparatively low mass-transfer rate.
The low-state data are of special interest because its light curve is characterized by a total eclipse of two different bodies, that of a ’central object’ surrounding the location of the white dwarf and, phase shifted, that of the hot spot. This behaviour is well known for SU UMa type dwarf novae with as Z Cha (Warner, 1974), OY Car (Vogt et al., 1981) and HT Cas (Patterson, 1981), but, to our knowledge, it was never observed in old novae or any other type of cataclysmic variable above the period gap (). An inspection of published data of about 30 eclipsing old nova remnants revealed always V-shaped eclipse light curves, similar to those of V728 Sco at high state (Fig. 1), sometimes with short totality phases near eclipse centre. The analysis of that low state eclipse provided strong evidence for the existence of a hot inner disc, as predicted for post-novae by Schreiber et al. (2000).
V728 Sco could soon play the role of a corner stone in our understanding of post-novae and cataclysmic variables in general. This, however, will only be possible if more and better photometric and spectroscopic data become available, especially during the interesting low state. Unfortunately, this is all but trivial due to the faintness of this target.
Acknowledgments
This research was supported by FONDECYT Regular grant 1120338 (CT and NV). AE acknowledges support by the Spanish Plan Nacional de Astrononomía y Astrofísica under grant AYA2011-29517-C03-01.
We gratefully acknowledge ample use of the SIMBAD database, operated at CDS, Strasbourg, France, and of NASA’s Astrophysics Data System Bibliographic Services. IRAF is distributed by the National Optical Astronomy Observatories.
References
- Beuermann et al. (1998) Beuermann K., Baraffe I., Kolb U., Weichhold M., 1998, A&A, 339, 518
- Boyajian et al. (2012) Boyajian T. S. et al., 2012, ApJ, 757, 112
- Collazzi et al. (2009) Collazzi A. C., Schaefer B. E., Xiao L., Pagnotta A., Kroll P., Löchel K., Henden A. A., 2009, AJ, 138, 1846
- Eckert et al. (1989) Eckert W., Hofstadt D., Melnick J., 1989, The Messenger, 57, 66
- Honeycutt et al. (1995) Honeycutt R. K., Robertson J. W., Turner G. W., 1995, ApJ, 446, 838
- Honeycutt et al. (1998a) Honeycutt R. K., Robertson J. W., Turner G. W., Henden A. A., 1998a, ApJ, 495, 933
- Honeycutt et al. (1998b) Honeycutt R. K., Robertson J. W., Turner G. W., 1998b, AJ, 115, 2527
- Honeycutt et al. (2011) Honeycutt R. K., Robertson J. W., Kafka S., 2011, AJ, 141, 121
- Horne (1986) Horne K., 1986, PASP, 98, 609
- Horne & Marsh (1986) Horne K., Marsh T. R., 1986, MNRAS, 218, 761
- Iben et al. (1992) Iben, Jr. I., Fujimoto M. Y., MacDonald J., 1992, ApJ, 384, 580
- King et al. (1995) King A. R., Frank J., Kolb U., Ritter H., 1995, ApJ Letters, 444, L37
- Knigge et al. (2011) Knigge C., Baraffe I., Patterson J., 2011, ApJ Suppl. Series, 194, 28
- Kovetz et al. (1988) Kovetz A., Prialnik D., Shara M. M., 1988, ApJ, 325, 828
- Marsh & Horne (1988) Marsh T. R., Horne K., 1988, MNRAS, 235, 269
- Osaki (2005) Osaki Y., 2005, Proceeding of the Japan Academy, Series B, 81, 291
- Patterson (1981) Patterson J., 1981, ApJ Suppl. Series, 45, 517
- Prialnik & Shara (1986) Prialnik D., Shara M. M., 1986, ApJ, 311, 172
- Provencal et al. (1998) Provencal J. L., Shipman H. L., Hog E., Thejll P., 1998, ApJ, 494, 759
- Ritter (1980) Ritter H., 1980, A&A, 86, 204
- Ritter & Kolb (2003) Ritter H., Kolb U., 2003, A&A, 404, 301
- Rodríguez-Gil & Torres (2005) Rodríguez-Gil P., Torres M. A. P., 2005, A&A, 431, 289
- Rodríguez-Gil et al. (2007a) Rodríguez-Gil P., Schmidtobreick L., Gänsicke B. T., 2007b, MNRAS, 374, 1359
- Rodríguez-Gil et al. (2007b) Rodríguez-Gil P. et al., 2007a, MNRAS, 377, 1747
- Schmidtobreick et al. (2003) Schmidtobreick L., Tappert C., Saviane I., 2003, MNRAS, 342, 145
- Schmidtobreick et al. (2005) Schmidtobreick L., Tappert C., Bianchini A., Mennickent R. E., 2005, A&A, 432, 199
- Schneider & Young (1980) Schneider D. P., Young P., 1980, ApJ, 238, 946
- Schreiber et al. (2000) Schreiber M. R., Gänsicke B. T., Cannizzo J. K., 2000, A&A, 362, 268
- Shafter (1983) Shafter A. W., 1983, ApJ, 267, 222
- Shara et al. (1986) Shara M. M., Livio M., Moffat A. F. J., Orio M., 1986, ApJ, 311, 163
- Shara et al. (2007) Shara M. M. et al., 2007, Nature, 446, 159
- Shara et al. (2012a) Shara M. M., Mizusawa T., Zurek D., Martin C. D., Neill J. D., Seibert M., 2012a, ApJ, 756, 107
- Shara et al. (2012b) Shara M. M., Mizusawa T., Wehinger P., Zurek D., Martin C. D., Neill J. D., Forster K., Seibert M., 2012b, ApJ, 758, 121
- Smak (1984) Smak J., 1984, Acta Astronomica, 34, 93
- Spogli et al. (2000a) Spogli C., Fiorucci M., Raimondo G., 2000a, Information Bulletin on Variable Stars, 4944, 1
- Spogli et al. (2000b) Spogli C., Fiorucci M., Raimondo G., 2000b, Information Bulletin on Variable Stars, 4977, 1
- Spogli et al. (2000c) Spogli C., Fiorucci M., Raimondo G., 2000c, Information Bulletin on Variable Stars, 4978, 1
- Spruit (1998) Spruit H. C., 1998, astro-ph, 9806141
- Steeghs (2001) Steeghs D., 2001, in Lecture Notes in Physics, Berlin Springer Verlag, Vol. 573, Astrotomography, Indirect Imaging Methods in Observational Astronomy, Boffin H. M. J., Steeghs D., Cuypers J., eds., p. 45
- Stetson (1992) Stetson P. B., 1992, in Astronomical Society of the Pacific Conference Series, Vol. 25, Astronomical Data Analysis Software and Systems I, Worrall D. M., Biemesderfer C., Barnes J., eds., p. 297
- Tappert et al. (2003) Tappert C., Mennickent R. E., Arenas J., Matsumoto K., Hanuschik R. W., 2003, A&A, 408, 651
- Tappert et al. (2012) Tappert C., Ederoclite A., Mennickent R. E., Schmidtobreick L., Vogt N., 2012, MNRAS, 423, 2476
- Tebbutt (1878) Tebbutt J., 1878, MNRAS, 38, 330
- Thorstensen & Taylor (2000) Thorstensen J. R., Taylor C. J., 2000, MNRAS, 312, 629
- Townsley & Gänsicke (2009) Townsley D. M., Gänsicke B. T., 2009, ApJ, 693, 1007
- Vogt et al. (1981) Vogt N., Schoembs R., Krzeminski W., Pedersen H., 1981, A&A, 94, L29
- Warner (1974) Warner B., 1974, MNRAS, 168, 235
- Warner (1983) Warner B., 1983, in Astrophysics and Space Science Library, Vol. 101, Dordrecht, Reidel, IAU Colloq. 72: Cataclysmic Variables and Related Objects, Livio M., Shaviv G., eds., pp. 155–171
- Warner (1995) Warner B., 1995, Cataclysmic variable stars. Cambridge Astrophysics Series, Cambridge, New York: Cambridge University Press
- Yaron et al. (2005) Yaron O., Prialnik D., Shara M. M., Kovetz A., 2005, ApJ, 623, 398
- Zorotovic et al. (2011) Zorotovic M., Schreiber M. R., Gänsicke B. T., 2011, A&A, 536, A42