Vacuum magnetic linear birefringence using pulsed fields
Résumé
We present the current status of the BMV experiment. Our apparatus is based on an up-to-date resonant optical cavity coupled to a transverse magnetic field. We detail our data acquisition and analysis procedure which takes into account the symmetry properties of the raw data with respect to the orientation of the magnetic field and the sign of the cavity birefringence. The measurement result of the vacuum magnetic linear birefringence presented in this paper was obtained with about 200 magnetic pulses and a maximum field of 6.5 T, giving a noise floor of about T-2 at confidence level.
pacs:
12.20.FvExperimental tests and 78.20.LsMagneto-optical effects and 42.25.LcBirefringence1 Introduction
It is known since the beginning of the 20th century that any medium shows a linear birefringence in the presence of a transverse external magnetic field B. This effect is usually known as the Cotton-Mouton (CM) effect (see Ref. Rizzo1997 and references therein). The existence of such a magnetic linear birefringence has also been predicted in vacuum around 1970 in the framework of Quantum ElectroDynamics (QED) Bialynicka1970 ; Ritus1975 . It is one of the non-linear optical effects described by the Heisenberg-Euler effective lagrangian (see Ref. Battesti2013 and references therein) and it can be seen as the result of the interaction of the external magnetic field with quantum vacuum fluctuations. In a vacuum therefore the index of refraction for light polarized parallel to B is expected to be different from the index of refraction for light polarized perpendicular to B such that Battesti2013 :
| (1) | |||||
| (2) |
At the first order in the fine structure constant , can be written as:
| (3) |
with the Planck constant over , the electron mass, the speed of light in vacuum, and the magnetic constant. Using the CODATA recommended values for fundamental constants CODATA , one obtains:
| (4) |
In spite of several experimental attempts, the experimental proof of such a very fundamental QED prediction is still lacking Battesti2013 . All recent experiments, both completed or running, measure via the ellipticity induced on a linearly polarized light propagating in the birefringent vacuum:
| (5) |
where is the light wavelength, is the path length in the magnetic field, and is the angle between the light polarization and the birefringence axis. This equation clearly shows that the critical experimental parameter is the product . In order to increase the ellipticity to be measured, one usually uses an optical cavity to store light in the magnetic field region as long as possible. The total acquired ellipticity is linked to the ellipticity acquired in the absence of cavity and depends on the cavity finesse as:
| (6) |
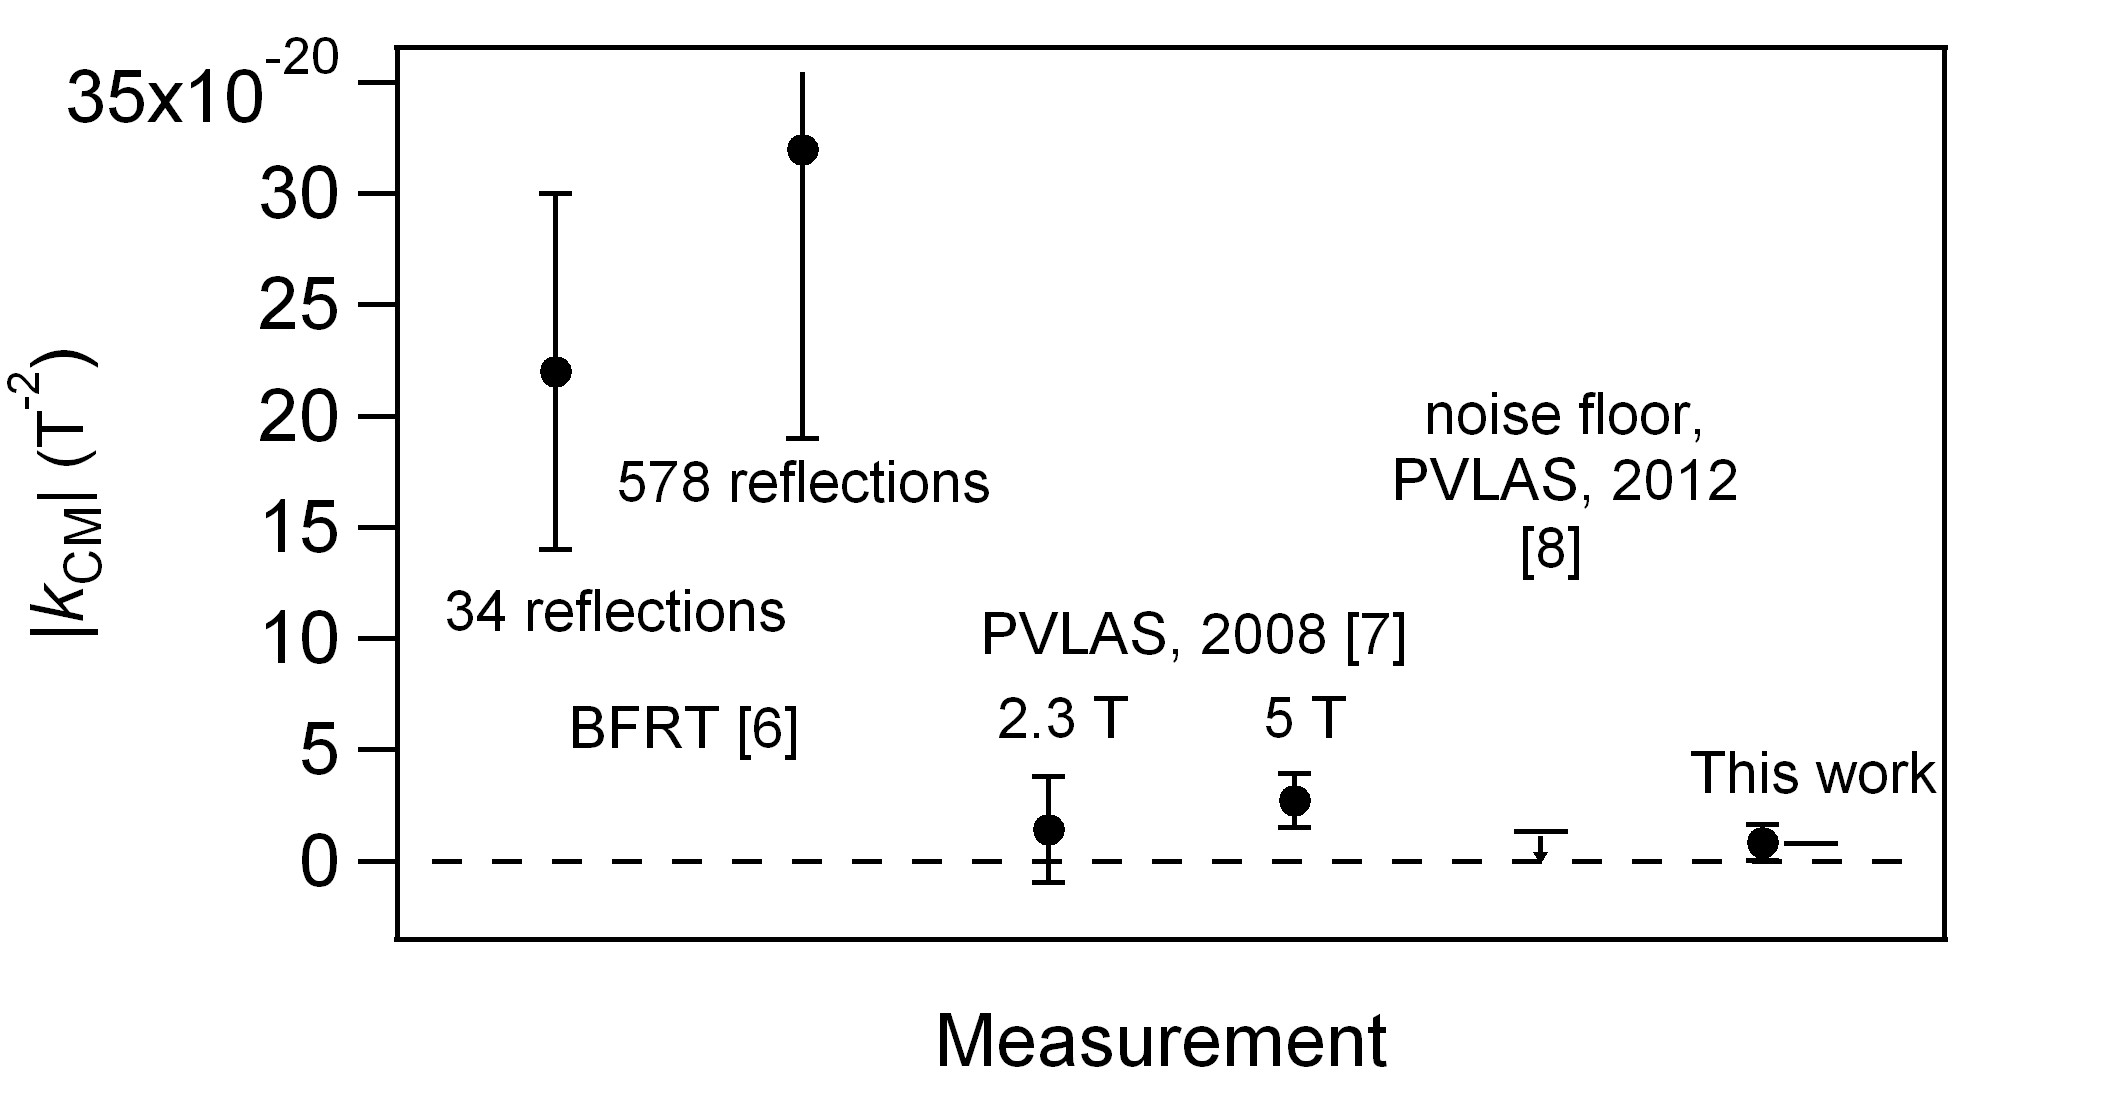
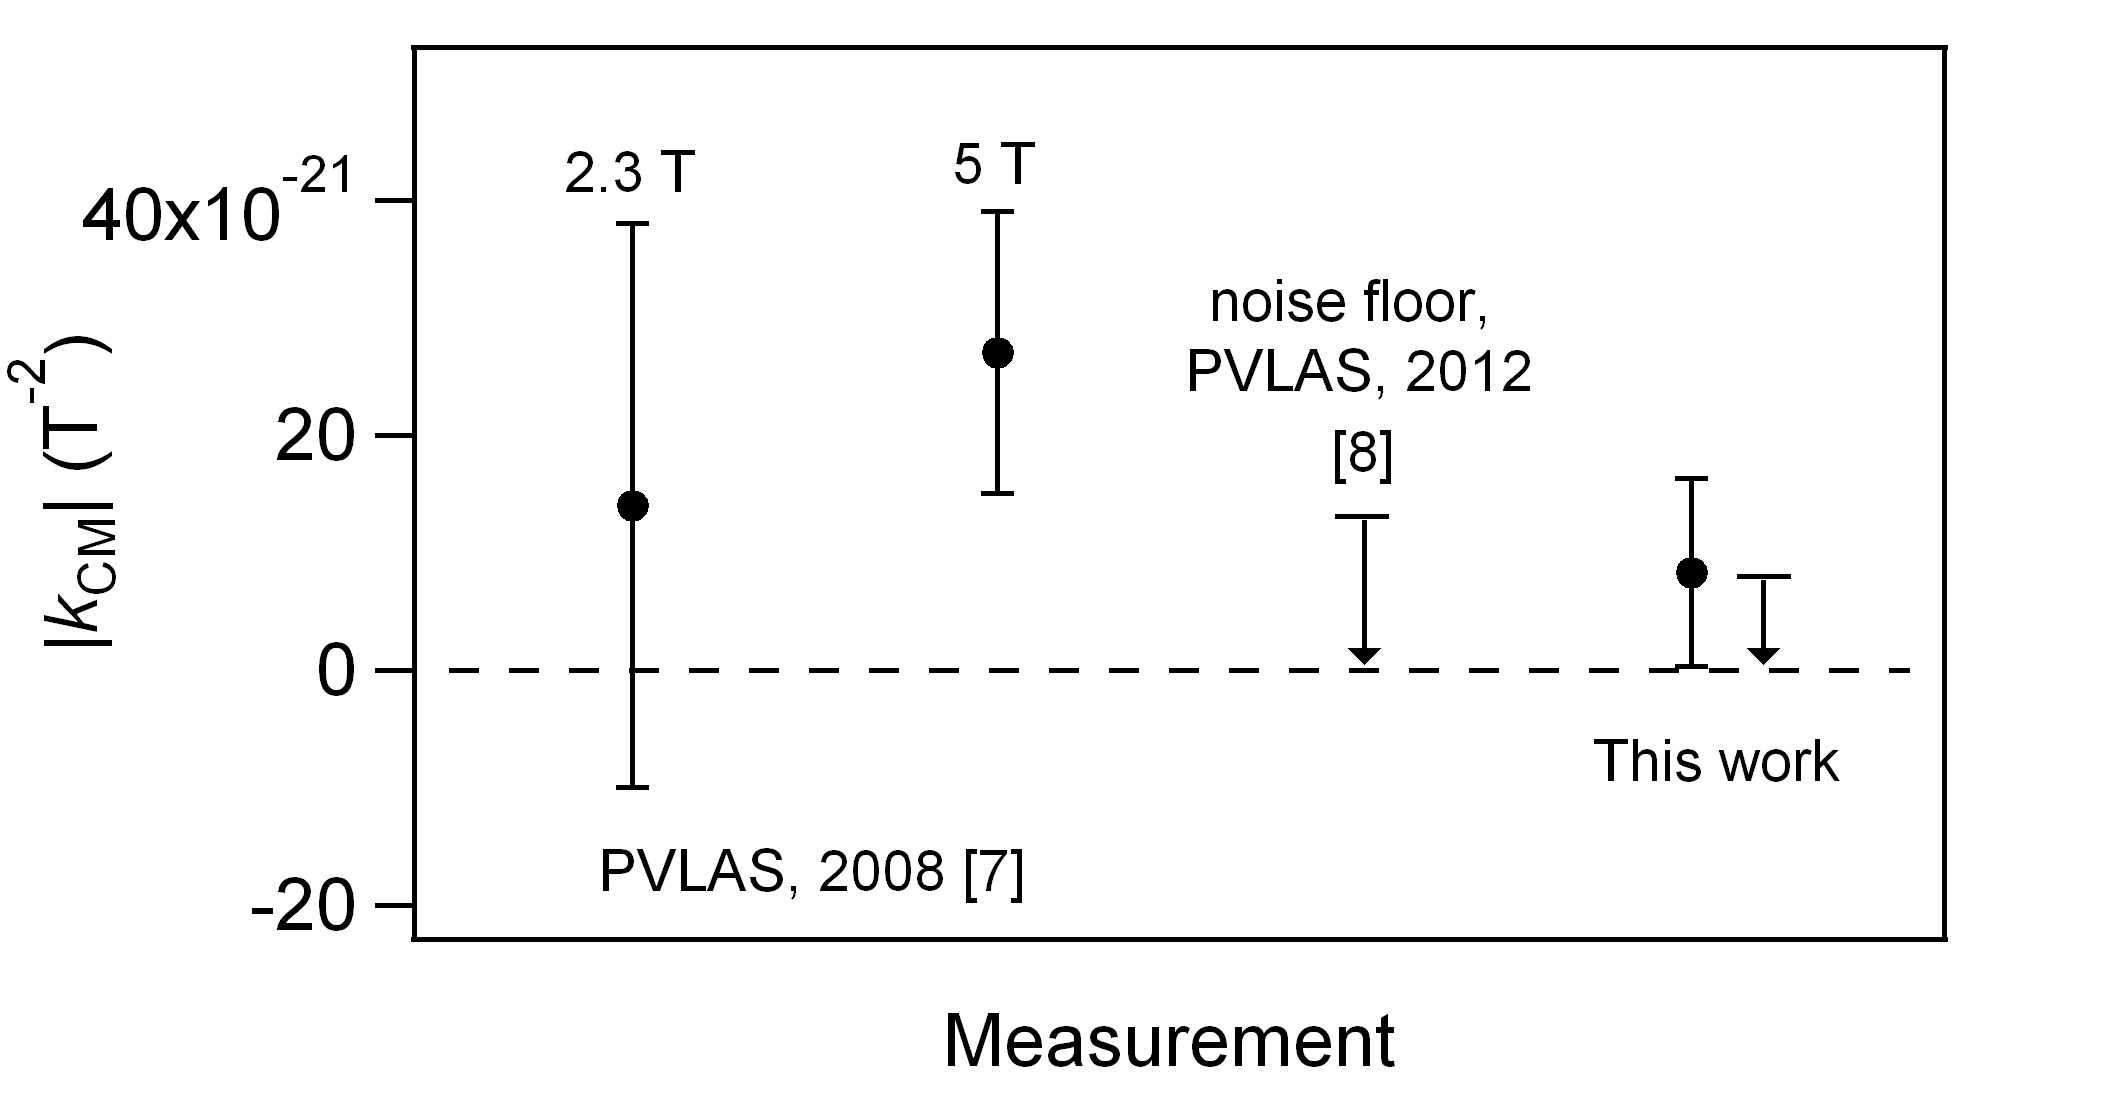
After the theoretical calculations in the 70s, a first measurement of the value was published by the BFRT collaboration Cameron1993 . It was based on a superconducting magnet providing a maximum field of 3.9 T, and a multipass optical cavity. Spurious signals were always present (see Table V(b) in Cameron1993 ). Final results gave T-2 at confidence level for 34 refections inside the cavity, and T-2 for 578 reflections. In 2008 a new measurement was published by the PVLAS collaboration using a Fabry-Pérot optical cavity and a superconducting magnet providing a 2.3 T field: T-2 at 3 Zavattini2008 . The same experiment at 5 T gave T-2 at 3. More recently a new version of the PVLAS apparatus based on two 2.5 T permanent magnets and a Fabry-Pérot optical cavity reached a noise floor corresponding to T-2 at 3, but ”only when no spurious signal was observed” Zavattini2012 . All over our paper, we give error bars at corresponding to a confidence level of 99.8%, that usually indicates an evidence for a non-zero signal. All these measurements are summarized in Fig. 1. This clearly shows that vacuum CM measurements are true experimental challenges and that one has to focus not only on getting the best optical sensitivity and maximizing the signal to be measured, but also on minimizing all the unwanted systematic effects by decoupling the apparatus from their sources and by performing an appropriate data analysis.
In this paper we present a measurement of obtained using the first generation setup of the BMV (Biréfringence Magnétique du Vide) experiment at the National High Magnetic Field Laboratory of Toulouse, France (LNCMI-T) EPJD_BMV . The novelty of this experiment is the use of pulsed magnetic fields. This method allows to provide the highest magnetic fields in terrestrial laboratories without destroying the coil itself Battesti2013 . Our apparatus is also based on the use of an infrared Fabry-Pérot cavity among the sharpest in the world Berceau2012 . We calibrated our experiment using nitrogen gas Berceau2012 , and recently published a high precision measurement of the Cotton-Mouton effect of helium gas compatible with the theoretical prediction Cadene2013 . We present our data acquisition and analysis procedure that takes into account the symmetry properties of the raw data with respect to the orientation of the magnetic field and the sign of the cavity birefringence. The measurement result of the vacuum magnetic linear birefringence presented in this paper was obtained with about 200 magnetic pulses and a maximum field of 6.5 T. It corresponds to the best noise floor ever reached. It is therefore a clear validation of our innovative experimental method.
2 Experimental setup
2.1 Apparatus
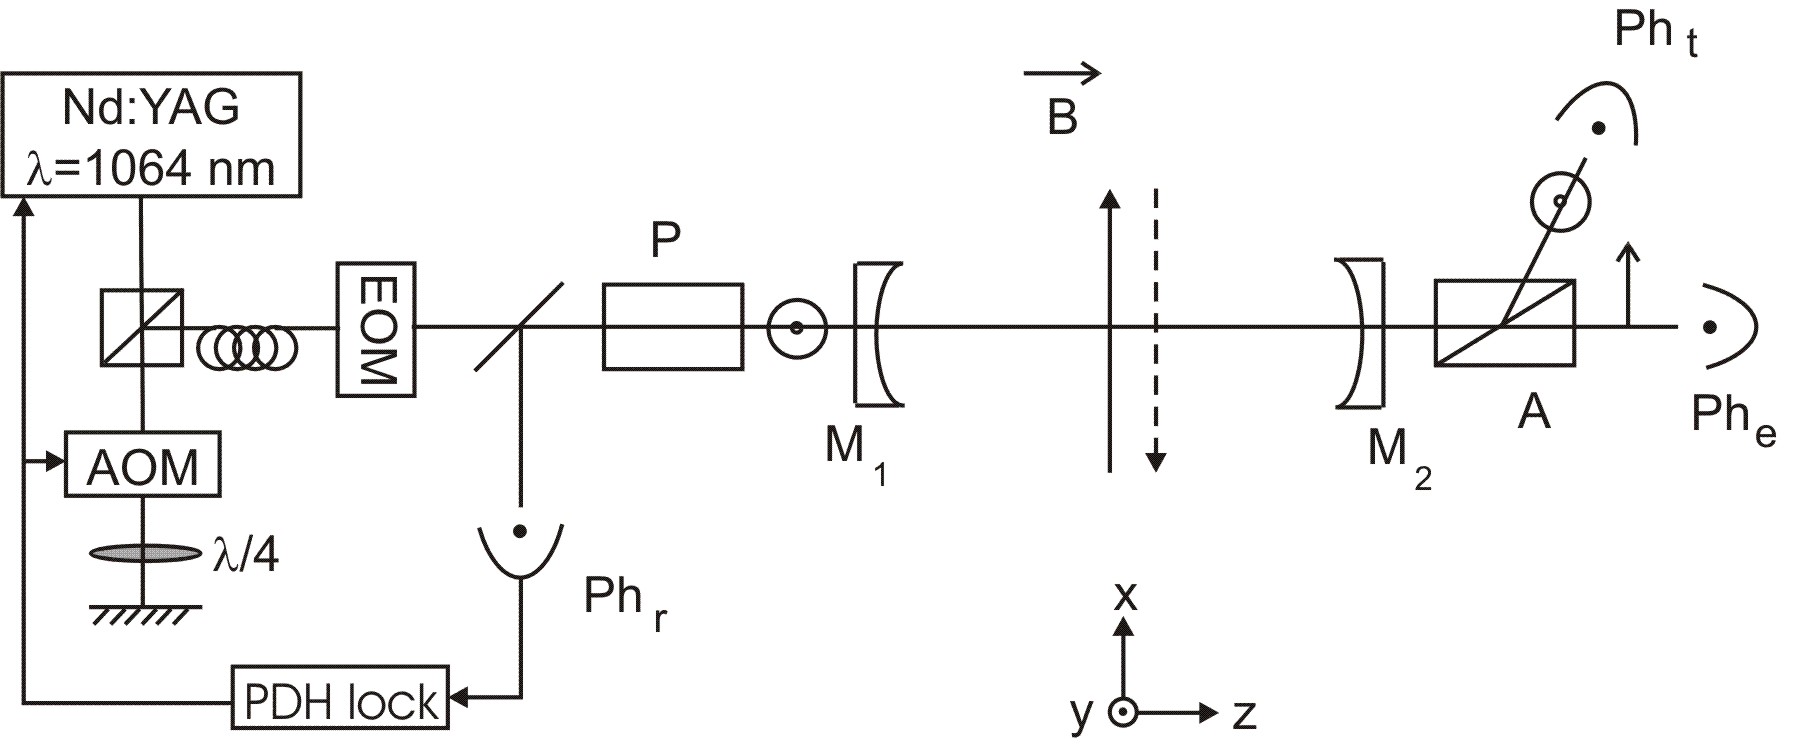
Our experimental setup is described in Refs. Cadene2013 . As shown in Fig. 2, 30 mW of a linearly polarized Nd:YAG laser beam ( = 1064 nm) goes through an acousto-optic modulator (AOM) used in double pass for an adjustment of the laser frequency. It is then injected into a monomode optical fiber before entering a high finesse Fabry-Pérot cavity of length m, consisting of the mirrors M1 and M2. This corresponds to a cavity free spectral range of MHz. The laser passes through an electro-optic modulator (EOM) creating sidebands at 10 MHz. We analyze the beam reflected by the cavity on the photodiode Phr. This signal is used to lock the laser frequency to the cavity resonance frequency using the Pound-Drever-Hall method PDH , via the acousto-optic modulator and the piezoelectric and Peltier elements of the laser.
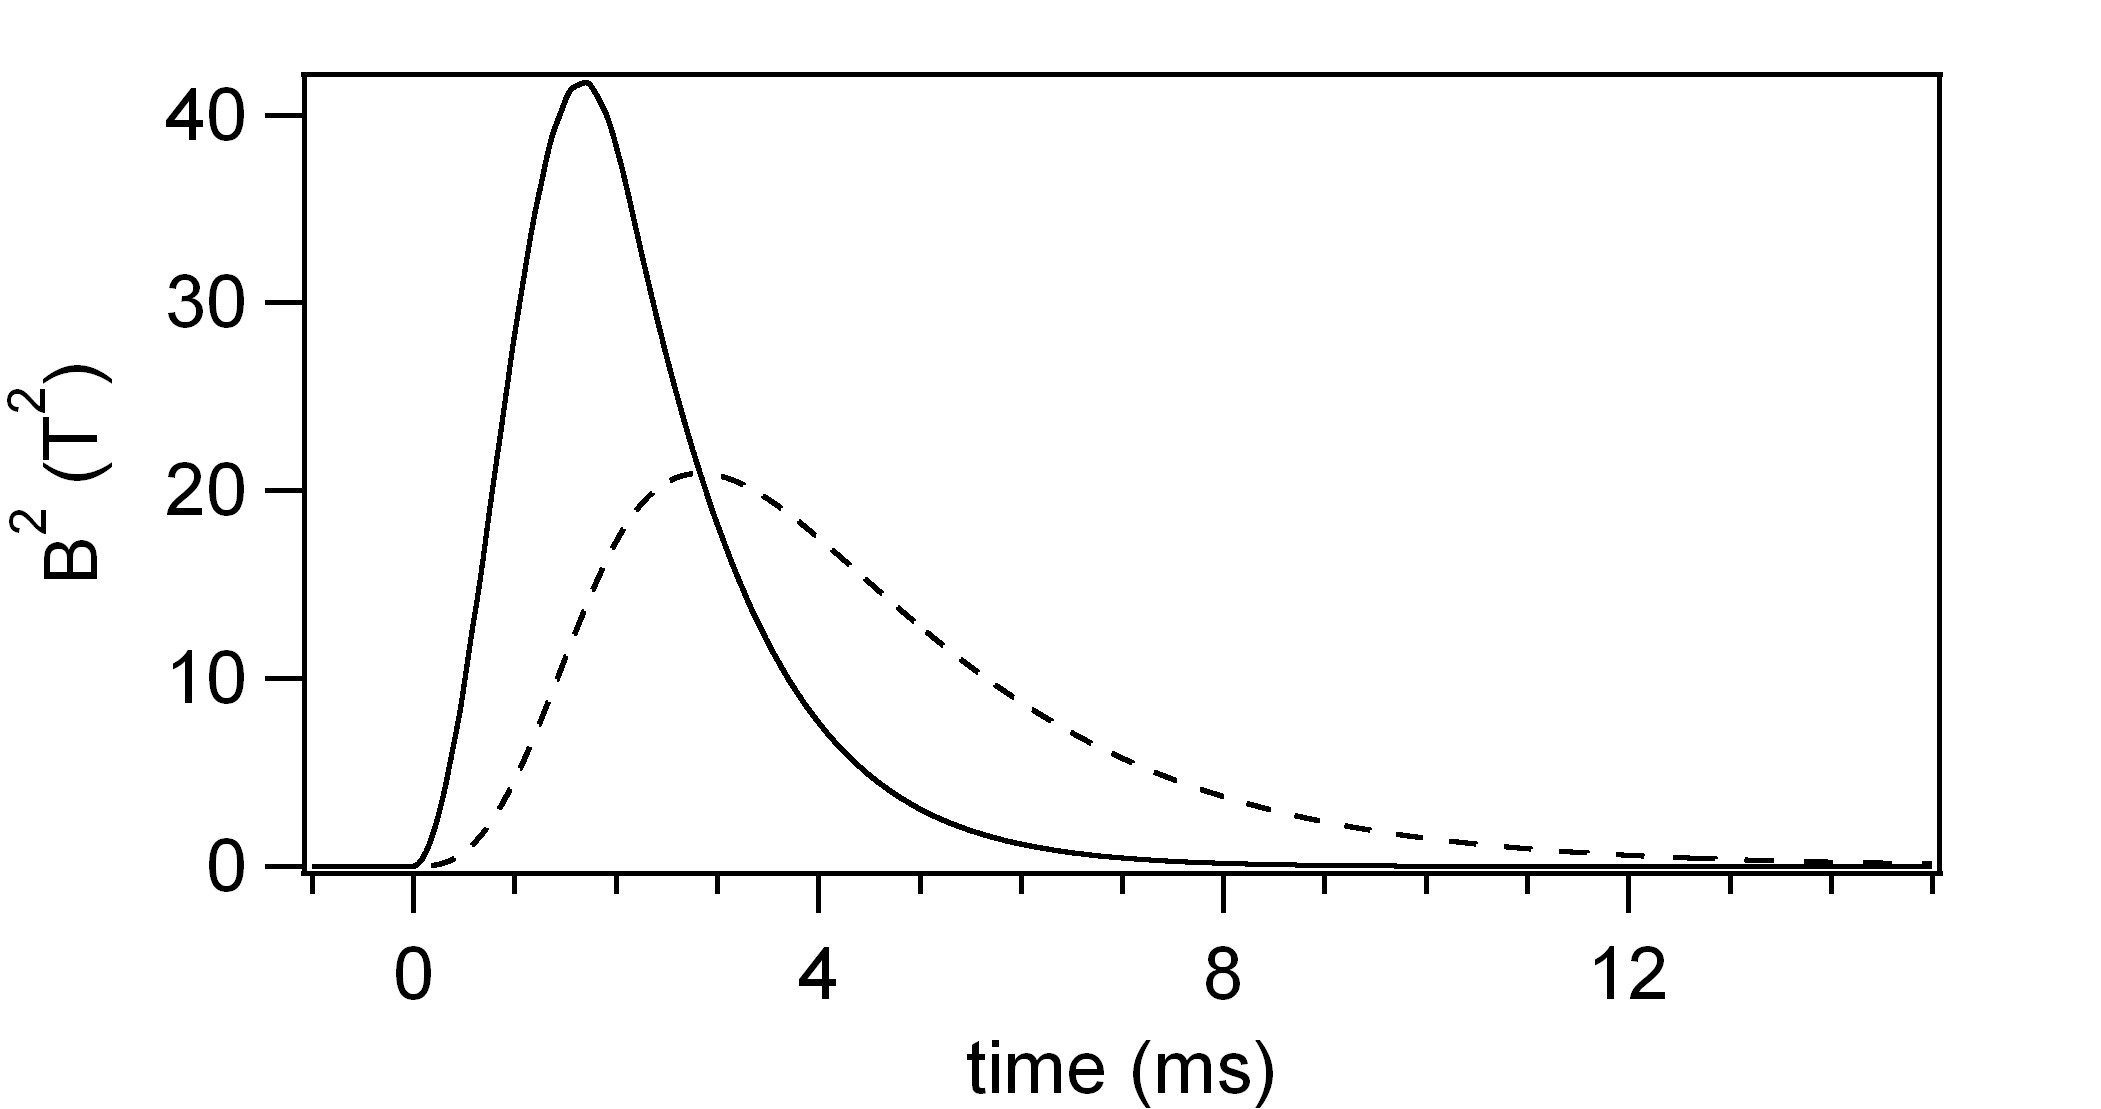
To measure the ellipticity induced by the Cotton-Mouton effect one needs a transverse magnetic field as high as possible. This is fulfilled using pulsed fields delivered by one magnet, named X-coil, especially designed in our laboratory. The principle of this magnet and its properties are described in details in Refs. EPJD_BMV ; Batut2008 . It can provide a maximum field of more than 14 T over an equivalent length of 0.137 m Berceau2012 . Data have been taken with a maximum magnetic field of 6.5 T reached within 1.70 ms while the total duration of a pulse is less than 10 ms as shown in Fig. 3. Moreover, we can remotely switch the high-voltage connections to reverse B in order to set it parallel or antiparallel to the x direction. The maximum repetition rate is 6 pulses per hour.
We infer the cavity finesse from the measurement of the photon lifetime Berceau2012 . Its value is regularly checked during data taking and we get ms. The corresponding finesse is:
| (7) |
We get with a relative variation that does not exceed 6 at the 3 confidence level. This corresponds to a cavity linewidth of 148 Hz. This is one of the sharpest infrared cavity in the world Berceau2012 .
Before entering the Fabry-Pérot cavity, light is polarized by the polarizer P. The beam transmitted by the cavity is then analyzed by the analyzer A crossed at maximum extinction. We extract both polarizations: parallel and perpendicular to P. The extraordinary ray, whose polarization is perpendicular to the incident polarization, is detected by the photodiode Phe (power ), while the ordinary ray, whose polarization is parallel to the incident polarization, is detected by Pht (power ).
All the optical devices from the polarizer to the analyzer are placed in an ultrahigh-vacuum chamber. During operation, the pressure inside the UHV vessel was about mbar. We have monitored the vacuum quality with a residual gas analyzer. Residual gases can cause a measurable CM effect. Most important contributions come from N2 and O2 leading to a of T-2. Moreover dielectric mirrors also induce a CM effect corresponding to an ellipticity of rad.T-2 per reflection, as reported in Ref. CM_Miroir . The stray transverse magnetic field at the mirror position is smaller than 150 T, giving in our case T-2. We expect these CM effects to be smaller than the measured noise floor.
2.2 Signals
The ellipticity induced by the transverse magnetic field is related to the ratio of the extraordinary and ordinary powers as follows:
| (8) | |||||
with the polarizer extinction ratio and the total static ellipticity. This static ellipticity is due to the mirrors’ intrinsic phase retardation BirMirror . Each mirror can be regarded as a wave plate. The combination of both wave plates gives a single wave plate with a total phase retardation and an axis orientation that depend on each mirror phase retardation and on their relative orientation Jacob ; brandi . Thus, we adjust the value of by rotating the mirrors M1 and M2 around the axis corresponding to the axis of light propagation.
To measure the polarizer extinction ratio, we first set , with no magnetic field. We get . Then, to reach the best sensitivity, we need EPJD_BMV . Starting from and rotating M1 in the clockwise or counterclockwise direction, we choose the value of as well as its sign determined by CM measurements in nitrogen and helium gas. The measurement of and the adjustment of the value and sign of are done before each magnetic pulse.
Due to the photon lifetime, the cavity acts as a first order low pass filter, as explained in details in Ref. Berceau2010 . Its complex response function is given by:
| (9) |
with the frequency and Hz the cavity cutoff frequency. This filtering has to be taken into account in particular for the time dependent magnetic field applied inside the Fabry-Pérot cavity. The ellipticity induced by the external magnetic field is thus proportional to :
| (10) |
where the filtered field is calculated from taking into account the cavity filtering. The time profile of is plotted in Fig. 3 with the dashed curve. In particular, the cavity filtering induces an attenuation and a shift of the maximum. The cavity filtering has also to be applied to as explained in details in Refs. Berceau2010 ; Cadene2013 .
The calculated signals used for the analysis are described in details in Ref. Cadene2013 . In order to extract the ellipticity from Eq. (8), we calculate the following signal after each pulse:
| (11) | |||||
| (12) |
where corresponds to the sign of . We calculate the static signal before the pulse as follows:
| (13) |
where corresponds to the beginning of the analysis and to the beginning of the applied magnetic field. The absolute value of the cavity ellipticity is measured a few milliseconds before each magnetic pulse thanks to the following equation:
| (14) |
Signals are collected for both signs of and for both directions of B: parallel to is denoted as and antiparallel is denoted as . This gives four data series: (, ), (, ), (, ) and (, ). For each series, signals calculated with Eq. (11) are averaged and denoted as , , and . The first subscript corresponds to or and the second one corresponds to B parallel or antiparallel to .
3 Data analysis and results
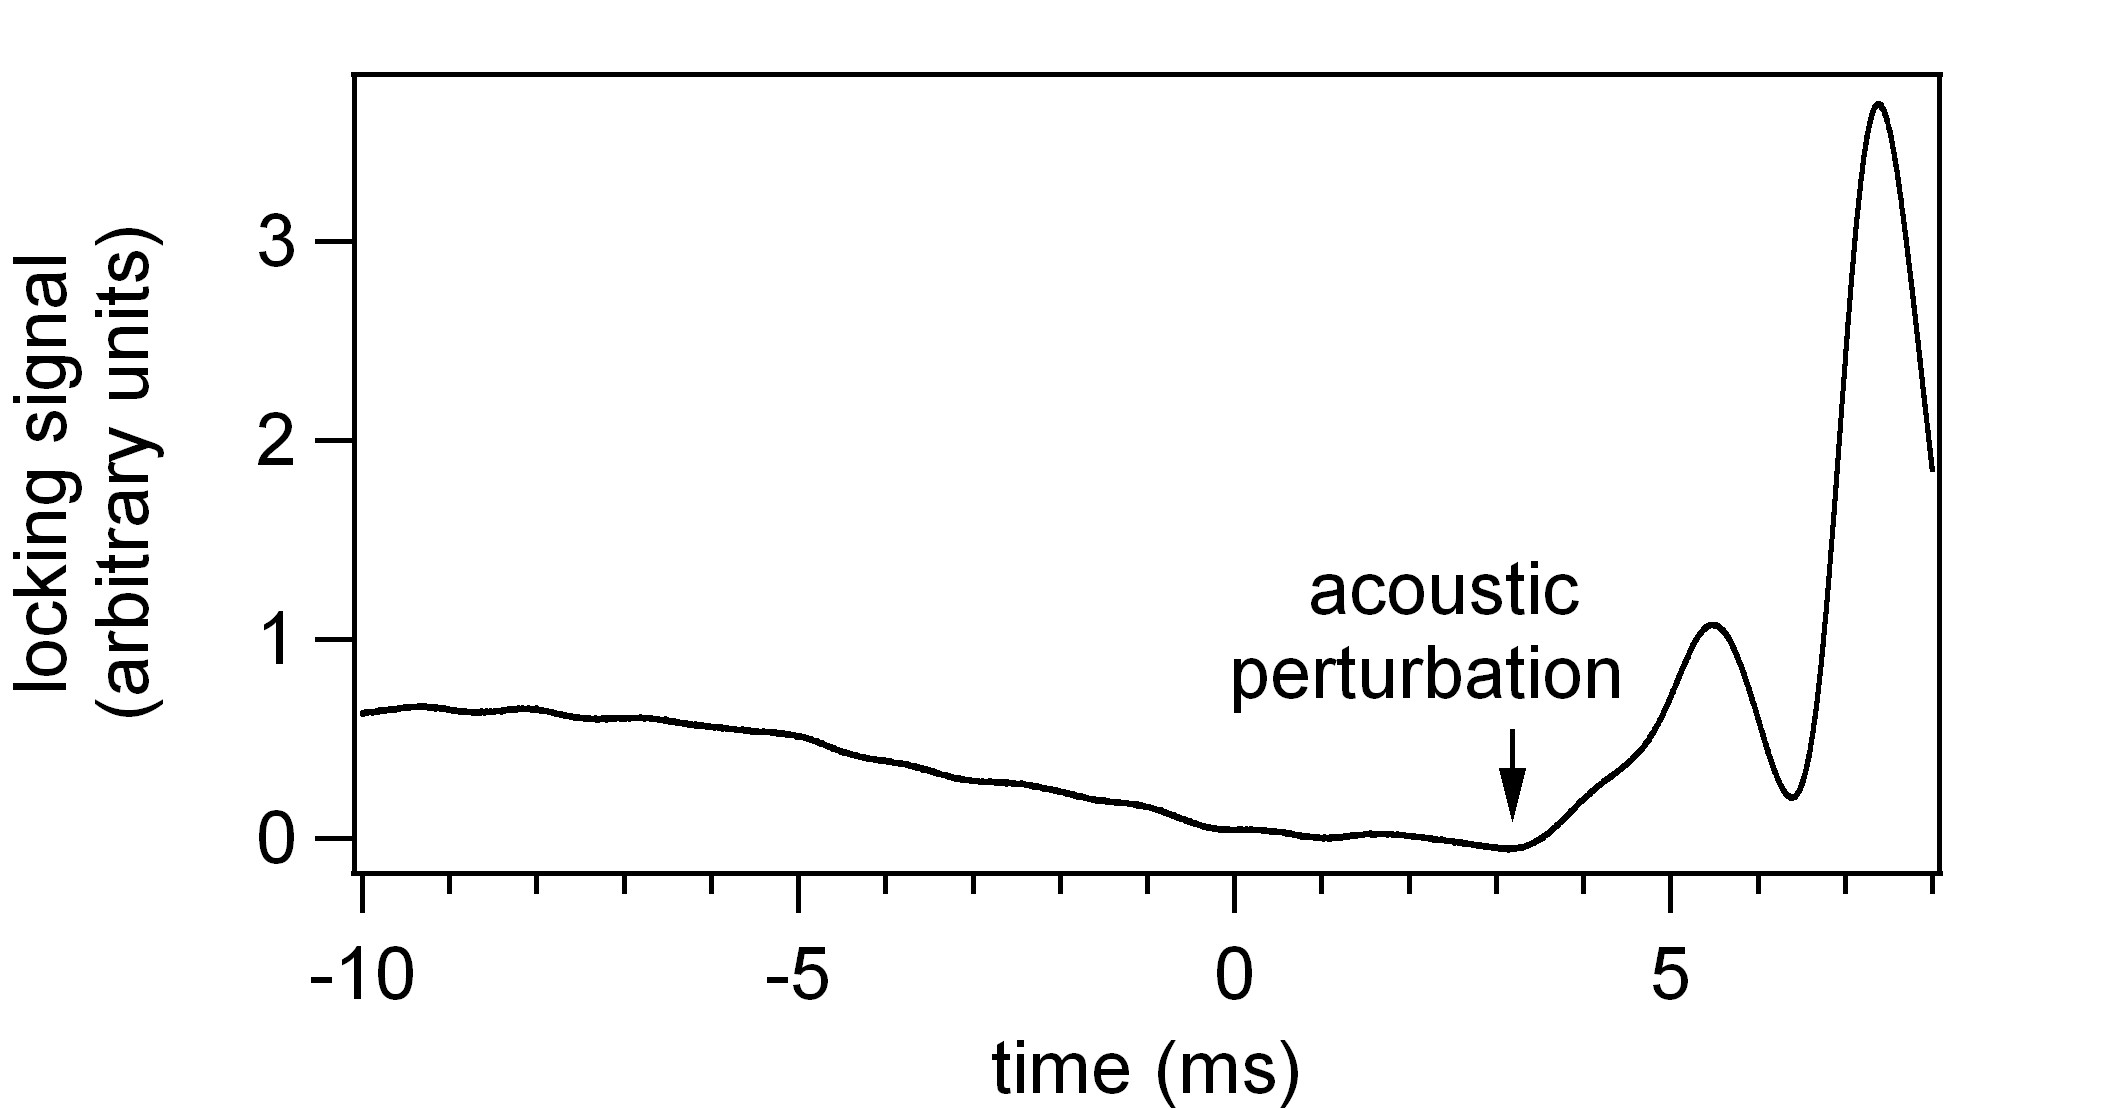
The raw signals, such as , , or the cavity locking signal, are recorded 25 ms before the beginning of the magnetic field and 25 ms after. A typical cavity locking signal is plotted in Fig. 4. We clearly see a perturbation which begins at about 3.2 ms. This corresponds to the acoustic perturbation triggered at by the magnetic pulse. This perturbation travels trough the air to the mirror mounts. We have confirmed the arrival time on the mirror mounts with accelerometers. This perturbation induces an ellipticity noise which degrades our sensitivity. We have thus decided to stop the analysis at ms. Symmetrically, we start the analysis at ms. It also allows to avoid drifts and long time variations of .
For each pulse applied in vacuum, we first calculate the value following Eq. (14). To check that this corresponds to a meaningful value, we plot the histogram of the following signal for :
| (15) |
This corresponds to 3100 values acquired every 1 s. With white noise and because no induced ellipticity is present at , the histogram is centered on 0 and corresponds to a gaussian distribution, as shown in Fig. 5a.
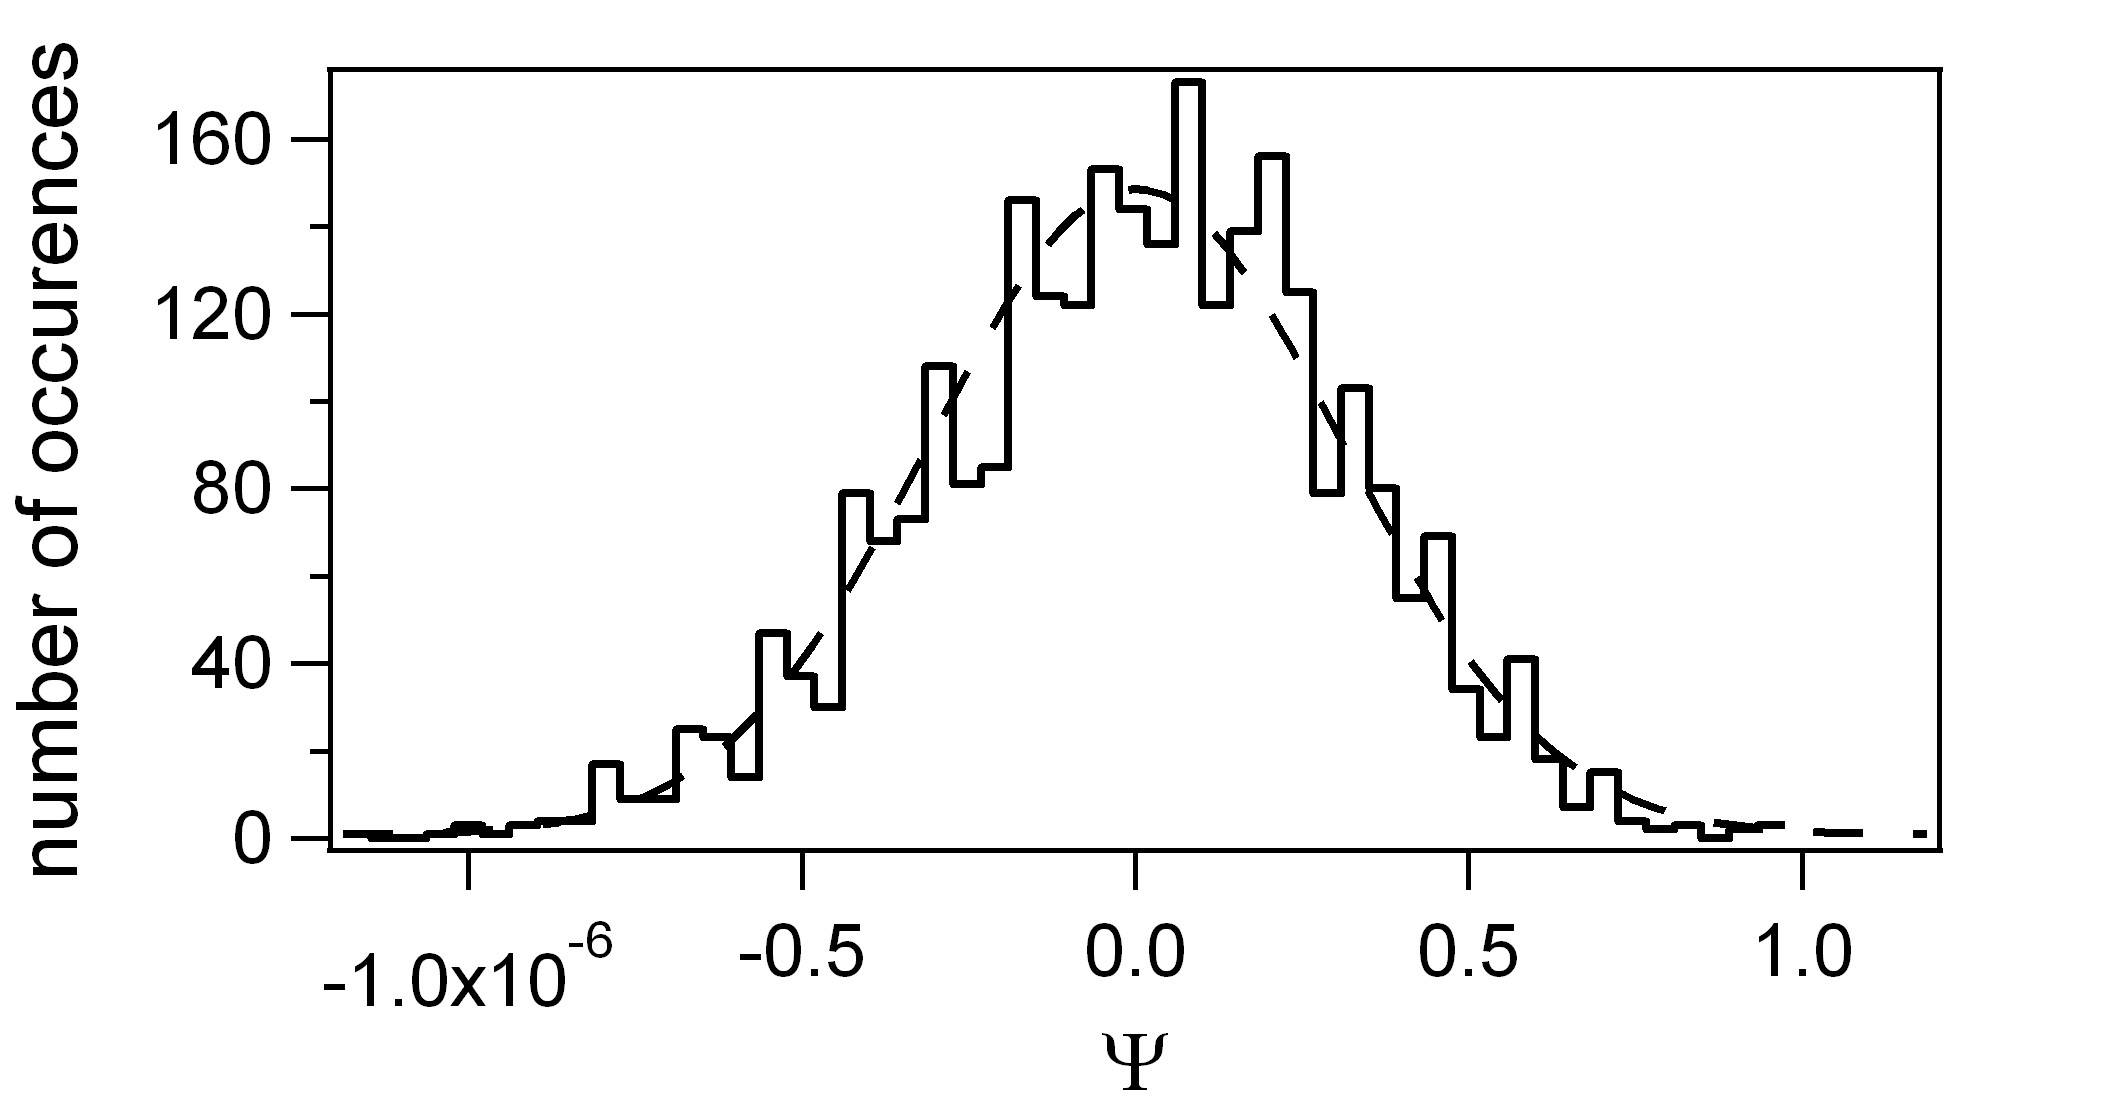
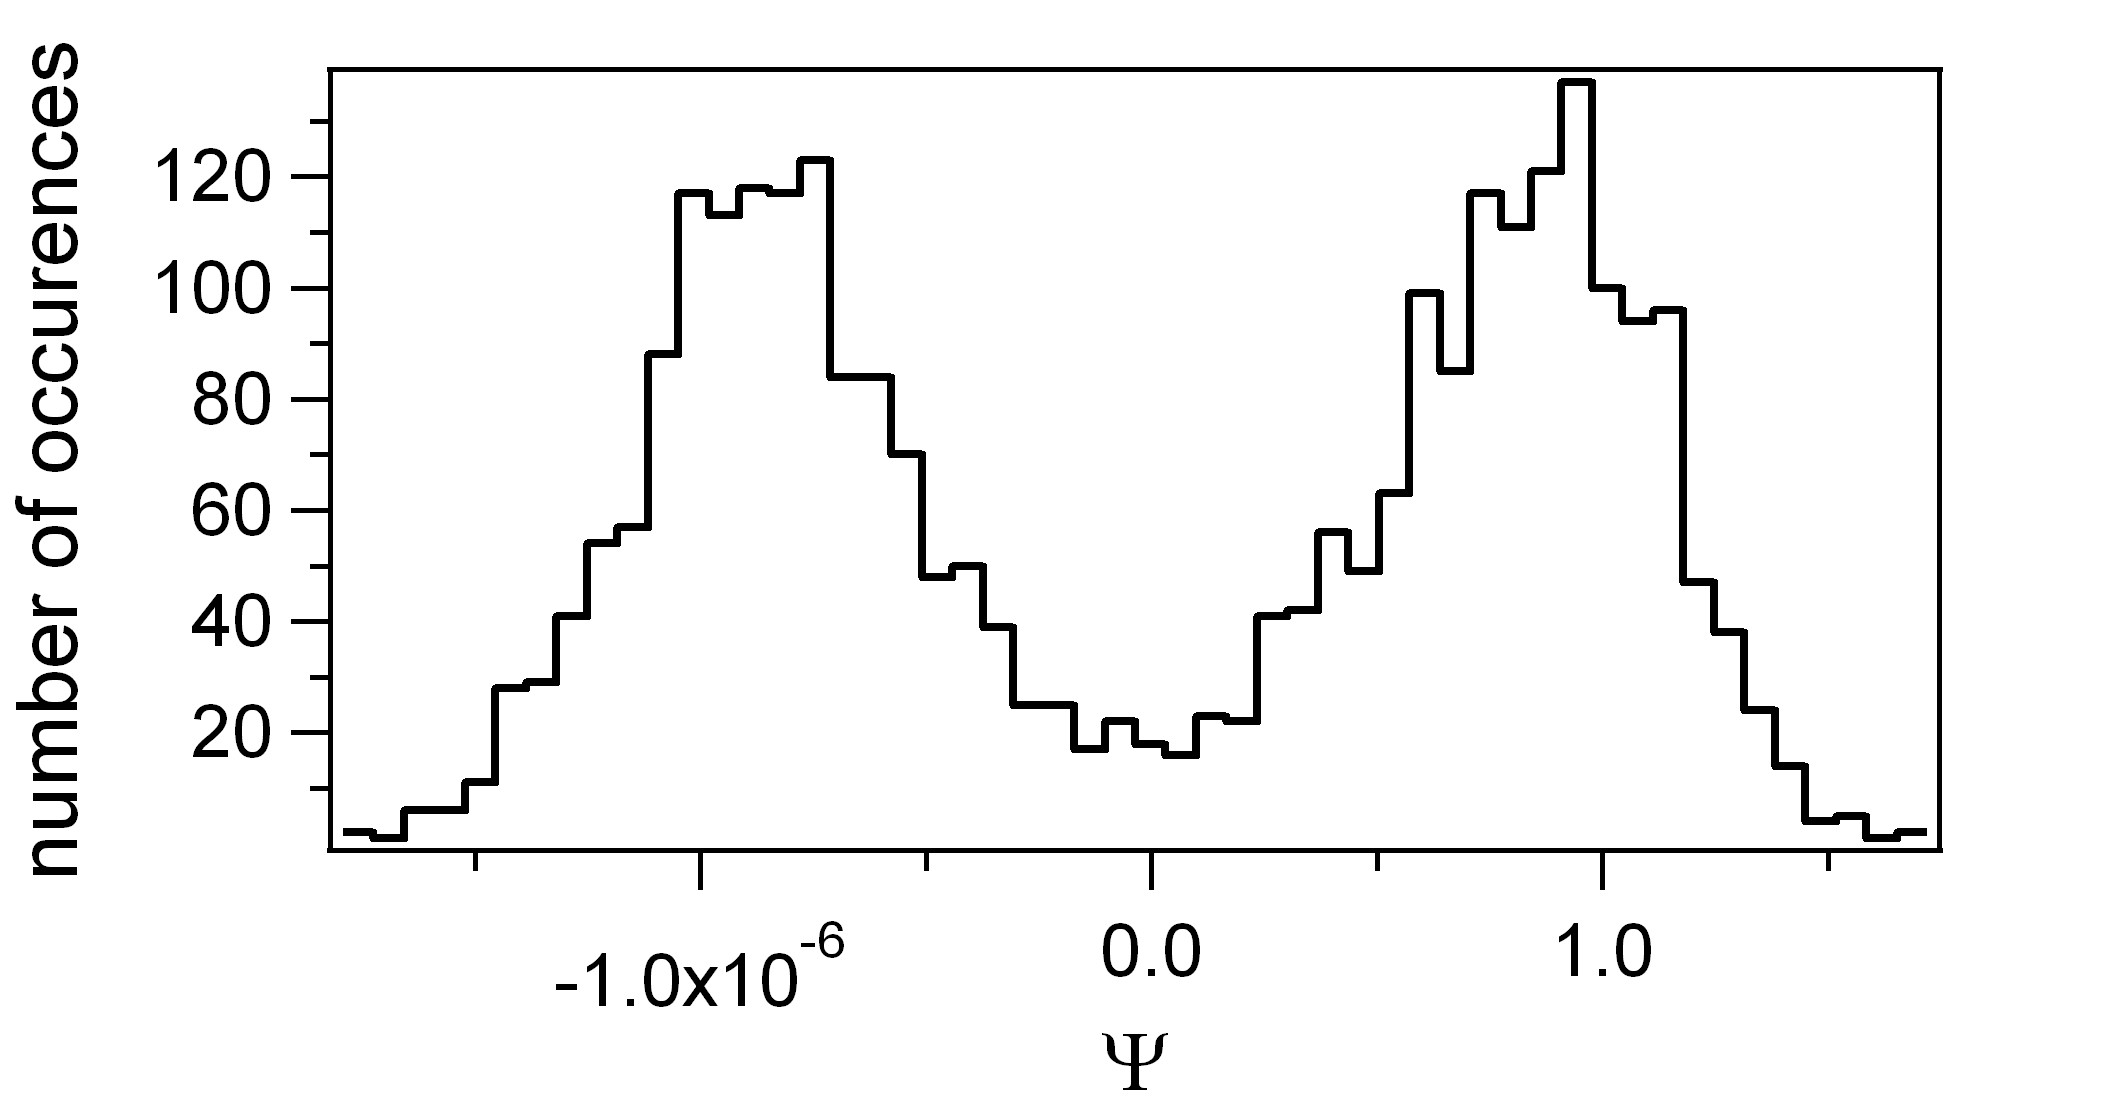
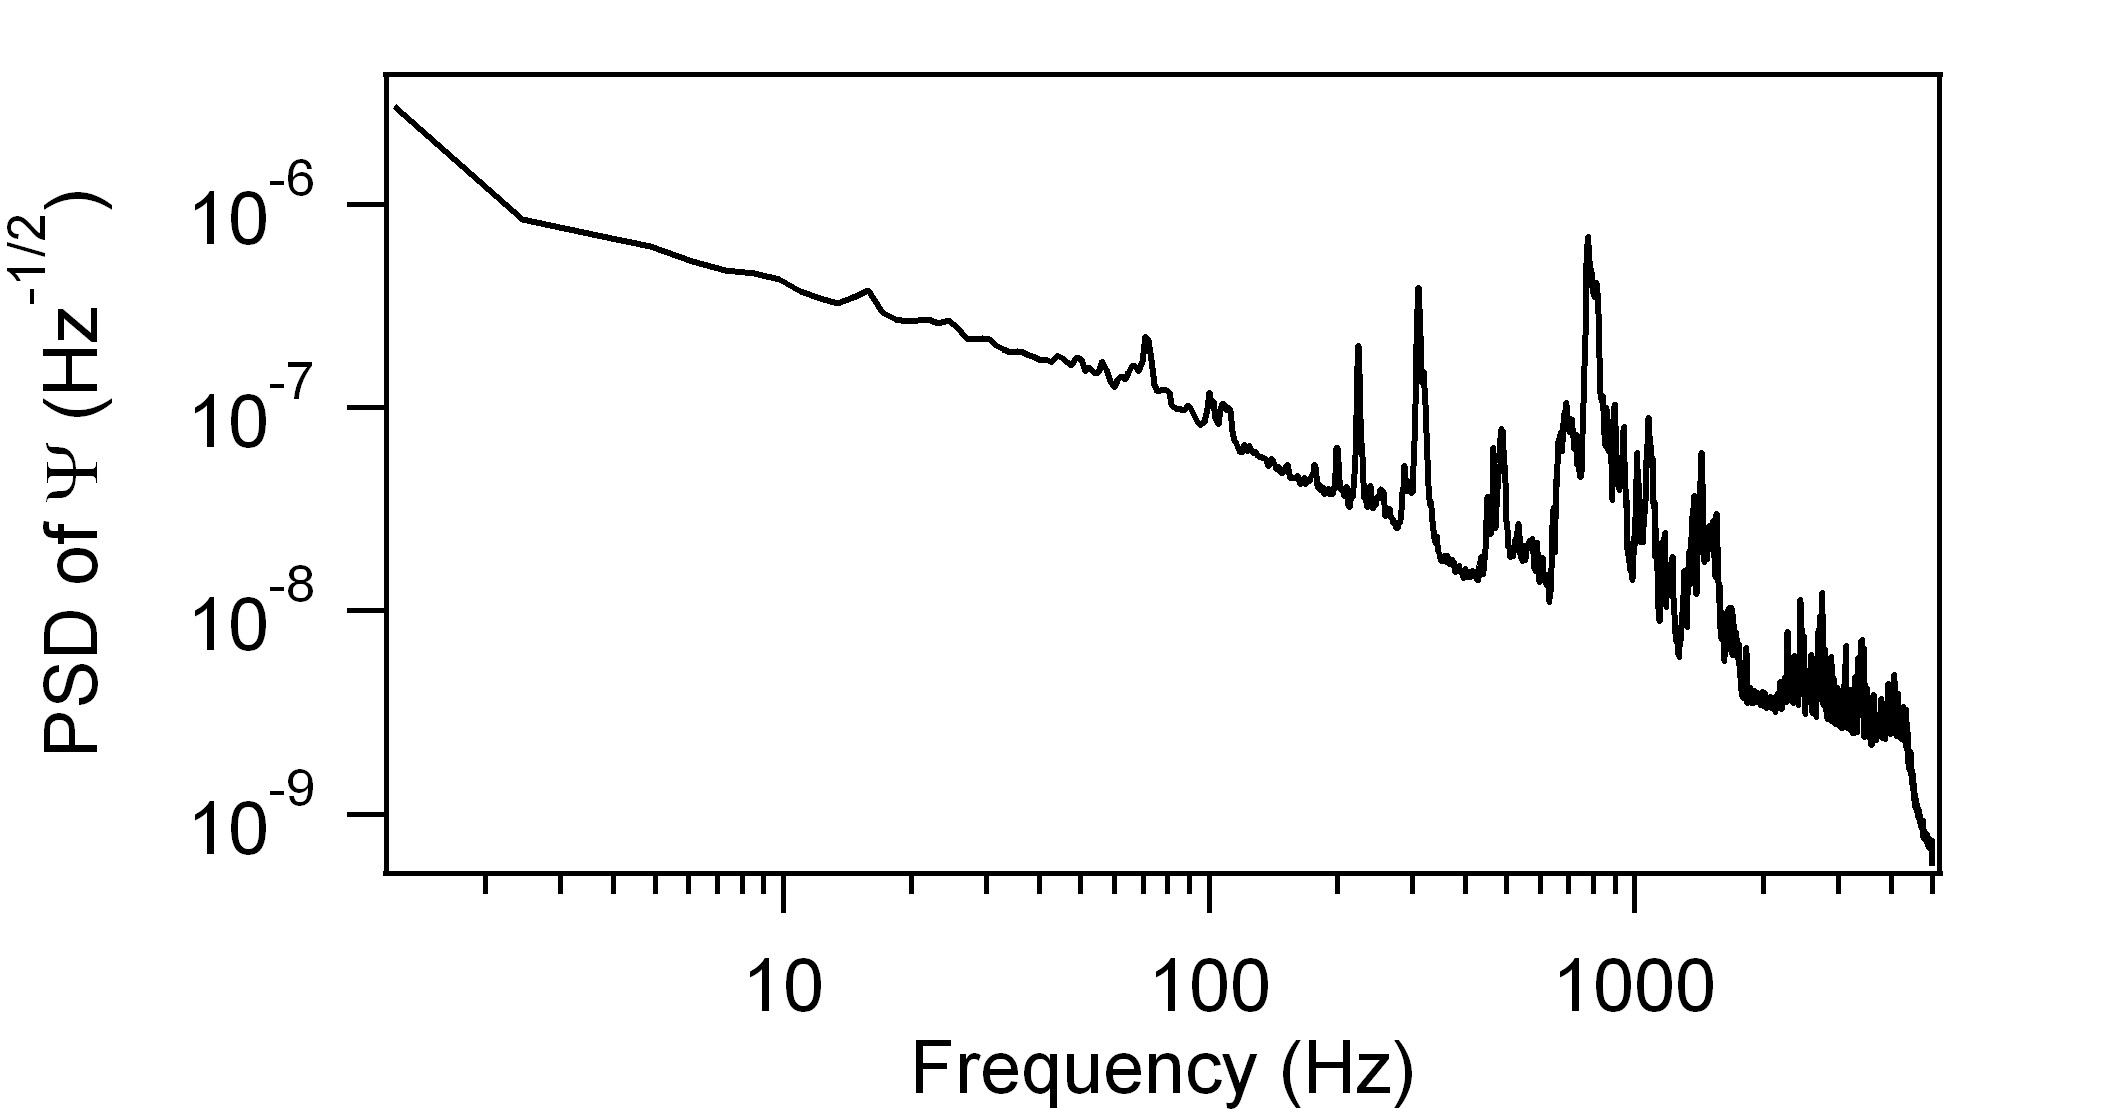
However, some of the histograms cannot be fitted by a gaussian function, as shown in Fig. 5b. The main origin of this type of distributions is mechanical oscillations of the setup induced by the environment and leading to static ellipticity fluctuations, event if the magnetic filed is not applied. These mechanical oscillations can be directly observed on the power spectral density (PSD) of the ellipticity in the absence of the magnetic field, as shown in Fig. 6. In the case corresponding to Fig. 5b, we cannot give a statistical and significant value of . The corresponding shots are thus rejected. Finally we selected 101 pulses. It should be noted that this selection is performed for , thus before the magnetic pulse. We do not select or reject pulses with an analysis on the signal we want to measure, thus induced by the magnetic field at .
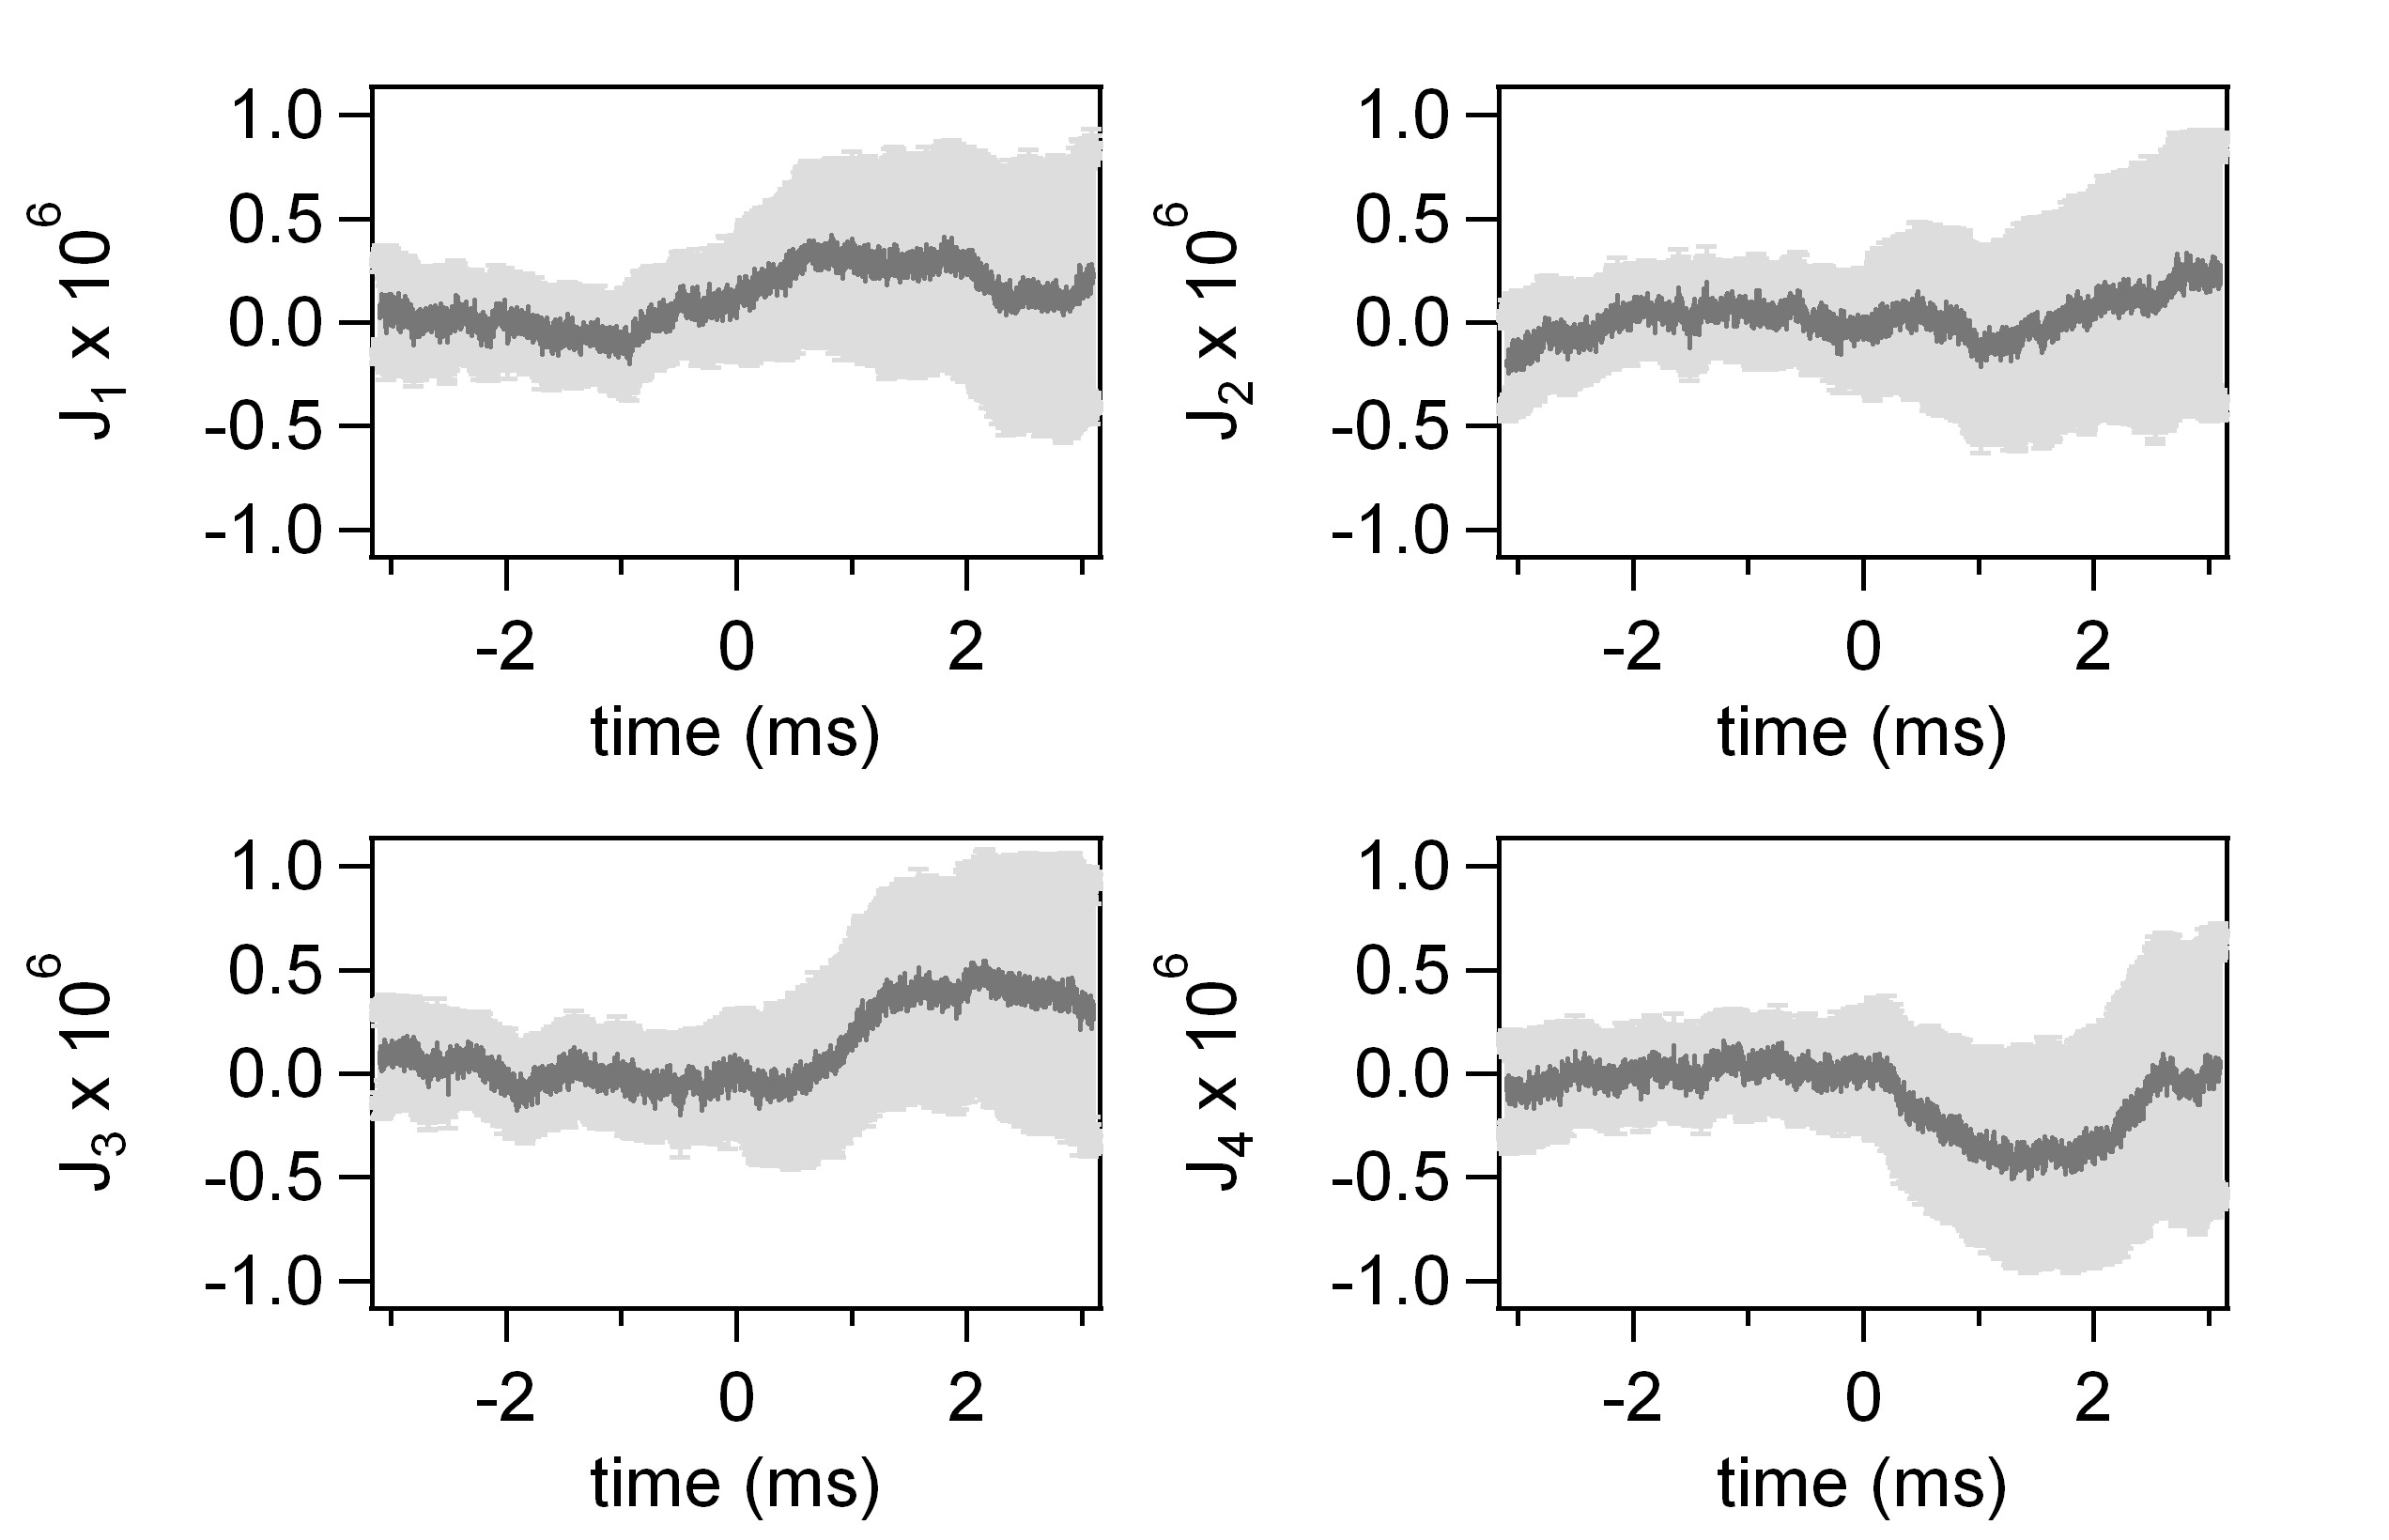
From the 101 selected pulses, we calculate the signals , , , and , denoted by with . As explained in section 2.2, they correspond to the average of the signals calculated with Eq. (11) for each of the four series. The uncertainties are calculated at each time , , with the standard deviation of the distribution and the number of shots for the series.
As explained in details in Ref. Cadene2013 , one has to consider systematic effects that mimic the CM effect we want to measure. We thus analyze our data following a general expression taking into account the symmetry properties of towards experimental parameters:
The functions correspond to a given symmetry towards the sign of and the direction of B. The first subscript (resp. ) indicates an even (resp. odd) parity with respect to the sign of . The same convention is used for the second subscript corresponding to B. Each function has a different physical origin which are summarized in Tab. 1. CM effect signal contributes to since it depends on the cavity birefringence and on the square of the magnetic field amplitude as shown in Eqs. (5) and (12). We can thus replace by .
| signal | Physical effect |
|---|---|
| , | |
| B effects on photodiodes | |
The functions are then extracted with a linear combination of as follows:
, , and are plotted in Fig. 7. Their uncertainties are calculated from the uncertainties. The weighting parameters , , and depend on the experimental adjustment from pulse to pulse and from day to day. Their relative variations are small: , , , . , and are mainly due to the variation from one shot to another and we can precisely calculate them since is measured for each shot. We obtain , and . These values are of the same order of magnitude as the one obtained during the CM measurement of helium gaz Cadene2013 . is independent of the variation. It mainly comes from a variation of the magnetic field from one pulse to another. As the relative variation is small compared to the relative variation we consider . The variation of is thus neglected.
We thus write:
| (17) |
We then calculate:
| (18) | |||||
which corresponds to the Cotton-Mouton signal. It is plotted in Fig. 8 together with a function superimposed to guide the eyes. Nevertheless, we see that the major component of is not but a supplementary systematic effect.
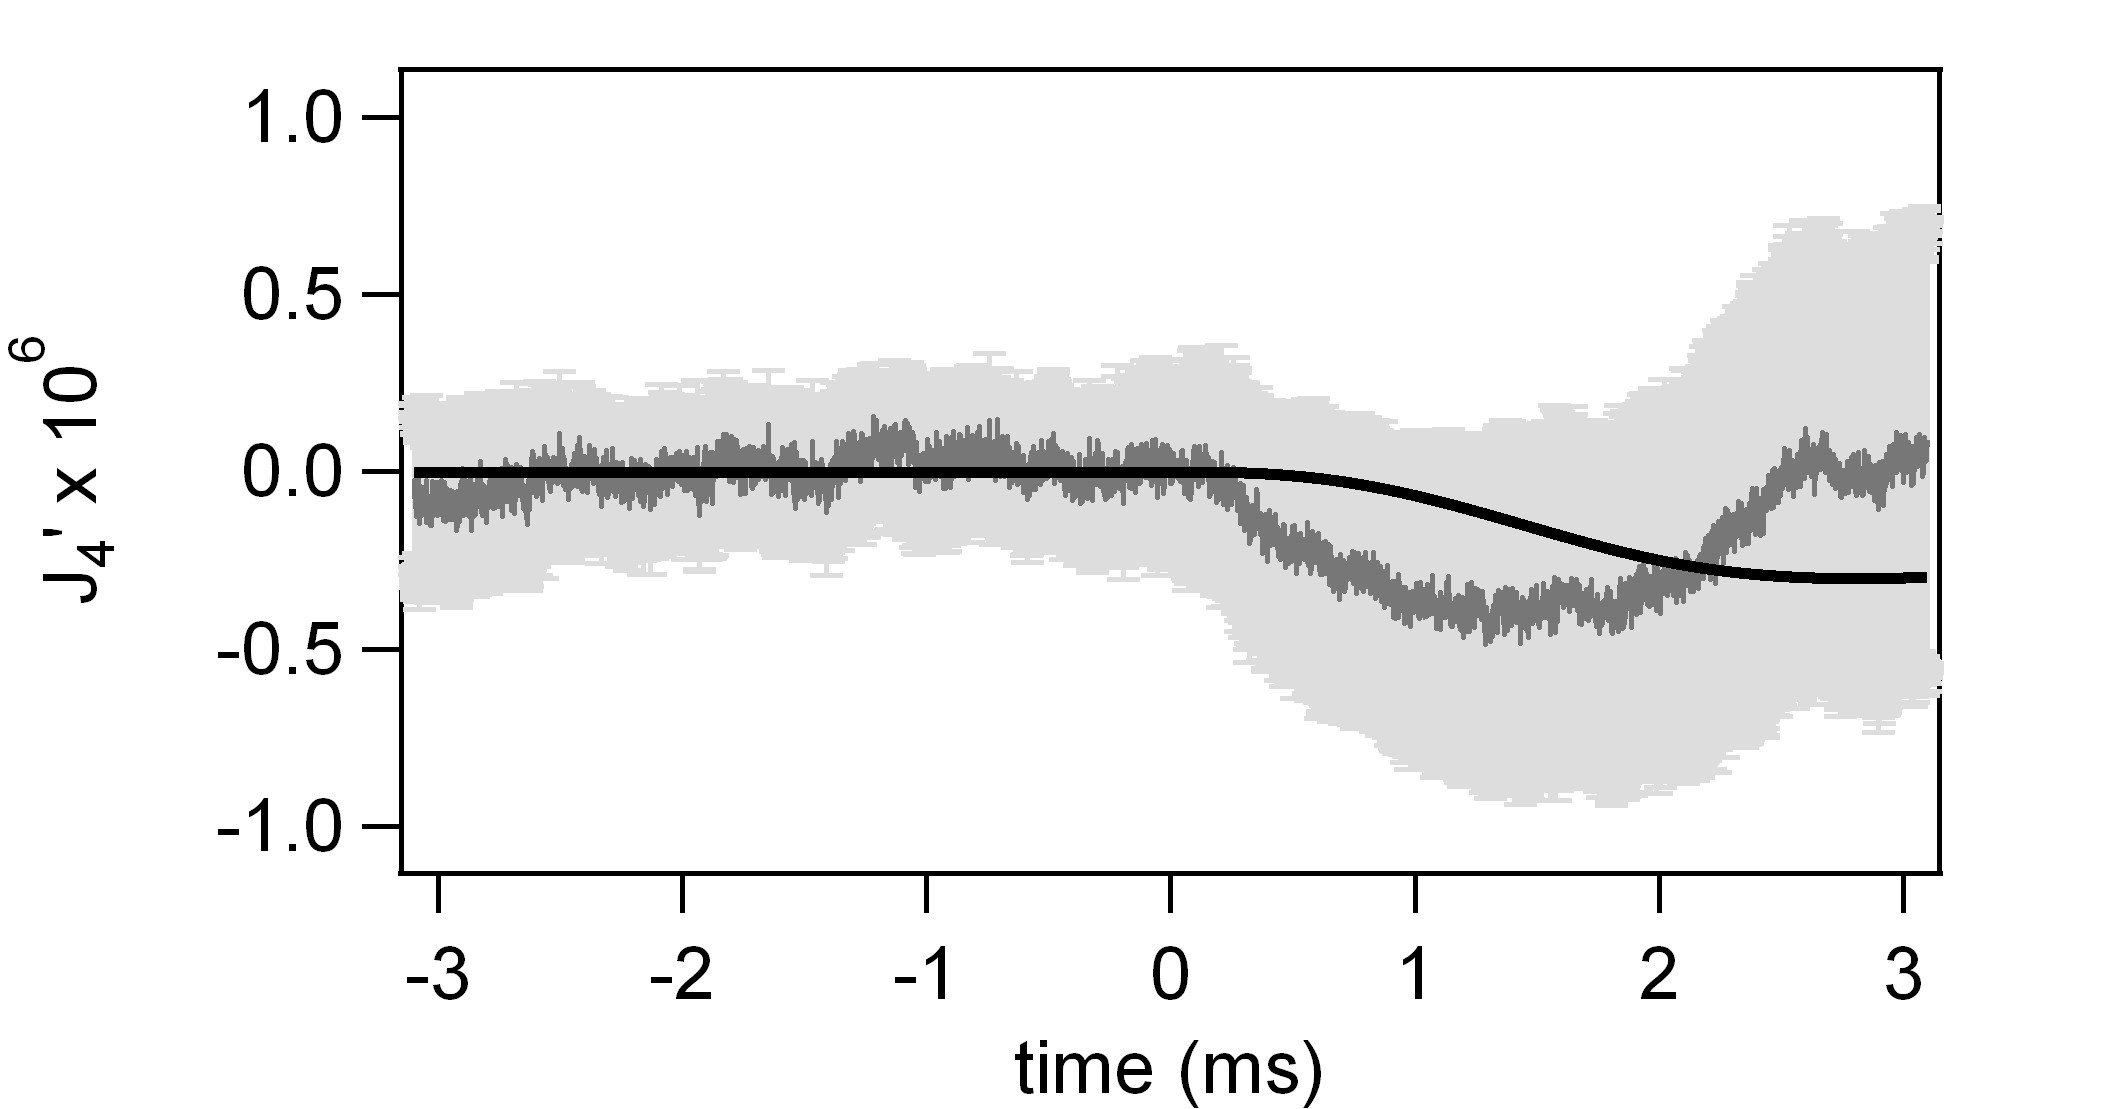
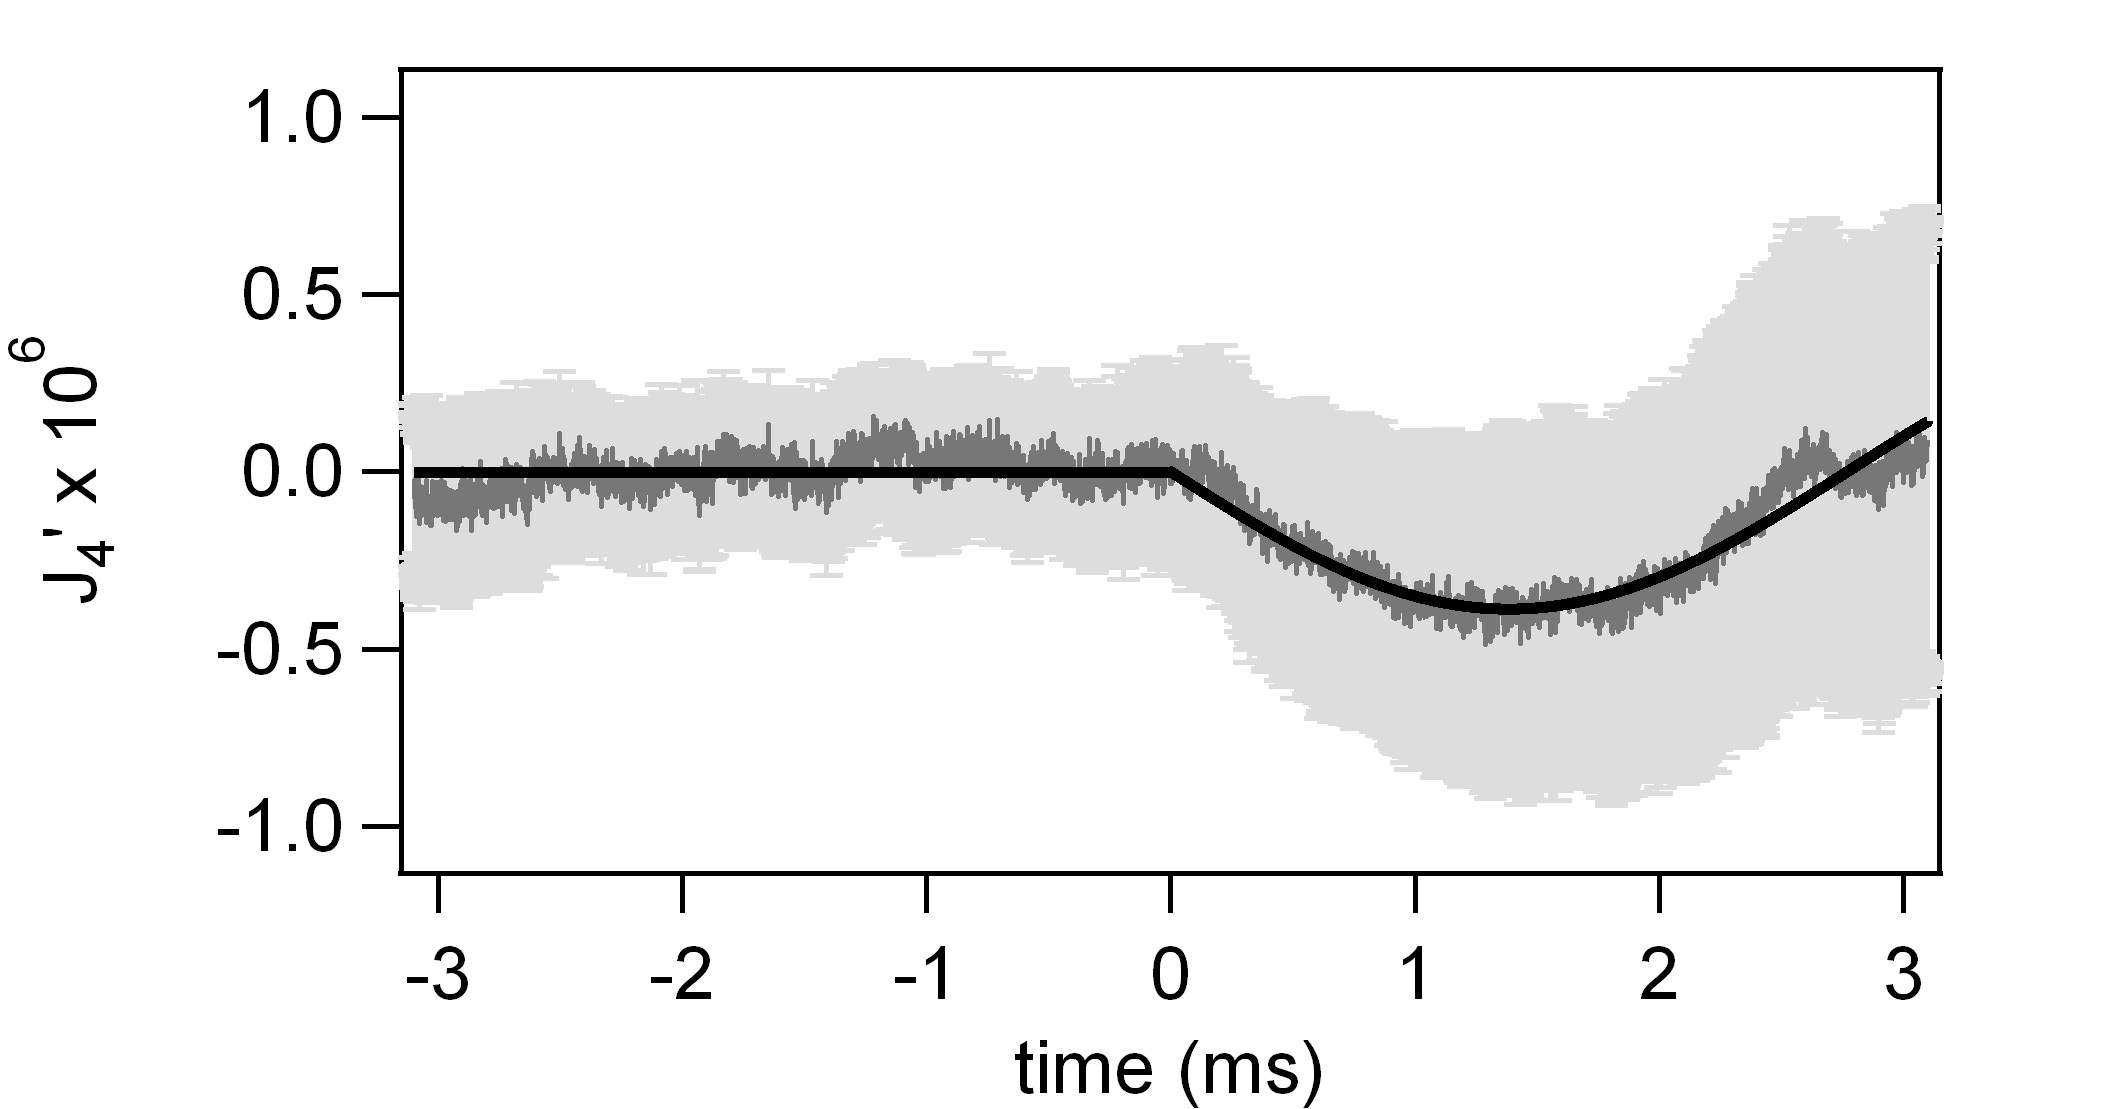
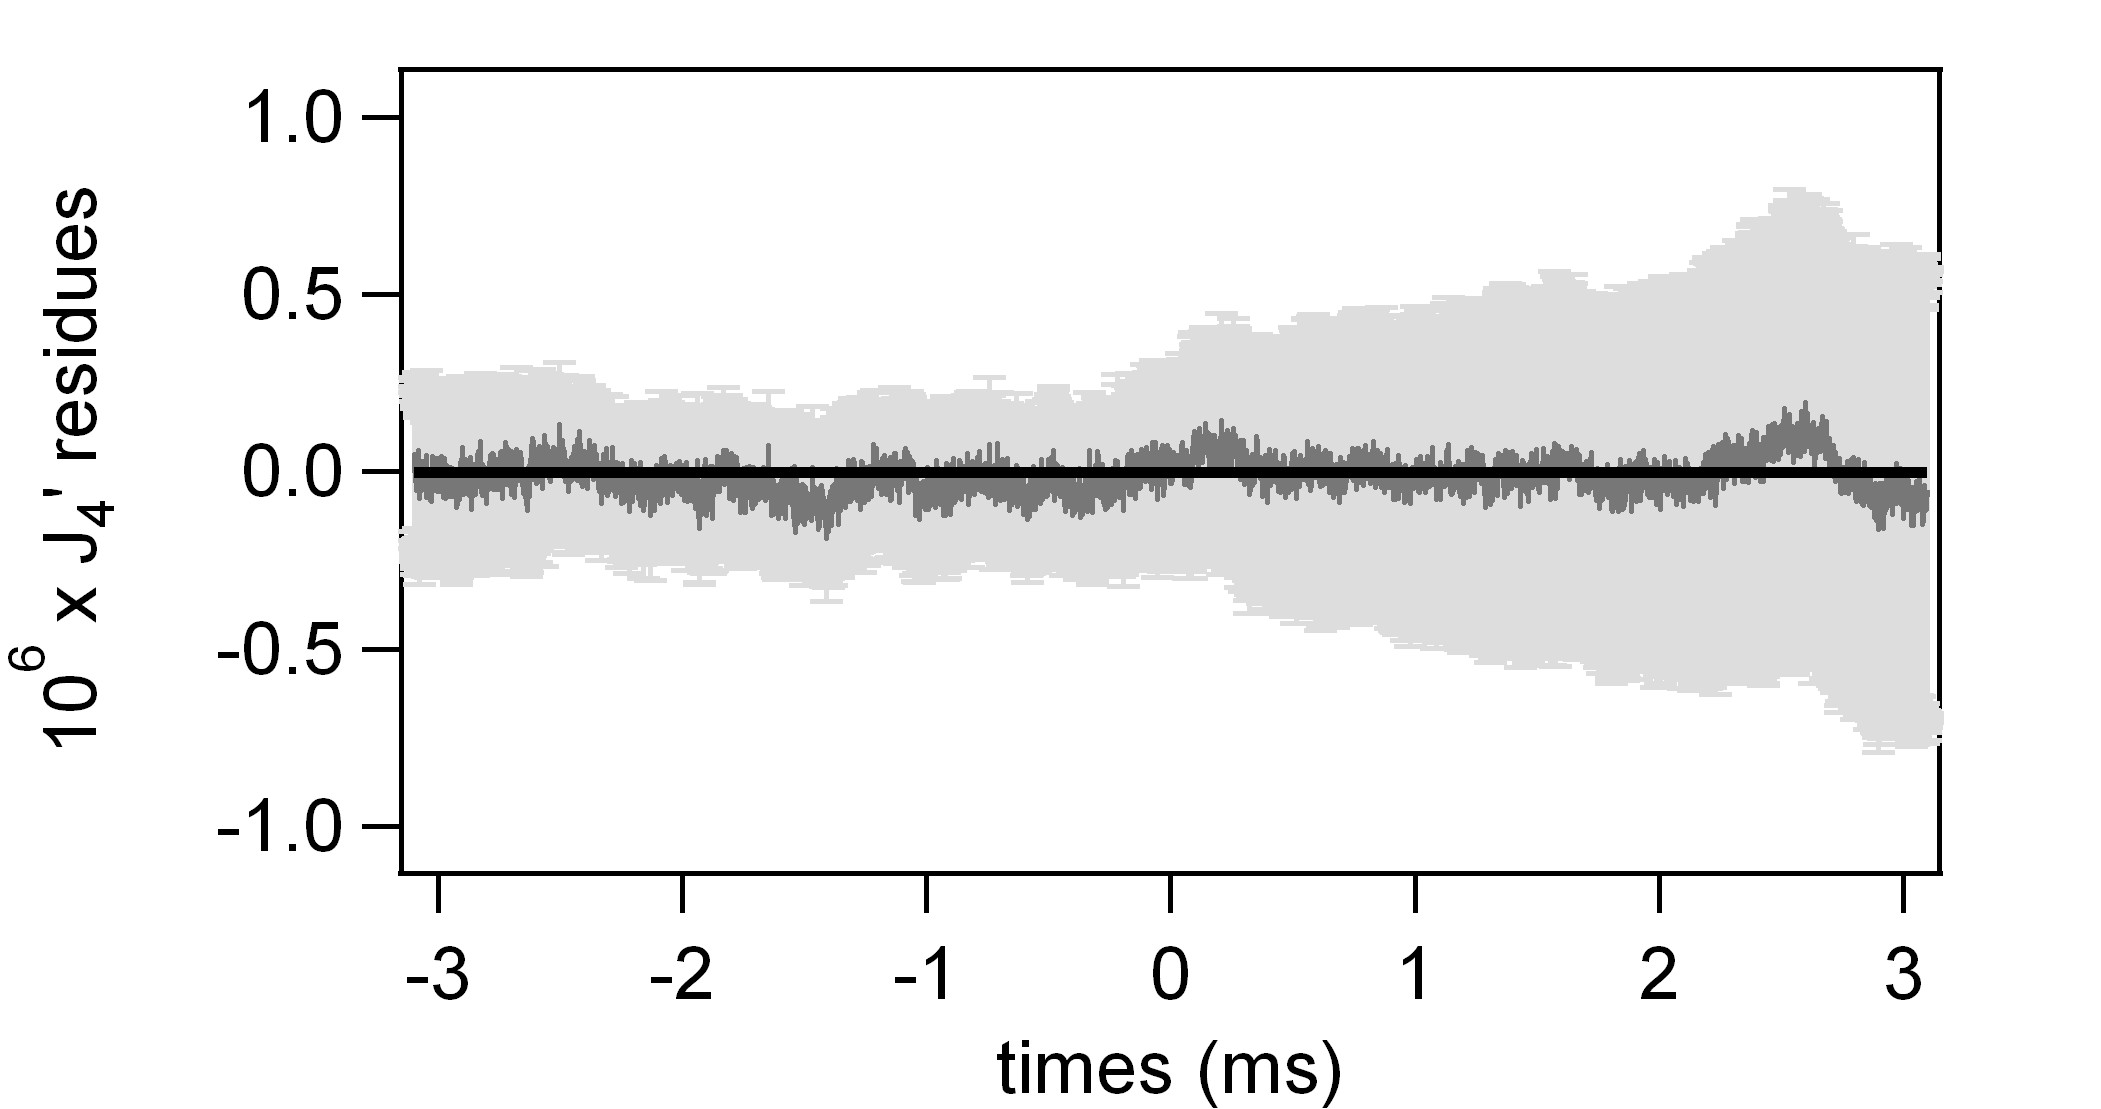
As sais before, the setup is subject to several mechanical resonances which can be excited both by the environment and the magnetic field. The latter could thus trigger a mechanical oscillation of the setup at . We try to fit by a sine function starting at . The fit gives a frequency of () Hz and it is superimposed to in Fig. 9a. We finally fit the residues by . The fit is superimposed to the residues of in Fig. 9b. The Cotton-Mouton constant is deduced from the measured experimental parameters as follows Berceau2012 :
| (19) |
We obtain:
| (20) |
at 3 confidence level. As said before we give error bars at corresponding to a confidence level of 99.8%, that usually indicates an evidence for a non-zero signal. The uncertainty takes into account the A-type and B-type uncertainties. The A-type uncertainties come from the fit and from the photon lifetime with a relative variation lower than 6 at . The B-type uncertainties have been evaluated previously and detailed in Ref. Berceau2012 . They essentially come from the length of the magnetic field with a relative uncertainty of 6.6 at . The value of Eq. (20) gives an estimate of our noise floor, which is half the one of the PVLAS collaboration in 2012 obtained with an integration time of 8192 s Zavattini2012 .
In order to assess more precisely the physical origin of the systematic effect, we zoom in the power spectral density of , depicted in Fig. 6, on the frequencies around 180 Hz. We find several resonances at 177 Hz, 200 Hz and above. The signal is then fitted by a sine function but with the frequency fixed to each of the resonance frequencies. The best fit, corresponding to the best , is obtained for 177 Hz, which is compatible with the frequency given by the previous fit. Fitting the residues by gives our final value for the CM constant:
| (21) |
at 3 confidence level.
On the other hand, if we fit the data corresponding to Fig. 8 with the sum of the sine function of 177 Hz frequency and , we obtain:
| (22) |
at 3 confidence level.
All this shows that our noise floor given by the uncertainties is of a few while the central value depends on the fitting procedure. Establishing what is the most statistically appropriate fitting procedure is out of the scope of this paper. Our goal is to report on our noise floor and to highlight the main contributions to systematic effects in order to improve the overall sensitivity of the next version of the apparatus.
Nevertheless, for the sake of comparison we show in Fig. 10 our typical value given in Eq. (22) together with the already published values. We see that our value is slightly better than the previous one.
4 Conclusions and perspectives
We presented the last advances of our BMV apparatus in terms of the best noise floor of vacuum magnetic birefringence ever realized. Our result validates our experimental method based on pulsed fields. In particular, it proves that the sensitivity obtained in a single pulse compensates the loss of duty cycle. To reach the QED value, the needed improvement is of three orders of magnitude. This is not conceivable with this first-generation experiment. Our strategy is therefore to increase the magnetic field thanks to the pulsed technology. At the moment, we have T2m but we conceptualized and tested a pulsed coil that has already reached a higher than 300 T2m. Two coils of this type will be inserted in the experiment in the near future. This essential step really makes the vacuum birefringence measurement within our reach.
On the other hand, our analysis has allowed us to identify some systematic effects. Obviously, a special care will be devoted to limit them in order to improve the accuracy. The magnetic field induces an excitation on the setup which resonates at different frequencies. Since it affects the signal , the resonance at 177 Hz has an odd symmetry with respect to the sign of . This implies that it concerns the mirror mounts. In order to get rid of this effect, a new setup was designed, providing a better magnetic insulation of the mirrors. It will also provide a better acoustic insulation of the mirror mounts, improving the overall sensitivity and decreasing the number of rejected shots. Moreover in the new version of our setup we will be able to measure the ellipticity both with equal to (no induced ellipticity) and (maximal induced ellipticity). This will allow us to subtract from the raw data the systematic effects that do not depend on the polarization direction, as the sine function at 177 Hz.
5 Acknowledgments
We thank all the members of the BMV collaboration, and in particular J. Béard, J. Billette, P. Frings, B. Griffe, J. Mauchain, M. Nardone, J.-P. Nicolin and G. Rikken for strong support. We are also indebted to the whole technical staff of LNCMI. We acknowledge the support of the Fondation pour la recherche IXCORE and the ANR-Programme non Thématique (Grant No. ANR-BLAN06-3-139634).
Références
- (1) C. Rizzo, A. Rizzo and D. M. Bishop, Int. Rev. Phys. Chem. 16, 81 (1997).
- (2) Z. Bialynicka-Birula and I. Bialynicki-Birula, Phys. Rev. D 2, 2341 (1970).
- (3) V. I. Ritus, Sov. Phys. JETP 42, 774 (1975).
- (4) R. Battesti and C. Rizzo, Rep. Prog. Phys. 76, 016401 (2013).
- (5) P. J. Mohr, B. N. Taylor, and D. B. Newell, Rev. Mod. Phys. 84, 1527 (2012).
- (6) R. Cameron, G. Cantatore, A. C. Melissinos, G. Ruoso, Y. Semertzidis, H. J. Halama, D. M. Lazarus, A. G. Prodell, F. Nezrick, C. Rizzo and E. Zavattini, Phys. Rev. D 47, 3707 (1993).
- (7) E. Zavattini, G. Zavattini, G. Ruoso, G. Raiteri, E. Polacco, E. Milotti, V. Lozza, M. Karuza, U. Gastaldi, G. Di Domenico, F. Della Valle, R. Cimino, S. Carusotto, G. Cantatore and M. Bregant, Phys. Rev. D 77, 032006 (2008).
- (8) G. Zavattini, U. Gastaldi, R. Pengo, G. Ruoso, F. Della Valle and E. Milotti, Int. J. of Mod. Phys. A 27, 1260017 (2012).
- (9) R. Battesti, B. Pinto Da Souza, S. Batut, C. Robilliard, G. Bailly, C. Michel, M. Nardone, L. Pinard, O. Portugall, G. Trénec, J.-M. Mackowski, G. L. J. A. Rikken, J. Vigué and C. Rizzo, Eur. Phys. J. D 46, 323 (2008).
- (10) P. Berceau, M. Fouché, R. Battesti and C. Rizzo, Phys. Rev. A 85, 013837 (2012).
- (11) A. Cadène, D. Sordes, P. Berceau, M. Fouché, R. Battesti and C. Rizzo, Phys. Rev. A 88, 043815 (2013).
- (12) R. W. P. Drever, J. L. Hall, F. V. Kowalski, J. Hough, G. M. Ford, A. J. Munley and H. Ward, Appl. Phys. B 31, 97 (1983).
- (13) S. Batut, J. Mauchain, R. Battesti, C. Robilliard, M. Fouché and O. Portugall, IEEE Trans. Applied Supercond. 18, 600 (2008).
- (14) F. Bielsa, A. Dupays, M. Fouché, R. Battesti, C. Robilliard and C. Rizzo, Appl. Phys. B 97, 457 (2009).
- (15) D. Jacob, M. Vallet, F. Bretenaker, A. Le Floch and M. Oger, Opt. Lett. 20, 671 (1995).
- (16) F. Brandi, F. Della Valle, A.M. De Riva, P. Micossi, F. Perrone, C. Rizzo, G. Ruoso and G. Zavattini, Appl. Phys. B 65, 351 (1997).
- (17) P. Berceau, M. Fouché, R. Battesti, F. Bielsa, J. Mauchain and C. Rizzo, Appl. Phys. B 100, 803 (2010).
- (18) G. Bialolenker, E. Polacco, C. Rizzo and G. Ruoso, Appl. Phys. B 68, 703 (1999).