On the nature of veiling of classical T Tauri stars spectra in the near-IR spectral band.
PACS numbers: 97.10.Ex; 97.10.Qh; 97.21.+a; 97.82.Jw
Keywords: stars – individual: BP Tau, CW Tau – T Tauri stars – spectra – infrared excess.
Abstract
It is shown that the existence of a hot accretion spot on the surface of classical T Tauri stars allows to explain observed veiling of their photospheric spectrum not only in the visible but also in the near infrared spectral band.
Introduction
Classical T Tauri stars (CTTS) are young ( yr), low mass stars at the stage of gravitational contraction towards the main-sequence, activity of which is caused by magnetospheric accretion of protoplanetary disc matter. It has long been known that the depths and equivalent widths of photospheric lines in the optical and ultraviolet spectra of T Tauri stars are smaller than that of main-sequence stars of the same spectral types. Recently this effect has been found in the near-infrared (NIR) spectral band – see Fischer et al. (2011) and references therein.
It is widely accepted that the veiling is caused by an additional continuous emission, which is formed in accretion hot spot on stellar surface due to heating of CTTS’s atmosphere by X-ray and EUV radiation of accretion shock. However Fischer et al. (2011) found that commonly used hot spot models of Calvet & Gullbring (1998), which assumed that the spot radiates in continuum only, cannot simultaneously explain the veiling at visible and NIR wavelengths because spot’s continuum emission flux dereases too rapidly if wavelength increasing. According to Muzerolle et al. (2003) emission of dust component of protoplanetary disk gives noticeable excess relative to the photospheric radiation only at wavelengths m, so to explain observed veiling near 1 m Fischer et al. (2011) have suggested that there is an additional source of the continuum emission with temperature 2500-5000 K.
Gahm et al. (2008) found from the analysis of highly veiled CTTS’s spectra that emission lines, which are formed in the accretion spot along with continuum, contribute significantly to decreasing of photospheric line’s depth. Dodin & Lamzin (2012) confirmed this discovery by theoretical modeling and also demonstrated that ”veiling by lines” is important for both CTTS with high and small veiled spectra. Moreover they found that at given effective temperature of the star the relative contribution of lines to veiling increases with decreasing of accretion flux, which is defined by the relation where and are pre-shock gas density and velocity respsectively.
Intensity of hot spot’s continuum emission in Dodin & Lamzin (2012) model decreases when one moves from visible to NIR spectral band as well as in the models of Calvet & Gullbring (1998). However wavelenght dependence of veiling by lines should be different, because it depends on gas temperature and density distribution in the stellar atmosphere heated by accretion shock radiation, as well as on parameters of individual lines, rather than on hot spot’s effective temperature. As the result dependence of the total (lines+continuum) veiling on wavelength in optical band becomes non-monotonic instead of monotonic in the case of veiling by continuum only – see Fig. 7 in Dodin & Lamzin (2012).
If near-IR veiling is caused mostly by lines then it would allow to explain observed CTTS’s veiling at wavelengths near 1 m, not involving an additional source of continuum emission. The aim of our work is to test this hypothesis.
The dependence of veiling on at high and low accretion fluxes in the frame of homogeneous spot model.
We will consider in this paper spectra of the system ”star+round homogeneous spot”, calculated by methods, described by Dodin & Lamzin(2012). The only difference is that we consider here not only visible but also NIR spectral band, more precisely from 0.45 to 1.2 m, i.e. up to maximum wavelength for which atomic data for spectral lines are aviable in the ATLAS package that we use. The expression ”homogeneous spot” means that and values are assumed to be constant across the accretion flow. In what follows we will use pre-shock gas number density rather than gas density:
Remind that it is used to characterize the veiling by the quantity
where and are equivalent widths of some photospheric line in spectra of CTTS and template star of the same spectral type respectively. To characterize veiling in some spectral region one presents -value avaraged over all absorption lines of this band.
| , Å | , Å | , Å | |||
| Ti I, Mg I | 4783.3 | Fe I | 6173.3 | Fe I | 9173.2 |
| Ni I, Cr I | 4829.2 | Cr I | 6330.1 | Ti I | 9599.6 |
| Fe I | 4903.3 | Fe I, Fe I | 6400.1 | Ti I | 9832.1 |
| Cr I, Fe I | 4942.5 | Ca I | 6462.6 | Fe I | 9889.0 |
| Ti I, Fe I | 4991.1 | Ni I | 6643.6 | Ti I | 10003 |
| Fe I, Fe I | 5027.2 | Ti I | 6743.1 | Fe I | 10155 |
| Fe I, Cr I | 5139.5 | Fe I | 6806.8 | Fe I | 10167 |
| Fe I, Fe I | 5273.2 | Al I, Co I | 7084.9 | Fe I | 10341 |
| Fe I | 5391.5 | Fe I | 7292.8 | Cr I | 10486 |
| Fe I | 5476.6 | Ca I | 7326.2 | Fe I | 10532 |
| Ca I | 5598.5 | Ti I, Fe I | 7440.8 | Ti I | 10662 |
| Fe I, Cr I | 5682.5 | Fe I | 7583.8 | Ti I | 10677 |
| Fe I, Fe I | 5762.7 | Ni I | 7727.6 | Ti I | 10775 |
| Cr I, Fe I | 5791.0 | Ti I, Ti I | 7978.8 | Cr I | 11157 |
| Ca I | 5857.5 | Fe I | 8075.2 | Cr I | 11339 |
| Fe I | 5916.3 | Mg I, Fe I | 8310.9 | Cr I | 11398 |
| Fe I, Ti I | 5952.9 | Fe I | 8616.3 | Fe I | 11422 |
| Fe I | 6027.1 | Cr I | 8976.9 | Fe I | 11595 |
| Ti I | 6085.2 | Fe I | 9070.4 | Ti I | 11797 |
| Ca I | 6122.2 | Ca I | 9099.1 | Ca I | 11956 |
| Note. Non-LTE cflculations were carried out for Ca I lines (Dodin et al., 2013). | |||||
We will demonstrate the contribution of emission lines to the total veiling on the example of two models: with relatively high and relatively low accretion flux These models reproduce (see Dodin et al., 2013 for details) 0.47-0.80 m spectra of CW Tau and BP Tau with reasonable accuracy, such as it is the same spectra that Fischer et al. (2011) used for optical veiling measurements. They were observed on 2006 November 30 and were taken from Keck Observatory Archive http://www2.keck.hawaii.edu/koa/public/koa.php.
In the case of CW Tau the parameters of the model were the following: the effective temperature and the gravity of the star were K and , respectively; cm-3, km s-1, the relative area of the spot the angle between spot’s symmetry axis and the line of sight This model is the example of a large spot (it occupies 40 % of visible stellar hemisphere) with relatively low infall gas density and low accretion flux
We will see below (see also Dodin & Lamzin, 2012) that strongly varies from one line to another, and therefore lines, used for veiling measurements, should be always specified. Unfortunately until now nobody does it, interpreting the scatter of -values of individual lines in the considered spectral band as a ”random error” of measurements. We have choosen for our veiling measurements deep absorption lines (without any signs of emission core) from our model spectrum which practically coincides with observed one. The list of these lines is presented in the Table.
The dependence that we calculated from CW Tau model spectrum is shown on Fig. 1. As far as theoretical and observed spectra coincide in the optical band our -values in this range should be identical to that of Fischer et al. (2011) up to the choice of spectral lines used for veiling measurements, and they indeed do as can be seen from the figure. At the same time the NIR veiling predicted by the model is also practically coinsides with Fischer et al. data, who have measured the NIR veiling from the IR spectrum, observed simultaneously with the optical one.
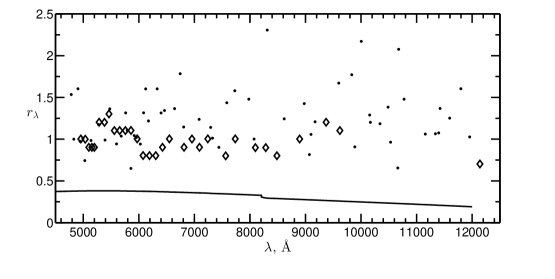
In addition to the total (line+continuum) veiling of the individual lines we plotted on the figure the curve, which indicates the veiling of photospheric lines caused by spot’s continuum emission only. It can be seen that in the considered case contribution of lines in decreasing of depth of photospheric lines is much larger than that of emission continuum, and it explains why values of at 5000 Å and at 1 m are practically the same in CW Tau spectrum.
We would like to pay attention to the important feature of the veiling by lines, which in fact consists of two components: 1) superposition of emission lines onto respective absorption lines of CTTS’s photosphere; 2) decreasing of surface of undisturbed photosphere due to the presence of a spot (cold or hot does not matter) or even due to eclipse of some part of stellar disk, for example by opaque dust cloud. The second effect is caused by the fact that the observed flux is the result of integration of radiation specific intensity over visible stellar hemisphere.
The removal of any part of the stellar surface from the integration region leads not only to decreasing of observed flux, but also to deformation of line’s profiles and to changing of their equivalent width due to differences in the limb darkening low in lines and continuum. For example we found that if to equate the intensity of spot’s radiation to zero in the CW Tau model, i.e. to replace the hot spot by the absolutely cold one, then the veiling for various lines will vary chaotically from -0.15 to +0.05 in the blue and from -0.05 to +0.25 in the IR spectral bands. Thus the radiations from the spot and the star should be summed up accurately, especially in the case of low veiling or in the case of possible presence of large cold or hot spots.
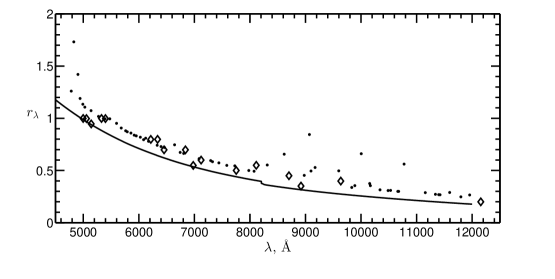
As the second example consider the model with larger value, which well reproduces the visual spectrum of BP Tau. The parameters of the model are the following: K, cm-3, km s-1, This model is the example of a small spot (it occupies only 2 % of the visible stellar hemisphere), but with large pre-shock gas density and large accretion flux
It can be seen from Fig. 2 that the model well reproduces the observed veiling in the range from 0.47 to 1.2 m. Note that the IR spectrum of BP Tau, in which Fischer et al. have measured the veiling, was observed simultaneously with the optical one. In the case of BP Tau the veiling is caused predominantly by continuum emission, and therefore almost monotonically decreases with wavelength. It would seem that Calvet & Gullbring (1998) model, which assumes that hot spot radiates in continuum only, could explain BP Tau observations, and therefore it is unclear why Fischer et al. (2011) who used this model, could not agree theory with observations.
Conclusions
We have shown that if to calculate accretion hot spot spectrum taking into account not only continuum but also line emission and properly sum up contributions of the spot and undisturbed stellar photosphere then the observed veiling of CTTS spectra in the near-IR band can be explained without additional sources of veiling continuum.
Fischer et al. (2011) found that the shapes of dependences in CTTS spectra can be very different. It follows from our consideration of homogeneous accretion spot models that in the case of a large spot with low an average value of is almost constant from 0.5 to 1.2 m, and in the case of a small spot with high the veiling drops rapidly with wavelength increasing. It means that models with inhomogenious distribution of and parameters across the spot can produce various shapes of curves: from the almost flat veiling up to the veiling, which concentrated almost complitely in UV and visual spectral bands. Note that the real spots should certainly be inhomogeneous (Romanova et al., 2004).
We would like to note that neglecting with contribution of lines in veiling should lead to an error in estimation of interstellar extinction. Indeed to compensate hypothetical additional continuum emission it is necessary to increase its extinction. Apparently it is why Fisher et al. (2011) found that the extinction determined from IR spectra is systematically larger than that determined from optical ones.
We thank Dr. L.Ingleby and her colleagues, who drew your attention to the problem of near-IR veiling. This research has made use of the Keck Observatory Archive, which is operated by the W.M. Keck Observatory and the NASA Exoplanet Science Institute (NExScI), under contract with the the National Aeronautics and Space Administration. S.Dahm is the principal investigator of BP Tau and CW Tau observations, used in this paper. The work was supported by the Program for Support of Leading Russian Scientific Schools (NSh-5440.2012.2).
References
- [1] Calvet N. & Gullbring E. Astrophys. J. 509, 802 (1998).
- [2] [0.15cm]
- [3] Dodin A. V. & Lamzin S. A., Astron. Lett. 38, 649 (2012)
- [4] [0.15cm]
- [5] Dodin A. V., Lamzin S. A., Sitnova T. M., Astron. Lett. 39, in press (2013) = arXiv:1302.1825
- [6] [0.15cm]
- [7] Fischer W., Edwards S., Hillenbrand L., Kwan J. Astrophys. J. 730, 73 (2011).
- [8] [0.15cm]
- [9] Gahm G. F., Walter F. M., Stempels H. C., Petrov P. P., Herczeg G. J. Astron. Astrophys. 482, L35 (2008).
- [10] [0.15cm]
- [11] Muzerolle J., Calvet N., Hartmann L., D’Alessio P. Astrophys. J., 597, 149 (2003).
- [12] [0.15cm]
- [13] Romanova M. M., Ustyugova G. V., Koldoba A. V., Lovelace R. V. E. Astrophys. J., 610, 920 (2004).
- [14]