From data towards knowledge: Revealing the architecture of signaling systems by unifying knowledge mining and data mining of systematic perturbation data
1. Department of Biomedical Informatics, University of Pittsburgh, Pittsburgh, PA 15232.
2. Dept Biochemistry and Molecular Biology, Medical University of South Carolina, Charleston, SC 29425.
Corresponding Author: Xinghua Lu, Department of Biomedical Informatics, University of Pittsburgh, 5607 Baum Boulevard, Pittsburgh, PA 15232.
Abstract
Genetic and pharmacological perturbation experiments, such as deleting a gene and monitoring gene expression responses, are powerful tools for studying cellular signal transduction pathways. However, it remains a challenge to automatically derive knowledge of a cellular signaling system at a conceptual level from systematic perturbation-response data. In this study, we explored a framework that unifies knowledge mining and data mining approaches towards the goal. The framework consists of the following automated processes: 1) applying an ontology-driven knowledge mining approach to identify functional modules among the genes responding to a perturbation in order to reveal potential signals affected by the perturbation; 2) applying a graph-based data mining approach to search for perturbations that affect a common signal with respect to a functional module, and 3) revealing the architecture of a signaling system organize signaling units into a hierarchy based on their relationships. Applying this framework to a compendium of yeast perturbation-response data, we have successfully recovered many well-known signal transduction pathways; in addition, our analysis have led to many hypotheses regarding the yeast signal transduction system; finally, our analysis automatically organized perturbed genes as a graph reflecting the architect of the yeast signaling system. Importantly, this framework transformed molecular findings from a gene level to a conceptual level, which readily can be translated into computable knowledge in the form of rules regarding the yeast signaling system, such as “if genes involved in MAPK signaling are perturbed, genes involved in pheromone responses will be differentially expressed”.
Introduction
Model organisms, such as Saccharomyces cerevisiae and Drosophila melanogaster, are powerful systems to study cellular signal transduction, because they are amenable to systematic genetic and pharmacological perturbations, enabling biologists to infer whether a gene is involved in a signal transduction pathway through studying perturbation-response data. The premise for elucidating signal transduction pathways from systematic perturbation experiments is that, if perturbation of a set of genes consistently causes a common cellular response, e.g., a phenotype presented as the differential expression of a module of genes, the perturbed genes are likely the members (or modulators) of the signal transduction pathway that leads to the phenotype.
In this study, we refer to a signal from an information theory (Cover and Thomas,, 2006) point of view, in which a signal is a latent variable whose state contains information with respect to another variable, e.g., the expression state of a gene module or the state of another signal. From the same viewpoint, a signaling system consists of a set of latent variables connected as a network, in which an edge exists between a pair of signals if the state of one signal affects that of the other, i.e., information can be transmitted between the signals, and the relay of signals along the paths in the network enables the system to encode complex information. From a cell biology viewpoint, a signal transduction pathway consists of a collection of signaling molecules that detect and transmit a signal that has a physical or chemical form, e.g., the represent of pheromone in the environment. In such a system, a signal is encoded as a change in the state of a signaling molecule, often manifested as a change in the structural conformation of a protein, chemical modification of a signaling molecule, or a change in the concentration of a signaling molecule. While it would be ideal to find a one-to-one mapping between the signaling molecules in cells and the signals in the information theory framework, such a mapping can be difficult to obtain and too complex to represent. Representing cellular signaling systems within the abstract information-theory framework provides the following advantages: 1) it enables us to use latent variables to represent the state of yet unknown signaling molecules; 2) it allows us to represent the biological signals encoded by a group of signaling molecules into a single-bit signal, if the signals encoded by these molecules convey a common piece of information with respect to other variables. We refer to such a group of signaling molecules as a signaling unit. The following example illustrate the parallelism between the biological entities and and their counterparts in a computational model. A pheromone receptor in a yeast cell and its associated G-proteins can be thought of as one signaling unit, as they function together to detect the signal of pheromone in an inseparable manner. Another exemplary signaling unit is the cascade of mitogen-activated protein kinases (MAPKs), which transduce signals among themselves through a chain of protein phosphorylation reactions almost in a deterministic fashion. The states of these signaling units can be represented as two single-bit signals in a computational model. When a yeast cell is exposed to pheromone, the receptor unit detects the signal and transmit the signal to MAPKs unit(Gustin et al.,, 1998; Herskowitz,, 1995), which further relays the signal to down stream signaling units to regulate expression of downstream genes involved in mating. These relationships between signaling units can be represented as edges in the model. Moreover, in addition to pheromone response, the MAPK signaling unit also interacts with other signaling units to transmit the signals that affect filamentation/invasion processes (Gustin et al.,, 1998; Herskowitz,, 1995); such branching and cross-talks between different signaling pathways can be represented as a network connecting signals in the computational model. Thus, the general task of using systematic perturbation data to study a cellular signaling system can be reduced to the following specific tasks: 1) revealing the signals embedded in the convoluted molecular phenotype data such as microarrays, 2) identifying perturbed genes that affect a common signal, 3) grouping perturbed genes into signaling units based on the information they encode, and 4) inferring the paths between signaling units where a path may or may not correspond to a signal transduction pathway in conventional cell biology.
In the seminal work by Hughes et al., (2000), yeast cells were subjected to over 300 types of systematic perturbations (gene deletions and chemical treatments111From here on, we refer to such a treatment experiment as a perturbation instance) and the transcriptional responses to the perturbations were measured using microarrays. This dataset has been widely used to test different computational approaches for investigating the relationship between perturbed genes and responding genes (Hughes et al.,, 2000; Tanay et al.,, 2002; Ourfali et al.,, 2007; Markowetz et al.,, 2007; Yeger-Lotem et al.,, 2009; Huang et al.,, 2009). For example, using a conventional hierarchical clustering approach, Hughes et al grouped perturbed genes into clusters to elucidate the cellular functions of some genes, based on the fact that perturbing these genes produced gene expression profiles similar to those resulting from perturbing the known members of certain pathways. To relax the requirement of global similarity by hierarchical clustering, other researchers have studied approaches to connect a subset of perturbation instances to a subset of responding genes in order to find context specific information between the perturbation and the responses (Tanay et al.,, 2002). Such a task is often cast as a biclustering problem (Madeira et al.,, 2004; Cheng et al.,, 2000; Erten et al.,, 2010). More recently, sophisticated graph-based algorithms have been applied to the dataset to study potential signal pathways (Yeger-Lotem et al.,, 2009; Huang et al.,, 2009; Ourfali et al.,, 2007). The basic idea underlying the studies by Yeger-Lotem et al and Huang et al is to model the information flow from perturbed genes to responding genes through a PPI network by employing graph search algorithms, e.g., price collecting Steiner tree algorithms.
While the above studies have led to many biological insights regarding the system at a gene level, they did not address the task of discovering signaling units and representing the findings at a conceptual level in order to derive computable knowledge, such as the rule: if a gene involved in MAPK pathway is deleted, the cellular response to pheromone will be affected. Transforming experimental data into concepts and further elucidating the relationship among the concepts are critical steps of knowledge acquisition and knowledge representation. The scale of contemporary biotechnologyies further necessitates computational approaches to perform such tasks in an automated manner in order to facilitate knowledge discovery by human experts. Yet, the development of such techniques is severely lagging behind the pace of data generation. In this paper, we report a proof of concept framework that unifies knowledge mining and data mining to derive knowledge regarding a signaling system in an automatic manner, and we refer to the overall approach as ontology-driven knowledge discovery of signaling pathways (OKDSP). We tested the framework using the yeast perturbation-response data by Hughes et al., (2000) to illustrate its utility.
Results and Discussion
A key step of “reverse engineering” signaling pathways using systematic perturbations data is to identify perturbations that convey the same information, in other words, to first find the “jigsaw puzzle” pieces belonging to a signal transduction pathway. For example, a classic yeast genetic approach is to search for deletion strains that exhibit a common phenotype as a means for identifying genes potentially involved in a signaling pathway carrying information with respect to the phenotype (Winzeler et al.,, 1999). The advent of genome technologies enables biologists to use genome-scale data, such as gene expression data, as “molecular phenotypes” to study the impact of systematic perturbations (Hughes et al.,, 2000). In general, a perturbation treatment, such as deleting a gene, often affects multiple biological processes. For example, deleting a gene involved in ergosterol metabolism will affect the organization of cell membrane, which in turn will affect multiple signaling pathways located in the membrane. As such, the overall cellular response to a perturbation instance, which often manifested as a long list of differentially expressed genes, inevitably reflects a mixture of responses to multiple signals. Thus, we are confronted with two fundamental tasks when studying systematic perturbation data: 1) dissecting signals from the convoluted gene expression responses to a perturbation instance, i.e., finding a module of genes whose expression state reflects the state of a signal transduced along a signaling pathway, 2) identifying a set of perturbation instances that affects the signal regulating a common expression module.
To address the tasks, we hypothesize that, if a module of genes—whose functions are coherently related—responds to multiple perturbation instances in a coordinated manner, the genes in the module are likely regulated by a common signal, and the perturbation instances affect this signal. Based on this assumption, we can first decompose the overall expression response to a perturbation instance into functional modules, with each module potentially responding to a distinct signal; then we can investigate if a functional module is repeatedly affected in multiple perturbation instances. In this study, we developed an ontology-based knowledge mining approach to identify functional modules, and we then developed a novel bipartite-graph-based data mining approach to search for perturbation instances affecting a common signal. Based on the results from the steps above, we further identified signaling units and revealed their organization in a signaling system using a graph-based algorithm.
Identifying functional modules through knowledge mining
The Gene Ontology (Ashburner et al.,, 2000) (GO) contains a collection of biological concepts (GO terms) describing molecular biology aspects of genes. The relationship among the concepts are represented in a directed acyclic graph (DAG). An edge reflecting an “is-a” relationship between a pair of GO terms indicates that the concept encoded by the parent term is more general and subsumes the concept of the child term. The GO has been widely used to annotate the function of genes of different model organisms, therefore it is natural to treat a set of genes annotated with a common GO term as a functional module, a widely used approach in bioinformatics analyses (Segal et al.,, 2004; Subramanian et al.,, 2005).
We first investigated if original GO annotations from the GO database are suitable to represent the major functional themes of genes responding to perturbations in our setting. Based on the results of gene expression analysis performed by Hughes et al, genes were determined to be differentially expressed in response to one or more perturbation instance(s). We identified all the GO terms that have been used to annotate these genes and retained a subset that belong to the Biological Processes domain of the GO, which consisted of 1,739 unique GO terms. We studied the distribution of the number of genes annotated by each GO term, and the results are shown as a histogram in Figure 1. The figure shows that a large number of original GO annotations was associated with only a few genes; in fact almost half () of the GO terms was associated with only 1 or 2 genes. The results reflect the fact that, while original GO annotations are highly specific and informative with regards to individual genes, they would fail to represent the major functional themes of a set of genes. Therefore, there is a need to identify more general terms to represent major functional themes.
We then formulated the task of finding functional modules as follows: given a list of genes responding to a perturbation instance and their GO annotations, assign the genes into non-disjoint functional modules, such that genes within a module participate in coherently related biological processes. This was achieved by utilizing the hierarchical organization of the GO to group a subset of genes under a suitable GO term, which retains as much of original the semantic information as possible. We developed novel quantitative metrics for objectively assessing the fitness of a summarizing GO term, which enabled us to find a term that covered many genes and yet minimized the loss of semantic information the original annotations. Our criteria for a summarizing GO term included: 1) requiring the summarizing term to be statistically enriched in the input gene list, and 2) requiring the functions of the genes in a module to be semantically coherent when measured with a functional coherence metric previously developed by our group (Richards et al., (2010), see Methods section). This enabled us to dynamically search for suitable terms along the GO hierarchy and to group genes under suitable summary terms in a manner that is specific for each input gene list, rather than using pre-fixed annotations (Subramanian et al.,, 2005). We refer to this approach as a knowledge mining approach because it searches for a new representation of the function of genes through assimilating knowledge represented by the original annotations.
Applying this approach, we identified functionally coherent modules for each perturbation experiment. Further, we merged the modules from different perturbation instances that shared a common GO annotation. The procedure led to a total of 527 distinct functional modules, each summarized with a distinct GO term. The statistics of the modules, the number of genes annotated by summarizing terms and the levels of the terms in the GO hierarchy, are shown in Figure 1. It is interesting to note that while the summarizing GO terms tend to annotate more genes than the original ones, the distribution of the terms along the GO hierarchy is quite close to the original annotations, indicating that our approach retained a level of semantic specificity similar to the original annotations.
We further investigated the modules and found the results biologically sensible. For example, we found that 38 genes were grouped into a module annotated with the term GO:0008643 (carbohydrate transport) (from here on, we name a functional module using its summary GO term), including 17 genes in hexose transport {HXT1, HXT2, …, HXT17}. The original annotations of the genes in the module included GO:0051594 (detection of glucose, covering 3 genes), GO:0005536 (glucose binding, covering 3 genes), GO:0005338 (nucleotide-sugar transmembrane transporter activity, covering 4 genes), GO:0005353 (fructose transmembrane transporter activity, covering 16 genes), and so on. Our algorithm summarized the function of the genes using the term GO:0008643 (carbohydrate transport), which we believe does not result in a significant loss of information regarding the individual genes, thus providing a sensible representation of overall function of a larger group of genes. A list of function modules is shown in the supplementary website.
Searching for perturbation instances affecting a common signal
Using a functional module from the previous section as a putative unit responding to a cellular signal, we further searched for the perturbation instances affected to the functional module. Success in finding a set of functionally coherent genes that repeatedly co-responded to multiple perturbation instances would provide a strong indication that the responding genes are regulated as a unit by a common signal and that the perturbation instances may have affected such a signal. We addressed the searching task in the following steps: 1) Given a functional module, we first created a bipartite graph using all perturbation instances on one side and the genes in the functional module on the other side, referred to as a functional-module-based graph. In such a graph, an edge between a perturbation instance and a responding gene indicates that the gene is differentially expressed in response to the instance. 2) We then searched for a densely connected subgraph satisfying the following conditions: a) each vertex was on average connected to a given percent, , of the vertices on the opposite side, and b) the size (number of vertices) of the subgraph was maximized. We refer to the vertices on the perturbation side of a densely connected subgraph as a perturbation module, and those on the responding side as a response module. The problem of finding such a subgraph from a bipartite graph belongs to a family bi-clustering problems (Madeira et al.,, 2004; Cheng et al.,, 2000; Erten et al.,, 2010), which are NP-hard. There are many approximate algorithms for solving the problem (see the review by Madeira et al., (2004)), but our formulation has distinct objectives, which allow us to specify the degree of connectivity between perturbation and responding modules. We have developed and implemented a greedy algorithm, referred to as the maximal bipartite subgraph with expected connectivity (MBSEC) algorithm, to solve this problem, see Methods.
We performed experiments to test the following two hypotheses: 1) using functional-module-based graphs as inputs for a dense-subnetwork searching algorithm would enhance the capability of identifying signaling pathways; 2) specifically pursuing high density of a subgraphs enhances the capability of finding signaling pathways. To test the first hypothesis, we applied an algorithm referred to as the statistical-algorithmic method for bicluster analysis (SAMBA) by Tanay et al., (2002) to assess the impact of different inputs on the quality of perturbation-response modules. SAMBA is a well-established algorithm that solves the biclustering problem under a bipartite graph setting, which is similar to problem setting. We first applied the SAMBA (implemented in the Expander program, v5.2) with default settings to the global bipartite graph consisting of all 5,289 responding genes and 300 perturbations, which returned a total of subgraphs. We then applied the SAMBA program to each of the functional-module-based graphs, and a total of subgraphs were returned. To test the second hypothesis, we applied the MBSEC algorithms to the same functional-module-based graphs as in the previous experiment, using the following parameter settings: and . The experiment identified a total of subgraphs that satisfied the requirements.
We assessed the overall quality of a perturbation (or a responding) module by determining the functional coherence score of the module using the method previously developed by our group (Richards et al.,, 2010). This method measures functional relatedness of a set of genes based on the semantic similarity of their functional annotations and provides a p-value of the coherence score of a gene set. The key idea of this method is as follows: given a set of genes, map the genes to a weighted graph representing the ontology structure of the GO, in which the weight of an edge reflects the semantic distance between the concepts represented by the a pair of GO terms; identify a Steiner tree that connects the GO terms annotating these genes and measure how closely the genes are located within the graph using the total length of the tree; apply a statistical model to assess if the genes in the set are more functionally related than those from a random gene set. A gene set with a small p-value would indicate that the functions of the genes are coherently related to each other.
Figure 2 shows the results of functional coherence analysis of responding modules (Panel A) and perturbation modules (Panel B) by plotting the cumulative distribution of the modules based on their p-values. Panel A shows that all responding modules returned by our MBSEC algorithm and those returned by SAMBA with functional-module-based graphs as input were assessed as functionally coherent. This is not surprising, as all the input modules were functionally coherent (p-value ), and therefore the returned responding modules, which were sets of the input modules, were likely to be coherent. In comparison, when using the global perturbation-response bipartite graph as input, about 70% of the responding modules identified by SAMBA were assessed to be coherent. The results indicate that, while the SAMBA algorithm is capable of identifying biclusters with coherent responding modules, a high percentage of returned responding modules contains a mixture of genes involved in diverse biological processes.
Since the goal is to find perturbation instances that likely constitute a signaling pathway, it is more interesting to inspect if the genes in a perturbation module are coherently related. We assessed the functional coherence of the perturbation modules returned from the three experiments for the impact of different inputs and algorithms on the results (see Panel B of Figure 2). A higher percentage of perturbation modules was functionally coherent when functional-module-based graphs were used as inputs for SAMBA when compared with those from the SAMBA with a global graph, indicating that indeed perturbation instances densely connected to a functionally coherent responding module were more coherent themselves, i.e., they were more likely to function together. When comparing the results from MBSEC algorithm with those from the SAMBA, our algorithm returned the highest percentage of functionally coherent perturbation modules. The results indicate that, when inputs are the same, specifically pursuing high density subgraphs enhances the quality of identified perturbation modules.
We further inspected the within subgraph connectivity, determined as the number of edges within a subgraph over the number of maximal possible edges (, with and representing the number of vertices on each side respectively), to investigate if the differences in functional coherence of the modules were related to the capabilities of the algorithms to find densely connected graphs. Figure 3 shows that there were striking differences in the connectivity of the subgraphs returned from three experiments. The results also support the notion that enhanced capability of finding densely connected perturbation-response bipartite graph underlies the capability of identifying coherent modules.
In addition to assessing the functional relationship of the genes, we further quantified and compared within module physical and genetic interactions, which provided another line of evidence for assessing if genes in the modules were functionally related. Using protein-protein physical interaction and genetic interaction data from the BioGrid (Stark et al.,, 2010), we calculated the ratio of the number of known interactions within a module containing genes over the maximum number of possible interactions for the module (). We plot the cumulative distributions of modules based on their interaction ratios in Figure 4. The figure shows that there are more physical and/or genetic interactions within both perturbation and responding modules identified by our methods, indicating that indeed the genes in these modules are more likely to function together.
Taken together, these results indicate that, by constraining the search space to functionally coherent genes and explicitly requiring a degree of connectivity of subgraphs, our approach enhances the capability of identifying perturbation modules in which the genes are more likely to physically interact with each other to participate in coherently related biological processes. Thus they likely participate in a common signaling pathway and carry a common signal.
Discovering signaling pathways based on perturbation-responding subgraph
A subgraph consisting of a perturbation and a responding module reflects the fact that the perturbation instances affected the signal controlling the expression state of the genes in the responding module. It is interesting to see if a perturbation module contains the members and/or modulators of a signaling pathway. Indeed, we found many of the identified perturbation modules corresponded to well-known signaling pathways. For example, our analysis identified a subgraph consisting of a responding module of genes annotated by the GO term GO:0019236 (response to pheromone) and a perturbation module consisting of perturbation instances: {, , , , , , , , , , , , , , , }. In the list of the perturbation instances, we highlighted (with blue font) the genes that are known to be members of the well-studied yeast pheromone response pathway reviewed by Gustin et al., (1998), which listed 20 gene products as the members of the pathway. In the study by Hughes et al., (2000), 12 out of those 20 genes were deleted. We found that 10 out of these 12 perturbation instances were included in the perturbation module of this subgraph. This result indicates that our approach is capable of re-constituting the majority of the genes involved in the pheromone signaling pathway. Inclusion of ergosterol metabolism enzymes, ERG28 and HMG2, in the perturbation module indicates that our approach can also identify the modulators of a signaling pathway.
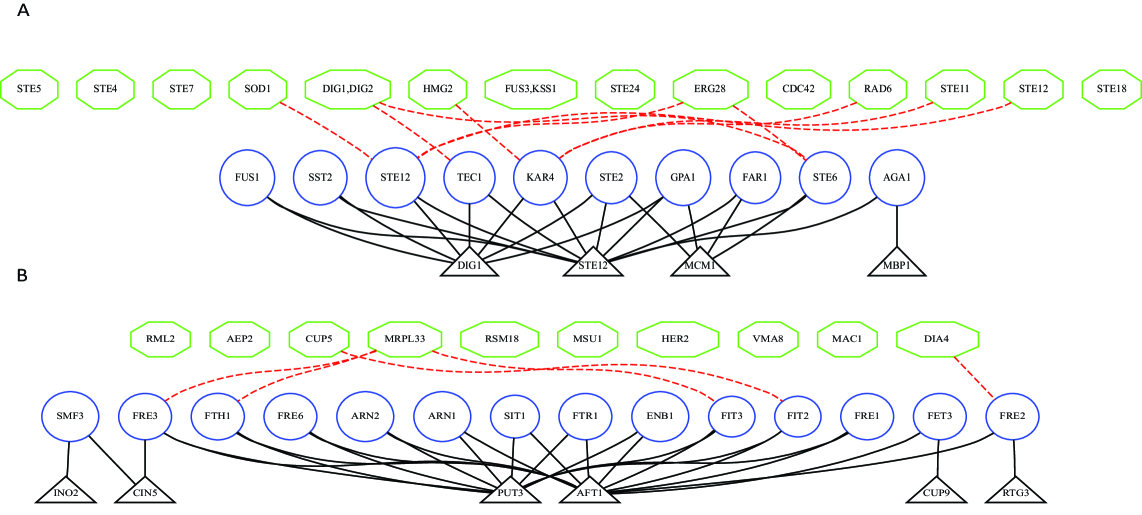
In addition to “re-discovering” the known signaling pathways, analysis of subgraphs obtained in this study led novel hypotheses. For example, in one subgraph, the responding module was annotated with GO:0006826 (iron ion transport) and consisted entirely of genes involved in cellular iron homeostasis, including iron transporters and ferric reductases, shown in Panel B of Figure 5. These genes are known to be primarily regulated by the iron-responsive transcription factor Aft1p and partially comprise the iron regulon in yeast (Yamaguchi-Iwai et al.,, 1996). Intriguingly, the perturbed gene set consisted largely of proteins involved in mitochondrial translation, including gene products involved in mitochondrial ribosomal subunits (, , ), translation (, , ), and RNA processing (). These data lead to a novel hypothesis that perturbation of mitochondrial protein synthesis will lead to changes in the iron sensing process. In fact, such a link has only recently been suggested, in that iron-sulfur complex synthesis in mitochondria, which requires a set of 10 distinct protein components (Lill et al.,, 2000), directly impacts cellular iron uptake and utilization (Hausmann et al.,, 2008; Rutherford et al.,, 2005). Indeed, these data provide a rationale for the new hypothesis that mitochondria translation plays an essential role in cell iron homeostasis through iron-sulfur complex synthesis.
We have visualized all the perturbation-responding module pairs identified in our experiments and show the results on the supplementary website. The data allow readers, particularly yeast biologists, to inspect the results and assess the quality of the modules, and more importantly, to explore new hypotheses regarding yeast signaling systems. In Figure 5, we show the subgraphs related to GO:0019236 (response to pheromone) and GO:0006826 (iron ion transport). In this figure, we show the perturbation instances (green hexagons) and responding modules (blue circles) in two tiers. Due to the fact that the connections between the perturbation and the responding module are very dense, which would interfere with visualization, we reversely indicate perturbation instances and responding genes that were NOT connected, shown as the red dash-lines in the figure. Using a graph-based algorithm (Lu et al.,, 2011), we further identified transcription factor (red triangles) modules that are likely responsible for the co-expression of the genes in the responding modules. Including TF information in data visualization further enhances interpretation of the subgraphs. For example, the fact that each responding module in this figure are connected (thus potentially regulated) by a TF module further strengthens the hypothesis that the genes are co-regulated together as a unit responding to a common signal.
Revealing organization of cellular signals
Our approach enabled us to use responding modules to reflect major signals in a cellular system and perturbation instances that affect these signals. We have found that many perturbation instances were involved in multiple perturbation-response subgraphs, indicating that the signal affected by such a perturbed instances was connected to multiple signals through cross-talks. This observation offered us an opportunity to further investigate the organization of cellular signals by studying what signals each perturbation instance affects, and how the signals are related to each other. For example, it is interesting to investigate whether a set of perturbation instances affects a common set of responding modules— that is, the information encoded by these genes is identical—so that we can group them as a signaling unit. Similarly, it is of interest to investigate whether the responding modules (signals) affected by one perturbed gene are a subset of those affected by another perturbed gene, and to utilize such a relationship to organize the signals. The latter task is closely related to that addressed by the nested effect model (Markowetz et al.,, 2007), which aims to capture the hierarchical relationship among perturbation instances based on the genes they affect. Since the nested effect model used an individual gene as a responding unit, the scale of the problem became intractable (exponential) and a Markov chain Monte Carlo algorithm was employed. In contrast, our approach used conceptualized responding modules, which provided two advantages: 1) the projection of high-dimensional data at the gene level to a low-dimensional and semantic-rich concept level reduces complexity of the task; 2) the unique annotation associated with each module renders the task of determining subset relationship among perturbation instances a trivial task. These characteristics enabled us to develop a polynomial algorithm (see Methods), to organize the perturbation instances into a (DAG). In such a graph, each node is comprised of a set of perturbation instances that share common responding modules, i.e., a signaling unit; an edge between a pair of nodes indicates that the signals affected by the parent node subsume those carried by the child node. We collected all perturbation modules that contained at least perturbation instances and organized perturbation instances into a DAG as shown in Figure 6.
Inspecting the perturbation nodes including multiple genes, we found that the genes in these nodes tend to participate in coherently related biological processes, and they often physically interact with each other at high frequencies (data not shown). For example, one perturbation node (highlighted with a blue border) in Figure 6 contains multiple STE (sterility) genes, a set of well-studied genes that mediates pheromone signaling in yeast, and they share common responding modules annotated with the functions “response to pheromone” (GO:0019236) and “sexual reproduction” (GO:0019953). Thus our method is capable of identifying perturbed instances whose information can be encoded using a one-bit signal—a switch affecting expression of the genes responding to pheromone signaling.
Visualization of the relationship of perturbation instances in a DAG enables a biologist to investigate how signals are combined to generate a cellular response. For example, there is a perturbation node (highlighted with a red border) in Figure 6 containing , , , and , all of which, except , are involved in MAPK activities. Our results show that there is a path connecting this node to the aforementioned STE node, and then further to the “respond to pheromone” responding module, indicating that the gene products of the two nodes work together to transmit signals in response to pheromone. Indeed, it is well known that MAPK activities are required in the pheromone signaling pathway (Gustin et al.,, 1998; Herskowitz,, 1995). Yet, our results clearly presented the fact that the MAPK node also carries information besides pheromone response, it also affects the biological processes of “proteolysis” (GO:0006508) process, for example.
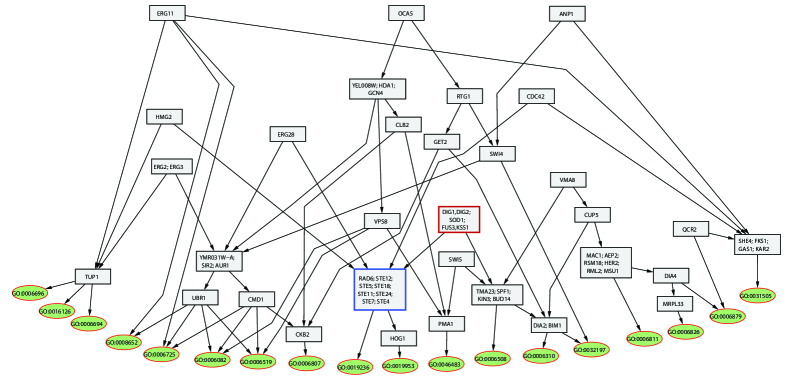
Another interesting observation is that the hierarchical organization of the perturbation instances reflects their relative position in a signaling cascade. For example, perturbation of ergosterol metabolism genes, ERG2, ERG3, HMG2, ERG11, and ERG28, tend to have a broad impact on different signals, including the pheromone response pathway. This is understandable: as a critical component of the plasma membrane, ergosterol influences the organizational compartments of the plasma membrane such as lipid rafts (Simon and Sampaio,, 2011), which in turn affect the organization of signaling molecules in the membrane. As such, perturbation of these genes has a broad impact on diverse cellular signals. Our results indicate that and are connected to the STE node to influence the expression of the pheromone responding module. The role of ergosterol metabolism in modulating pheromone response signaling has only recently been studied by Jin et al., (2008). More interestingly, our results indicate that perturbation of distinct enzymes of ergosterol metabolism leads to distinct cellular signals, presumably by perturbing the production of distinct species of ergosterols. The view that distinct lipid species encode/regulate disparate signals is widely accepted in the lipidomics research domain (Parks and Casey,, 1995).
Summary
In this study, we developed a proof of concept framework for unifying knowledge mining and data mining to conceptualize the findings from systematic perturbation experiments in order to enhance the capability of identifying signal transduction pathways. The innovations of our approach are reflected in the following aspects: 1) an ontology-driven approach for identifying functional modules from a genes list in a dynamic and data-driven (instance-based) manner and projecting molecular finding to a conceptual level, 2) innovative formulation of the biclustering problem in terms of a constrained search space and new objective functions, and 3) a novel graph algorithm that enables organizing signaling molecules at a system level in a tractable manner for the first time. We have demonstrated that conceptualization of cellular responses to systematic perturbations enhances the capability of identifying perturbation instances that participate in specific signal transduction pathways. To the best of our knowledge, this is the first report of a computational framework capable of automatically assimilating the information from systematic perturbation data to reveal the architecture of a cellular signaling system at a conceptual level that can be readily interpreted by biologists to gain insights of a system.
More importantly, conceptualization of experimental results is a critical step towards the ultimate goal of systems biology—acquiring computable knowledge from experimental data for reasoning and hypothesis generation. Our results already laid the foundation to derive abstract knowledge. For example, one can translate a path from a perturbation node to a responding module in Figure 6 into a rule as follows: “if genes involved in MAPK signaling are perturbed, genes involved in pheromone responses will be differentially expressed”. A rule like this represents the relationships between perturbed genes and responding genes at a conceptual level. Equipped with rules and facts, a computing agent can then make a prediction that perturbation of a newly discovered gene may lead to the differential expression of genes involved pheromone responses, if the gene is found to be involved in MAPK signaling. Ongoing research is devoted to acquiring and representing facts, assertions and rules from systems biology data in an accurate and generalizable manner.
| Algorithm-1 HDSubgraph | ||||
| Input: – a bipartite graph, – the connectivity ratio of the subgraph, | ||||
| and – the minimum number of perturbations in the solution. | ||||
| Output: A highly dense subgraph | ||||
| 1. ; ; | ||||
| 2. for each subset of size in do | ||||
| 3. | ; ; ; | |||
| 4. | while do | |||
| 5. | ; ; ; | |||
| 6. | for each do | |||
| 7. | ; and connects to at least | |||
| vertices in }; | ||||
| 8. | Calculate the score of induced subgraph | |||
| and save the score to ; | ||||
| 9. | if then | |||
| 10. | ; ; | |||
| 11. | if then | |||
| 12. | ; ; ; | |||
| 13. | Assign of to ; ; | |||
| 14. return ; | ||||
| Note: 1. . When a new node is added, | ||||
| there is a score gain if the degree of in is at least ; else a penalty will be applied. | ||||
| 2. The is smaller than or equal to the minimum number of perturbations in the solution. The growth | ||||
| of will greatly increase the running time of the algorithm. |
Materials and Methods
The microarray data from the systematic perturbation experiments by Hughes et al., (2000) were collected, and differentially expressed genes responding to each perturbation were identified based the analysis of the original paper. Given a list of differentially expressed genes responding to a perturbation instance, we represent the genes and their annotations using a data structure referred to as GOGene graph (Muller et al.,, 2009). In such a graph, a node represents a GO term and a directed edge between a pair of nodes reflects an ”is-a” relationship between the GO terms; in addition, each node keeps track of the genes it annotates, therefore the graph contains information on both GO terms and genes. The procedure for searching for summarizing GO terms iterates through the following steps: 1) perform an enrichment analysis (Khatri et al.,, 2005) for each leaf GO term among the instance-specific responding genes; 2) select the GO term with the biggest p-value (least enriched) and merge its genes to the parent node with the shortest semantic distance as defined by Jin et al (Jin et al.,, 2010); 3) trim the term off the graph; 4) repeat the above procedures. We stop trimming a GO term once it is significantly enriched (p-value 0.05) and the genes summarized by the term remained functionally coherent (Richards et al.,, 2010), and its associated genes are treated as a functionally coherent module; otherwise all non-significant terms would eventually be merged to the root node of the GO hierarchy and their associated genes are deemed as not coherently related.
To assess the functional coherence, we applied the method developed by Richards et al., (2010). In this approach, the ontology structure of the GO is represented as a weighted graph, in which an edge weight represents the semantic distances between a pair of GO terms. When given a list of genes, the genes are associated to their annotation GO terms and a Steiner tree connecting all genes is identified. Using the total length of the Steiner tree as a score reflecting the functional relatedness of the genes, a statistical model is applied to assess the probability of observing such a score if sets with the same size are randomly drawn from yeast genome. See Richards et al., (2010) for details.
To search for a densely connected perturbation-responding subgraph in a bipartite graph, we formulated the task as follows: given a bipartite graph , find a subgraph of that satisfies the following conditions: 1) , where is a user defined threshold for cluster size; 2) each vertex in connects to at least vertices in , and each vertex in connects to at least vertices in , where the parameter is a connectivity ratio defined by users; and 3) the size of the subgraph ( ) is maximized. We set the parameters as follows: and . The algorithms for searching for the subgraph is shown in Figure 7.
| Algorithm organizing signaling components | |||
| Input: A set of perturbation-responding subgraphs represented as a dictionary , in which a key is | |||
| a perturbation instance and its value is a list of the responding modules (RMs) it connects | |||
| Output: A DAG organization of perturbation instances and RMs | |||
| # Create a DAG consisting of perturbation instances and RMs | |||
| 1. Create an empty graph ; | |||
| 2. Add all RMs to as RM nodes; | |||
| 3. Combine perturbation instances that connect to an identical set of RMs | |||
| into a joint perturbation node; add all resulting perturbation nodes into ; | |||
| 4. Add directed edges between perturbation nodes and RM nodes as specified in | |||
| 5. Add directed edges between a pair of perturbation nodes, and , | |||
| if the set of RMs associated with is a subset of that associated with ; | |||
| #Simplify the DAG | |||
| 6. for each node do | |||
| 6.1. | for each node that is a descendent of node do | ||
| 6.2. | if has a parent node that is a descendant of then | ||
| 6.3. | Remove edge ; | ||
| 7. return ; |
To organize perturbation instances based on their signals, we developed an algorithm to organize the perturbed instances into a DAG. In such a graph, there are two types of nodes: responding module nodes and perturbation nodes. Our algorithm groups perturbation instances that share identical responding modules into a common perturbation node, a signaling unit, and connect the perturbation node to its corresponding responding modules. The algorithm further organizes perturbation nodes such that, if signals by a perturbation node subsume those of another, a directed edge pointing to the subsumed node is added between them. The algorithm is shown in Figure 8.
Acknowledgement
The authors would like to thank Ms Vicky Chen and Joyeeta Dutta-Moscato for reading and editing manuscript, and Drs. Nabil Matmati and David Montefusco for discussions.
Funding:
This research was partially supported by the following NIH grants: R01LM011155 and R01LM010144.
Author Contribution
XL conceived the project; SL performed the majority of the analyses; BJ contributed to the methods of knowledge mining; LAC helped with biological interpretation of results; XL, SL and LAC drafted the manuscript.
References
- Ashburner et al., (2000) Ashburner M, Ball CA, Blake JA, Botstein D, Butler H, Cherry JM, Davis AP, Dolinski K, Dwight SS, Eppig JT, Harris MA, Hill DP, Issel-Tarver L, Kasarskis A, Lewis S, Matese JC, Richardson JE, Ringwald M, Rubin GM, Sherlock G. (2000) Gene ontology: tool for the unification of biology. Nature Genetics 25: 25-29.
- Bjölund et al., (2006) Björklund A, Husfeldt T, Koivisto M (2006) Set partitioning via Inclusion-Exclusion. SIAM Journal on Computing 39: 546-563.
- Cheng et al., (2000) Cheng Y, Church GM (2000) Biclustering of Expression Data. Proceedings of Pacific Symposium on Biocomputing.
- Colak et al., (2010) Colak R, Moser F, Chu JS, Schönhuth A, Chen N, Ester M (2010) Module Discovery by Exhaustive Search for Densely Connected, Co-Expressed Regions in Biomolecular Interaction Networks. PLoS ONE 5: e13348.
- Cover and Thomas, (2006) Cover, TM. and Thomas JA.. (2006) Elements of Information Theory. 2nd Ed., John Wiley and Sons
- Daignan-Fornier et al., (1992) Daignan-Fornier B, Fink GR (1992) Coregulation of purine and histidine biosynthesis by the transcriptional activators BAS1 and BAS2. Proceedings of National Academy of Sciences USA 89: 6746-6750.
- Denis et al., (1998) Denis V, Boucherie H, Monribot C, Daignan-Fornier B (1998) Role of the Myb-like protein Bas1p in Saccharomyces cerevisiae: a proteome analysis. Molecular Microbiology 30: 557-566.
- Erten et al., (2010) Erten C, Soz̈dinler M (2010) Improving performances of suboptimal greedy iterative biclustering heuristics via localization. Bioinformatics 26: 2594-2600.
- Garnett et al., (2012) Garnett MJ, Edelman EJ, Heidorn SJ, Greenman CD, Dastur A, Lau KW, Greninger P, Thompson IR, Luo X, Soares J, Liu Q, Iorio F, Surdez D, Chen L, Milano RJ, Bignell GR, Tam AT, Davies H, Stevenson JA, Barthorpe S, Lutz SR, Kogera F, Lawrence K, McLaren-Douglas A, Mitropoulos X, Mironenko T, Thi H, Richardson L, Zhou W, Jewitt F, Zhang T, O’Brien P, Boisvert JL, Price S, Hur W, Yang W, Deng X, Butler A, Choi HG, Chang JW, Baselga J, Stamenkovic I, Engelman JA, Sharma SV, Delattre O, Saez-Rodriguez J, Gray NS, Settleman J, Futreal PA, Haber DA, Stratton MR, Ramaswamy S, McDermott U, and Benes CH. (2012) Systematic identification of genomic markers of drug sensitivity in cancer cells. Nature 483:570-5
- Gustin et al., (1998) Gustin MC, Albertyn J, Alexander M, Davenport K (1998) MAP Kinase Pathway in the Yeast Saccharomyces cerevisiae. Microbilogy and Molecular Biology Reviews 62: 1264-1300.
- Harbison et al., (2004) Harbison CT, Gordon DB, Lee TI, Rinaldi NJ, Macisaac KD, Danford TW, Hannett NM, Tagne J, Reynolds DB, Yoo J, Jennings EG, Zeitlinger J, Pokholok DK, Kellis M, Rolfe PA, Takusagawa KT, Lander ES, Gifford DK, Fraenkel E, Young RA (2004) Transcriptioanl regulatory code of a eukaryotic genome. Nature 431: 99-104.
- Hausmann et al., (2008) Hausmann A, Samans B, Lill R, Muḧlenhoff U (2008) Cellular and mitochondrial remodeling upon defects in iron-sulfur protein biogenesis. J. Biol. Chem. 283: 8318-8330.
- Herskowitz, (1995) Herskowitz, I,. (1995) MAP kinase pathways in yeast: For mating and more. Cell, 80: 187-197
- Hua et al., (2009) Hua Q, Yu D, Lau FC, Wang Y (2009) Exact Algorithms for Set Multicover and Multiset Multicover Problems. Lecture Note in Computer Science, ISSAC 2009: 34-44.
- Huang et al., (2009) Huang SC, Fraenkel E (2009) Integrating Proteomic and Transcriptional and Interactome Data Reveals Hidden Components of signaling and Regulatory Networks. Science Signaling 2: Ra40.
- Hughes et al., (2000) Hughes TR, Marton MJ, Jones AR, Roberts CJ, Stoughton R, Armour CD, Bennett HA, Coffey E, Dai H, He YD, Kidd MJ, King AM, Meyer MR, Slade D, Lum PY, Stepaniants SB, Shoemaker DD, Gachotte D, Chakraburtty K, Simon J, Bard M, Friend SH. (2000) Functional Discovery via a Compendium of Expression Profiles. Cell 102: 109-126.
- Jin et al., (2010) Jin B, Lu X (2010) Identifying informative subsets of the Gene Ontology with information bottleneck methods. Bioinformatics 26: 2445-2451.
- Jin et al., (2008) Jin H, McCaffery JM, Grote E (2008) Ergosterol promotes pheromone signaling and plasma membrane fusion in mating yeast. J Cell Biol 180: 813-826.
- Khatri et al., (2005) Khatri P, Draghici S (2005) Ontological analysis of gene expression data: current tools, limitations,and open problems. Bioinformatics 21: 3587-3595.
- Kanehisa et al., (2012) Kanehisa, M., Goto, S., Sato, Y., Furumichi, M., and Tanabe, M.; KEGG for integration and interpretation of large-scale molecular datasets. Nucleic Acids Res 40:D109-D114 .
- Lamb et al., (2006) Lamb, J, Crawford, ED., Peck,D., Modell, JW., Blat, IC., Wrobel,MJ., Lerner, J,Brunet, JP., Subramanian, A., Ross, KN., Reich, M., Hieronymus, H., Wei, G., Armstrong, SA., Haggarty, SJ., Clemons, PA., Wei, R., Carr, SA., Lander, ES., and Golub TR.. (2006) The Connectivity Map: Using Gene-Expression Signatures to Connect Small Molecules, Genes, and Disease. Science 313:1929-1935
- Lill et al., (2000) Lill R, Kispal G (2000) Maturation of cellular Fe-S proteins: an essential function of mitochondria. Trends Biochem. Sci. 25: 352-356.
- Lu et al., (2011) Lu S, Lu X (2011) Using graph model to find transcription factor modules: the hitting set problem and an exact algorithm. Algorithms for Molecular Biology 8: 2.
- Maclsaac et al., (2006) MacIsaac KD, Wang T, Gordon DB, Gifford DK, Stormo GD, Fraenkel E (2006) An imporved map of conserved regularoty sites for Saccharomyces cerevisiae. BMC Bioinformatics 7: 113.
- Madeira et al., (2004) Madeira SC, Oliveira AL (2004) Biclustering algorithms for biological data analysis: a survey. IEEE Transaction on Computational Biology and Bioinformatics 1: 24-45.
- Markowetz et al., (2007) Markowetz F, Kostka D, Troyanskaya OG, Spang R (2007) Nested effects models for high-dimensional phenotyping screens. Bioinformatics 23: i305.
- Mewes et al., (2011) Mewes HW, Ruepp A, Theis F, Rattei T, Walter M, Frishman D, Suhre K, Spannagl M, Mayer KF, Stmpflen V, Antonov A (2011) MIPS: curated databases and comprehensive secondary data resources in 2010. Nuc. Acids Res. 39: D220-D224.
- Muller et al., (2009) Muller B, Richards AJ, Jin B, Lu X (2009) GOGrapher: A Python library for GO graph representation and analysis. BMC Research Notes 2: 122.
- Ourfali et al., (2007) Ourfali O, Shlomi T, Ideker T, Ruppin E, Sharan R (2007) SPINE: a framework for signaling-regulatory pathway inference from cause-effect experiments. Bioinformatics 23: i359-i366.
- Parks and Casey, (1995) Parks LW, Casey WM (1995) Physiological implications of sterol biosynthesis in yeast. Annu Rev Microbiol 49: 95-116.
- Pinson et al., (2000) Pinson B , Kongsrud TL , Ording E , Johansen L , Daignan-Fornier B , Gabrielsen OS (2000) signaling through regulated transcription factor interaction: mapping of a regulatory interaction domain in the Myb-related Bas1p. Nucleic Acids Research 28: 4665-4673.
- Richards et al., (2010) Richards AJ, Muller B, Shotwell M, Cowart LA, Rohrer B, Lu X, (2010) Assessing the functional coherence of gene sets with metrics based on the Gene Ontology graph. Bioinformatics 26: i79-i87.
- Rutherford et al., (2005) Rutherford JC, Ojeda L, Balk J, Muḧlenhoff U, Lill R, Winge DR (2005) Activation of the iron regulon by the yeast Aft1/Aft2 transcription factors depends on mitochondrial but not cytosolic iron-sulfur protein biogenesis. J. Biol. Chem. 280: 10135-10140.
- Segal et al., (2004) Segal E, Friedman N, Koller D, Regev A (2004) A module map showing conditional activity of expression modules in cancer. Nature Genetics. 39: 1090
- Simon and Sampaio, (2011) Simons, K and Sampaio, JL., (2011) Membrane organization and lipid rafts. Cold Spring Harb Perspect Biol. 3:a004697
- Stark et al., (2010) Stark C, Breitkreutz BJ, Chatr-Aryamontri A, Boucher L, Oughtred R, Livstone MS, Nixon J, Van Auken K, Wang X, Shi X, Reguly T, Rust JM, Winter A, Dolinski K, Tyers M (2010) The BioGRID Interaction Database. Nuc. Acids Res. 36: D698-D704.
- Stratton et al., (2009) Stratton MR, Campbell PJ, Futreal PA (2009) The cancer genome. Nature 458: 719-724.
- Subramanian et al., (2005) Subramanian A, Tamayo P, Mootha VK, Mukherjee S, Ebert BL, Gillette MA, Paulovich A, Pomeroy SL, Golub TR, Lander ES, Mesirov JP (2005) A Gene set enrichment analysis: A knowledge-based approach for interpreting genome-wide expression profiles. Proc Natl Acad Sci USA 102: 15545-50.
- Tanay et al., (2002) Tanay A, Sharan R, Shamir R (2002) Discovering statistically significant biclusters in gene expression data. Bioinformatics 18: S136-S144.
- Widmann et al., (1999) Widmann C, Gibson S, Jarpe MB, Johnson GL (1999) Mitogen-activated protein kinase: conservation of a three-kinase module from yeast to human. Physiol Rev 79:143-80.
- Winzeler et al., (1999) Winzeler EA, Shoemaker DD, Astromoff A, Liang H, Anderson K, Andre B, Bangham R, Benito R, Boeke JD, Bussey H, Chu AM, Connelly C, Davis K, Dietrich F, Dow SW, El Bakkoury M, Foury F, Friend SH, Gentalen E, Giaever G, Hegemann JH, Jones T, Laub M, Liao H, Liebundguth N, Lockhart DJ, Lucau-Danila A, Lussier M, M’Rabet N, Menard P, Mittmann M, Pai C, Rebischung C, Revuelta JL, Riles L, Roberts CJ, Ross-MacDonald P, Scherens B, Snyder M, Sookhai-Mahadeo S, Storms RK, Véronneau S, Voet M, Volckaert G, Ward TR, Wysocki R, Yen GS, Yu K, Zimmermann K, Philippsen P, Johnston M, Davis RW. (1999) Functional characterization of the S. cerevisiae genome by gene deletion and parallel analysis. Science 181:3058-68
- Yamaguchi-Iwai et al., (1996) Yamaguchi-Iwai Y, Stearman R, Dancis A, Klausner RD (1996) Iron-regulated DNA binding by the AFT1 protein controls the iron regulon in yeast. EMBO. J. 14: 1231-1239.
- Yeger-Lotem et al., (2009) Yeger-Lotem E, Riva L, Su LJ, Gitler AD, Cashikar AG, King OD, Auluck PK, Geddie ML, Valastyan JS, Karger DR, Lindquist S, Fraenkel E (2009) Bridging high-throughput genetic and transcriptional data revaels cellular responses to alpha-synuclein toxicity. Nature Genetics 41: 316-323.
- Muller et al., (20) Zhou Q, and Wong WH (2004) CisModule: de novo discovery of cis-regulatory modules by hierarchical mixture modeling. Proc. Natl. Acad. Sci. USA 101: 12114-12119.