Phase-resolved ultraviolet spectroscopy of the magnetic Of?p star HD 191612
Abstract
We present for the first time phase-resolved UV spectroscopy of an Of?p star, namely, HD 191612. The observations were acquired with the Space Telescope Imaging Spectrograph (STIS) on-board the Hubble Space Telescope (HST). We report the variability observed in the main photospheric and wind features and compare the results with previous findings for the Of?p star HD 108. We show that UV line strengths, H, and longitudinal magnetic field, vary coherently according to the rotational period (Prot = 537.6d), providing additional support for the magnetic oblique rotator scenario. The stellar and wind parameters of HD 191612 are obtained based on NLTE expanding atmosphere models. The peculiar wind line profile variations revealed by the new STIS data - not reproduced by 1D atmosphere models - are addressed through non-spherical MHD simulations coupled with radiative transfer. The basic aspects of the UV variability observed are explained and the structure of the dynamical magnetosphere of HD 191612 is discussed.
keywords:
stars: winds – stars: atmospheres – stars: massive – stars: magnetic fields.1 INTRODUCTION
The peculiar Of?p stars have been studied in detail in the optical part of the spectrum, with observations spanning several decades for HD 108 and HD 191612 (e.g., Walborn 1973; Nazé et al. 2010). Large-amplitude variability of optical features (e.g., of H and He I lines) is found to be common for this spectral class (Nazé, Vreux & Rauw 2001; Howarth et al. 2007), and is characterized by ‘high’ and ‘low’ (or maximum/minimum) states in the degree of emission. This behaviour is now understood in the context of a magnetic oblique rotator model, wherein the observer’s view of a magnetically constrained stellar-wind outflow is modulated by stellar rotation (see Donati et al. 2006; Wade et al. 2011; Sundqvist et al. 2012).
Despite advances in understanding the nature of Of?p stars, the behavior of the ultraviolet (UV) spectra at different optical states remains poorly known. Such information is crucially important, since this spectral region contains the most sensitive diagnostics of hot-star winds. We therefore lack, so far, a complete view of the stellar-wind confinement phenomenon (ud-Doula & Owocki 2002) in these stars. A first effort to address this problem was recently reported by our group for the very slow rotator HD 108 (Marcolino et al. 2012; hereinafter Paper I). New observations in the ultraviolet were acquired close to the optical minimum state; the UV spectrum did show changes compared to International Ultraviolet Explorer (IUE) observations acquired during a high state, but the variability was not as dramatic as observed in the optical. Marcolino et al. (2012) concluded that the stellar wind of HD 108 is not severely affected by the magnetic field on a global scale (i.e., at large radii; see Paper I for details). However, because of the long rotational period of HD 108 (probably about 55 years; Nazé, Vreux & Rauw 2001; Nazé et al. 2010), we still lacked information about UV line profiles at various rotational phases. Thus, until now, we have not had a detailed knowledge of UV variability matching that in the optical, for any Of?p star.
In this paper we present high-resolution UV spectroscopy of HD 191612111HD 191612 is a known double-lined spectroscopic binary, with d (Howarth et al. 2007). ( d; Howarth et al. 2007), which represents the first phase-resolved UV spectra of an Of?p star covering the entire rotational cycle. The observations are described in Section 2, where we also summarize the variability observed in the main photospheric and wind features and compare the results with our previous findings for HD 108. We demonstrate that the strengths of the main UV wind lines, H, and longitudinal magnetic field (), vary coherently according to the rotational period, thereby providing support for an origin linked to the magnetic oblique rotator model. The stellar and wind parameters of HD 191612 are then revised and discussed based on UV modelling using non-LTE expanding-atmosphere models (Section 3). The peculiar variability revealed by the new STIS data is not reproduced by 1D models, but can be explained qualitatively by using magnetohydrodynamical (MHD) simulations of a magnetically confined wind (Section 4). Section 5 summarizes the main results of our work and discuss their consequences for the Of?p class as a whole.
2 OBSERVATIONS
We used the Space Telescope Imaging Spectrograph (STIS) on board HST to obtain ultraviolet spectra of HD 191612 (PI. Bouret; program ID 12179). Table LABEL:obsdetails provides a log of the observations, which were obtained at four phases separated by a quarter of the star’s 537.6d rotational cycle. At each phase, the observations consisted of two pairs of exposures through the small () aperture, first with the E140M echelle grating and then with the E230M echelle grating.
Observations with the E140M grating were centered at 1425 Å and recorded by the FUV MAMA detector, while observations with the E230M grating were centered at 2707 Å and recorded by the NUV MAMA detector. The total wavelength coverage is 1150 – 1750 Å (E140M) and 2250 – 3100 Å (E230M), with resolving powers R = 45,800 and 30,000, respectively. The modified Julian Dates (MJD) of the mid-exposures are listed in Table LABEL:obsdetails, along with the total integration time (divided equally between the two exposures). Since the two exposures obtained with each configuration were combined, the mid-point of the sequence was used to calculate the phase according to the ephemeris published by Howarth et al. (2007). Due to the very long stellar variability period, the NUV/FUV exposure pairs correspond to essentially identical phases (to within a few 10-5 cycles).
2.1 Observed variability characteristics
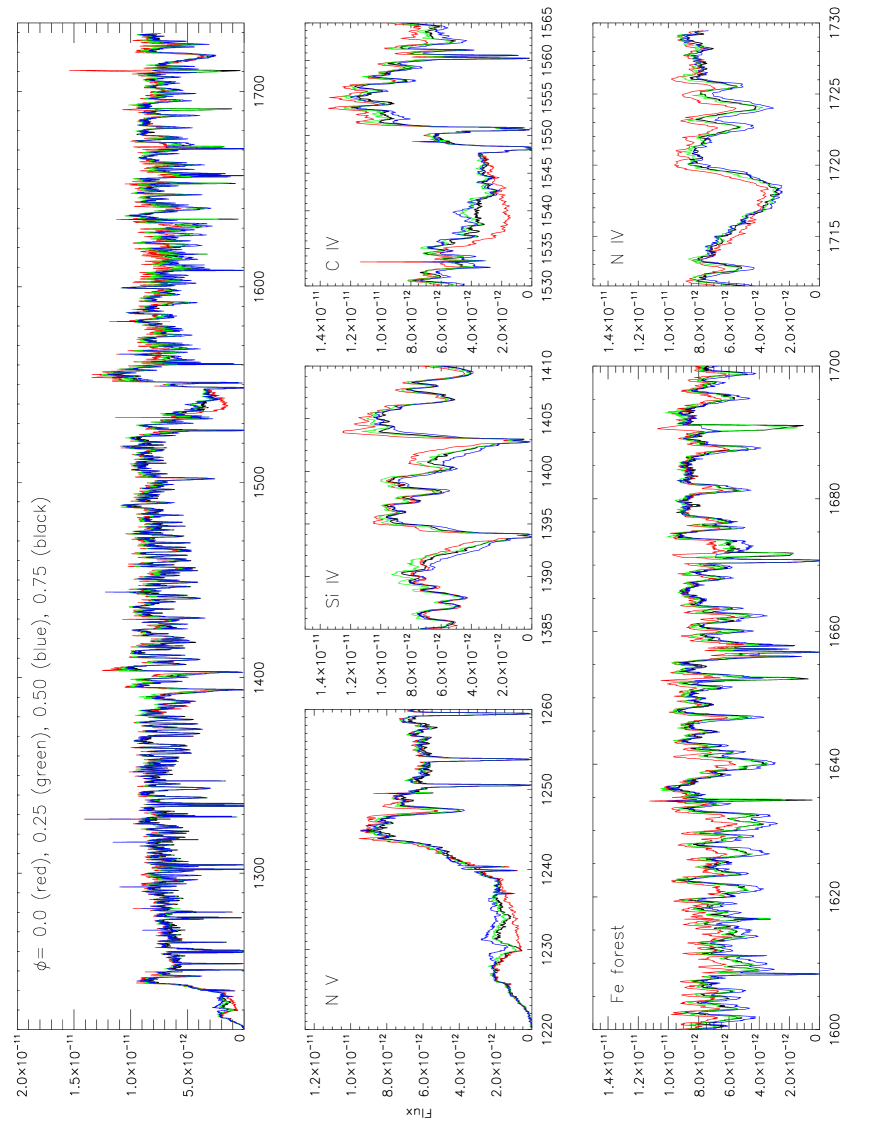
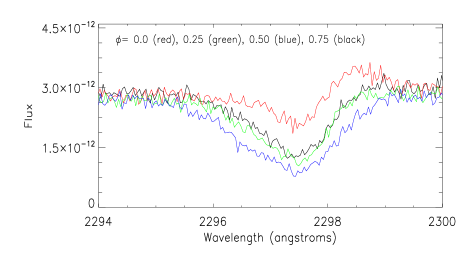
In Figure 1 we present the spectra of HD 191612 obtained at different rotational phases. In this section we focus mainly on FUV data, where we find the main stellar wind diagnostics (N v 1240, Si iv 1400, C iv 1550, and N iv 1718) and the iron “forest”. Data obtained in the NUV region reveal fewer lines which are mostly in absorption. The most prominent is C iii 2296, which we present in Figure 2.
| Grating | Date (UT) | MJD (mid) | exp. time | Phase |
|---|---|---|---|---|
| E140M | 2010-08-23 | 55431.089 | 1500 | 0.751 |
| E230M | 2010-08-23 | 55431.104 | 300 | 0.751 |
| E140M | 2011-01-04 | 55565.294 | 1500 | 0.000 |
| E230M | 2011-01-04 | 55565.310 | 300 | 0.000 |
| E140M | 2011-05-18 | 55699.291 | 1500 | 0.250 |
| E230M | 2011-05-18 | 55699.303 | 300 | 0.250 |
| E140M | 2011-09-30 | 55834.512 | 1500 | 0.501 |
| E230M | 2011-09-30 | 55834.527 | 300 | 0.501 |
There is significant line-profile variability at a level which exceeds that normally found in O-star spectra222Many O stars are known to exhibit resonance-line variability in the form of discrete absorption components (DACs); see, e.g., Kaper et al. (1996). DACs are localized optical depth enhancements that propagate through P-Cygni absorption troughs from red to blue on a timescale of typically days, becoming narrower as they approach the terminal velocity. The variations seen here are fundamentally different in character, insofar as the change in absorption depth occurs over the entire width of the line profile., although the amplitudes are nonetheless modest compared to the substantial changes reported in the optical spectrum (see, for example, Fig. 5 of Walborn et al. 2003). The main changes are observed in the absorption troughs of the N v 1240 and C iv 1550 P Cygni profiles, together with the high-velocity part of N iv 1718, which are all stronger at (the ‘high state’) than at other phases, while the (essentially photospheric) iron-forest absorption weakens at this phase (Figure 1). In contrast, both Si iv 1400 and C iii 2296 are weaker at (see Figure 2). The C iii 1176 multiplet (not shown) is very weak compared to these two features but follows the same trend. This behaviour is related to subtle magnetic field effects on the wind and is discussed more in detail in Section 4.
The Of?p star HD 108 also exhibits greater wind absorption in C iv and N v and weaker absorption in the iron forest during the high state. However, there are important differences between the two stars. For example, in HD 191612 (unlike HD 108) the C iv and N v wind profiles never become saturated, regardless of the phase. Moreover, in HD 191612 (again, unlike HD 108) the Si iv 1400 behaves in the opposite way to C iv and N v, the absorption being strongest at phase 0.5. Such differences may be related to the different stellar and magnetic properties of these stars. Different mass-loss rates, magnetic obliquity, and hence viewing angle may all affect the observed line profile variations.
Table LABEL:linebehavior summarizes this discussion of the relative variability of the main UV features of HD 108 and HD 191612. Note that the analysis of the C iii lines in HD 108 is hindered by the very low signal-to-noise of the IUE observations available.

2.2 Equivalent width measurements
To quantify the variability, we measured equivalent widths for the main UV lines, using fixed wavelength intervals for each feature (e.g., 1534.0-1551.3Å for C iv and 1390.2-1395.0Å for Si iv). In Fig. 3 we present the results for C iv and Si iv, along with H equivalent widths and the longitudinal magnetic-field values, (from Howarth et al. 2007; Wade et al. 2011). Maximum C iv 1550 and minimum Si iv 1400 absorptions occur at , which coincides with maximum H emission. The UV iron-forest strength (not shown), as well as other UV profiles (e.g. N v 1240 and C iii 2296), also follows the rotational variability, along with photometry from Hipparcos (Walborn et al. 2004). In summary, the UV profiles of HD 191612 vary in concert with other measurements: the UV variability follows the established 537.6-d period and results from rotational modulation.
The oblique rotator model was proposed for HD 191612 by Donati et al. (2006), with details subsequently refined by Howarth et al. (2007) and Wade et al. (2011). The currently accepted model has a (rotational) axial inclination of , a centred dipole magnetic field with an obliquity of , and a polar strength of 2.5kG. With this geometry, the line of sight is almost aligned with the dipole axis at rotational phase , and almost perpendicular to it at . In such a scenario, we expect enhanced density and slower velocities in the region of the magnetic equator, which is fed by magnetically deflected outflows from the polar and temperate latitudes (ud-Doula & Owocki 2002). Thus, a priori, the net effect expected for a wind profile at is less absorption at high velocities, as exhibited, e.g., by C iv 1550 and N v 1240. At a first glance, the Si iv 1400 profile (and C iv 2296) seems to contradict this idea. We come back to this question later in Section 4, where we show that effects from a dynamical magnetosphere may solve this puzzle.
| Feature | HD 191612 | HD 108 |
|---|---|---|
| N v 1240 | +abs | +abs |
| C iv 1550 | +abs | +abs |
| N iv 1718 | +abs | +abs |
| Fe iv forest | abs | abs |
| C iii 1176 | -abs | ? |
| Si iv 1400 | -abs | +abs |
| C iii 2296 | -abs | ? |
3 ATMOSPHERE MODELS
For the oblique-rotator configuration described above, spherical symmetry is clearly a very poor approximation for lines principally formed inside the Alfvén radius; it is precisely this lack of spherical symmetry (coupled with fortuitous viewing geometry) that generates the strong rotational modulation observed in H and some optical helium lines. This conclusion is strengthened by the success that Sundqvist et al. (2012) had in reproducing the observed variability of H by using the structure of a magnetically confined wind predicted by MHD models.
Sundqvist et al. (2012) coupled their MHD models to relatively simple radiative-transfer calculations appropriate to H line formation. However, this work has not yet progressed to the point where fully self-consistent modelling of all UV lines is possible (see however Section 4). In order to obtain a quantitative characterization of our STIS data, we therefore first turn to the other extreme of spectral modelling, embodied in the CMFGEN code (Hillier & Miller 1998). This code solves the equation of radiative transfer with considerable attention to the microphysics (line blanketing, NLTE, radiative and statistical equilibria), but with simplified – normally spherical – symmetry.
While spherical symmetry is obviously a poor assumption for lines formed in the vicinity of the Alfvén radius, we might expect that features formed in or close to the photosphere, such as the iron forest, can reasonably be modelled under this approximation. Furthermore, because the magnetic dipole energy density falls much faster with radial distance than does the wind kinetic energy density ( vs. ), the stellar-wind outflow must become essentially radial at large distances. With some caution, we may therefore investigate lines formed at large radii – such as the high-velocity parts of UV P Cygni profiles – under the simplifying assumption of spherical symmetry.
In order to further avoid non-spherical effects, we focused on the analysis of STIS data at phase , when the magnetic pole is oriented towards the observer (see Fig. 3). At this configuration, the line-of-sight absorption column will consist mostly of wind plasma streaming from the open field lines above the magnetic pole, which presumably then leads to a reduced influence of the dense, confined wind material concentrated near the magnetic equator. Thus, for UV wind lines, a spherically symmetric model should be a better approximation in the high state.
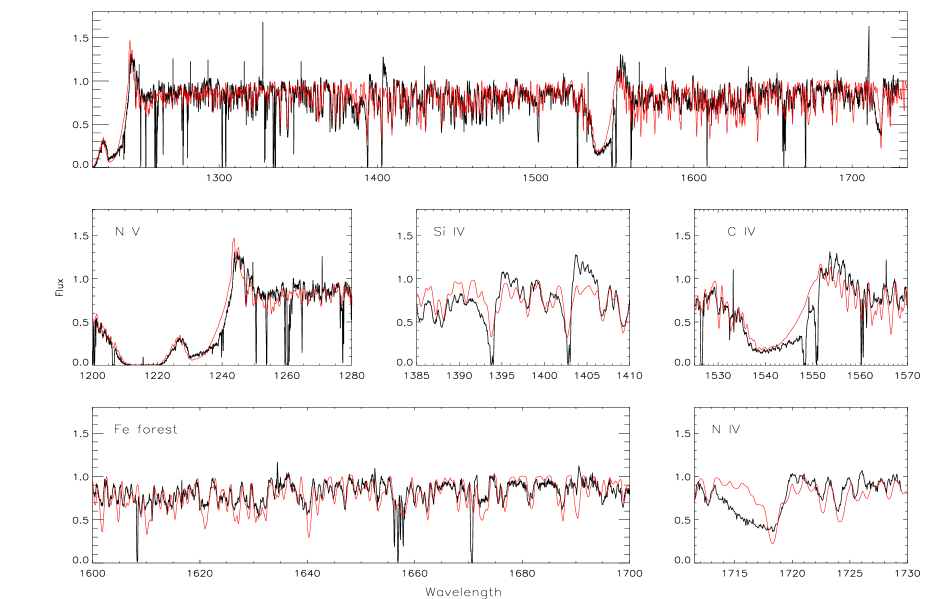
In Table 3 we summarize the stellar and wind properties inferred. Our final model is compared in Figure 4 with normalized STIS spectra. The effects of clumping were accommodated with a filling-factor formalism (), beginning at an expansion velocity of 30 km s-1 (); we also allowed for the the effects of X-rays produced by wind instabilities, adopting (Nazé et al. 2010).
Below we discuss other parameters and the issues found during the analysis.
3.1 Chemical composition, rotation and macroturbulence
Following Howarth et al. (2007), we adopted a macroturbulent velocity km s-1 and projected equatorial rotation velocity of zero. We note, however, that the UV observations are equally well matched by any model having
We used the solar chemical composition (Grevesse et al. 2010), except for nitrogen. The nitrogen content in HD 191612 was recently determined by Martins et al. (2011) based on the analysis of photospheric lines in high-resolution optical data. Here, we use their results, which fix N/H at (the solar value is ; by number).
| T eff (K) | 36000 2000 |
|---|---|
| log (cgs) | 3.75 0.20 |
| log L⋆/L⊙ | 5.45 0.10 |
| R⋆/R⊙ | 13.7 |
| M⋆/M⊙ | 39 |
| (km s-1) | 0 |
| (km s-1) | 45 |
| (km s-1) | 15 |
| Prot (days) | 537.6 |
| log | -7.9 0.3 |
| v∞ (km s-1) | 2400 500 |
| fcl | 0.1 |
| vcl (km s-1) | 30 |
| log | -6.1 |
| distance (pc) | 2300 |
3.2 Luminosity and distance
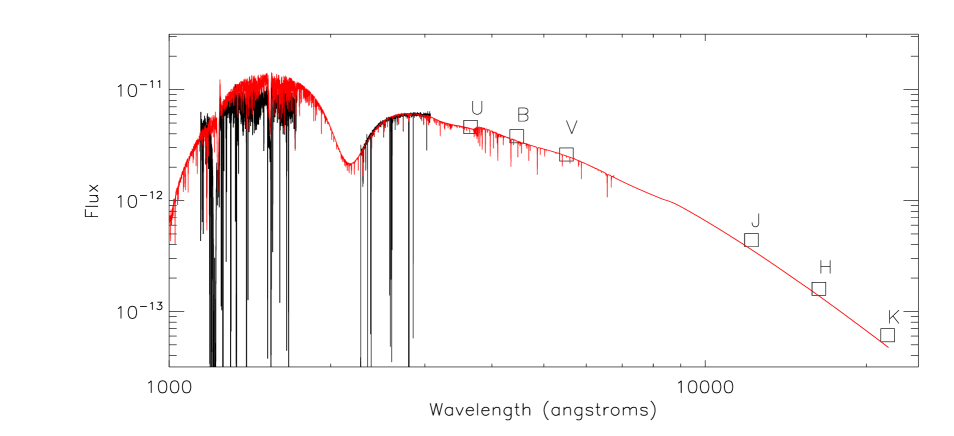
HD 191612 is probably a member of the Cyg OB3 association, at a distance of 2.3 kpc (Humphreys 1978). Adopting this distance, we estimate the luminosity from a fit to the FUV and NUV spectra plus UBVJHK magnitudes available in the Galactic O-Star Catalog (Sota et al. 2008). The results are included in Table 3, and the fit displayed in Fig. 5. The differential extinction was estimated from the observed and the typical intrinsic value for O6–O8 stars, (Martins & Plez 2006).
We note that HD 191612 is known to be photometrically variable, but the amplitude is too small to affect these results significantly; e.g., the magnitude varies by not more than 0.05. We also neglect the contribution of the early-B secondary. Such a star is much cooler (20kK) and fainter than the primary and is expected to contribute only about 10 per cent in the visible, and considerably less at UV wavelengths (see Howarth et al. 2007).
3.3 Issues
From Fig. 4 we see that the agreement between our atmosphere model and the STIS data of HD 191612 at phase is reasonable. We predict P Cygni profiles for N v 1240 and C iv 1550, a good fit for the iron forest, and absorption/incipient P Cygni profiles to Si iv 1400 and N iv 1718, as observed. However, it is evident that some features could not be reproduced in detail. For example, the synthetic N iv 1718 profile lacks blueshifted absorption. By increasing the N/H ratio to we improve the fit to the observed profile, but this value is much higher than that reported by Martins et al. (2012), even considering the uncertainties in the determination. We have also tried several ways to improve the fit to the Si iv 1400 feature (see Fig. 4), although a comparison is handicapped by interstellar absorption.
Some discrepancies were already expected in our analysis, since we used spherically symmetric atmosphere models. As discussed previously, lines formed closer to the Alfvén radius may be significantly affected by non-sphericity. Ideally, MHD wind-confinement simulations coupled with detailed 3D radiative-transfer calculations should be used to derive the stellar and wind properties of HD 191612. However, given the complexity of such a task, the calculation of a full UV and optical theoretical spectrum – as is done by 1D models – is not currently feasible. Instead, in the next section we attempt to provide a physical interpretation for generic UV profiles based on MHD simulations.
4 UV WIND LINES CALCULATED FROM MHD MODELS
This section reports initial results from ongoing attempts to use radiation MHD wind simulations (developed first by ud-Doula & Owocki 2002) to analyze the strengths and variability of UV resonance lines in magnetic massive stars. To this end, we apply the same MHD simulation used previously to model the rotational phase variation of HD 191612’s H line (Sundqvist et al. 2012), however modifying the radiative transfer code developed there to synthesize UV scattering lines (following the ‘3-D SEI’ method, e.g. Cranmer & Owocki 1996).
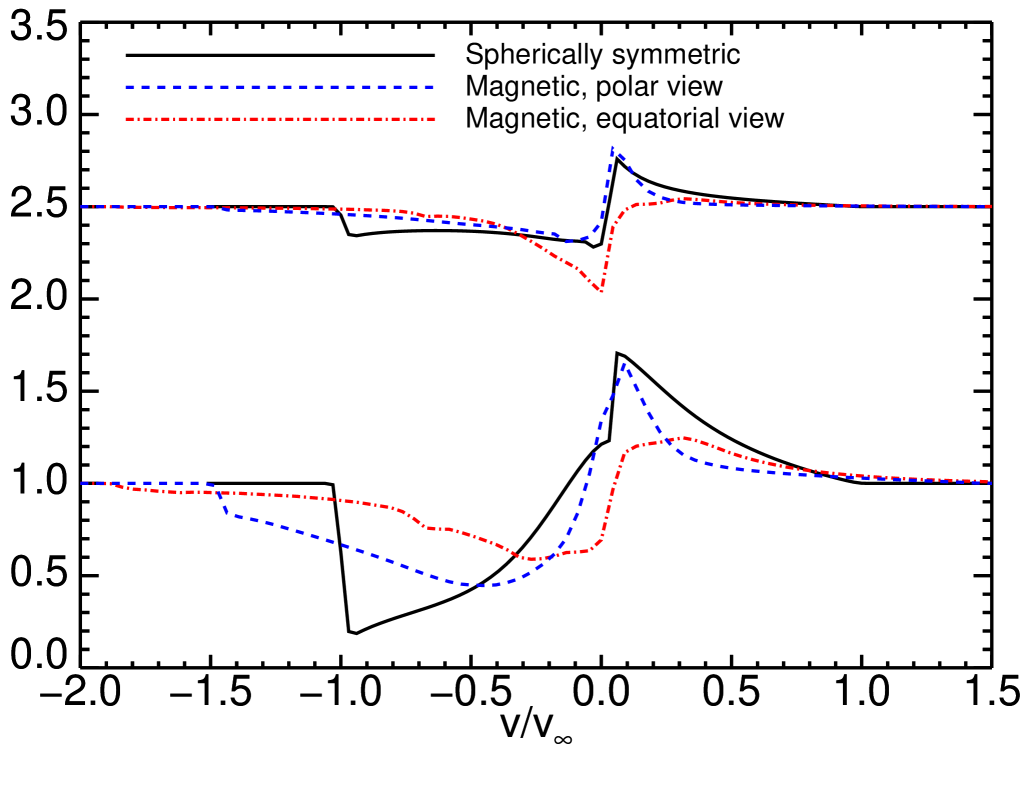
Fig. 6 shows generic synthetic profiles for a weak (upper panel) and moderately strong (lower panel) line, calculated i) from the MHD model for an observer viewing from above the magnetic pole (“high state”) and equator (“low state”), and ii) from the spherically symmetric wind model used as initial condition to the MHD simulation. Note how the phase trends of the modeled absorption-strengths indeed display opposite behaviour for the weak and strong lines, as observed for the (weaker) Si iv and (stronger) C iv lines in HD 191612 (see Fig. 1).
This anti-correlated variability of strong and weak lines can be qualitatively understood as follows: the line-of-sight absorption column in the low state samples the low-velocity, high density wind material trapped by closed field lines near the magnetic equator in HD 191612’s dynamical magnetosphere (Sundqvist et al. 2012). By contrast, the absorption column in the high state covers a wider range of velocities and densities, since it stems from the open field lines streaming from the magnetic pole, and so more closely resembles a ‘normal’ wind outflow. The result is that a strong line, which has sufficient optical depth to produce measurable absorption at high velocities, is stronger in the high state (lower panel). On the other hand, a weak line, which is not able to produce significant absorption at high velocities, is stronger in the low state (upper panel), because during that phase the line can absorb from the high density, low velocity material trapped in the wind’s dynamical magnetosphere.
This figure also shows that profiles computed for intrinsically strong lines (e.g., those corresponding to the line strength parameter in Fig. 6) are systematically weaker than their counterparts computed from spherically symmetric models, particularly at high velocities.
This effect can be understood by considering the faster-than-radial expansion of a radial polar flow-tube in a magnetic wind (Kopp & Holzer 1976; Owocki & ud-Doula 2004), which leads to a different density profile as function of velocity than in a spherical wind. Following Owocki & ud-Doula (2004), let us parameterize the non-radial expansion factor of an areal element, :
where is the scaled radius and is the magnetic wind confinement parameter applicable to a dipolar field (ud-Doula & Owocki 2002). Note how starts off at unity, but increases with radius reaching the asymptotic value . By the equation of continuity ; consequently, for equal basal mass fluxes, the density of a non-magnetic wind will be higher at a specified velocity in the outer wind than the density of a magnetic one, by a factor . Since for HD 191612, . This effect may partly explain the low mass-loss rate inferred from CMFGEN models (Sect. 3; dilution effect neglected) compared to the rate needed in the MHD simulations to reproduce HD 191612’s observed H emission strength and variability ( M⊙ yr-1). Note also from Fig. 6 that the MHD simulation further predicts a significant increase in wind terminal speed, here by . However, this does not seem to be observed for HD 191612, whose is not much higher than typical values inferred for non-magnetic O-stars.
A detailed study of the formation of UV wind lines in magnetic massive stars, focusing on issues like those discussed here, will be reported separately (Sundqvist & ud-Doula, in prep.).
5 SUMMARY AND CONCLUSIONS
We have presented for the first time phase-resolved UV data for an Of?p star, HD 191612. Our main findings and conclusions are outlined below.
-
•
The spectra observed at different rotational phases are broadly similar, with the same set of wind and photospheric lines consistently present. However, line profile variations are very significant compared to the ones found in normal O stars.
-
•
The variability observed is not as drastic as that reported for H and the He I lines in the optical part of the spectrum. We interpret this result as indicative of the stronger influence of the magnetic field on the lines formed closer to the photosphere (i.e., inside the Alfvén radius), where we find confined material.
-
•
We observe more wind absorption in N v 1240 and C iv 1550 and a less intense iron-forest spectrum at compared to . The former phase corresponds approximately to the configuration where the magnetic pole is towards the observer while the latter corresponds to the line of sight lying in the plane of the magnetic equator. Such variability is very similar to that reported for HD 108 in Paper I, and could be considered as probably representative of Of?p stars. There are, however, notable differences between HD 108 and HD 191612, such as the absence of saturated P Cygni profiles in HD 191612 and the anti-correlated variability of Si iv 1400 and other wind lines.
-
•
CMFGEN models are capable of providing a reasonable fit to the UV spectrum of HD 191612 at phase . The wind and photospheric lines are correctly predicted in broad terms, but not all profiles are reproduced in detail. Furthermore, spherically symmetric models cannot reproduce the variability revealed by the STIS data, since these variations arise from the dynamical magnetosphere of HD 191612.
-
•
We use MHD simulations in combination with simplified radiative transfer calculations to analyse the new STIS phase resolved data of HD 191612. We compare generic UV profiles representing C iv 1550 and Si iv 1400. The observed behaviour at phases and are qualitatively reproduced for both lines; an explanation for the anti-correlated variability (Figs. 1 and 3) is provided in terms of line strengths.
-
•
The mass-loss rate derived for HD 191612 from non-LTE expanding atmosphere models for the UV is considerably lower than the one inferred from the MHD simulations (based on H; M⊙ yr-1). This discrepancy can be partially understood by a density dilution effect (Sect. 4) but deserves a deeper investigation.
The present results take us a further step towards a detailed picture of the optical and UV variability in Of?p stars. In general, the optical spectra are strongly affected by the magnetic field, with line formation at or below the Alfvén radius. The UV P Cygni profiles present moderate changes, suggesting spherical symmetry may be a reasonable first approximation for the wind at large radii. MHD simulations such as the ones computed here are however mandatory to describe the (phase-resolved) UV profiles in detail.
Two additional Of?p stars have been recently detected to be magnetic, namely, NGC 1624-2 and CPD -28 2561 (Walborn et al. 2010; Wade et al. 2012; Hubrig et al. 2012). The basic results regarding the ultraviolet spectrum reported here and in our previous paper are expected to be also observable in these stars. However, for NGC 1624-2, future UV observations will likely reveal a considerably larger variability in the wind profiles than the ones seen so far, since its dipole field is estimated to be about 20kG (Wade et al. 2012). Such a field is about 8 times more intense than in any other known magnetic O-type star.
The Of?p class now stands out among the O-type stars as magnetic variables. They represent therefore an ideal astrophysical laboratory for the study of stellar wind confinement and magnetic field effects in the evolution of massive stars. The progress achieved so far shows that multiwavelength analyses are crucial for a complete description of their properties.
Acknowledgments
WLFM acknowledges support from the Fundação de Amparo à Pesquisa do Estado do Rio de Janeiro (FAPERJ/APQ1). JCB was supported by NASA grant NNX08AC146 to the University of Colorado at Boulder during the completion of this work. JOS acknowledges support from NASA ATP grant NNX11AC40G. NRW acknowledges support provided by NASA through grant GO-12179.01 from STScI, which is operated by AURA, Inc., under NASA contract NAS5-26555. GAW acknowledges Discovery Grant support from the Natural Sciences and Engineering Research Council of Canada (NSERC). AuD acknowledges support from NASA ATP grant NNX12AC72G. We thank the French Agence Nationale de la Recherche (ANR) for financial support.
References
- [] Babel, J., Montmerle, T., 1997, A&A, 323, 121
- [] Bouret, J.-C., Lanz, T., Hillier, D. J., 2005, A&A, 438, 301
- [] Cranmer, S. R., Owocki, S. P., 1996, ApJ, 462, 469
- [] Donati, J.-F., Howarth, I. D., Bouret, J.-C., Petit, P., Catala, C., Landstreet, J., 2006, MNRAS, 365, L6
- [] Grevesse, N., Asplund, M., Sauval, A. J., Scott, P., 2010, Ap&SS, 328, 179
- [] Hillier, D. J., Miller, D. L., 1998, ApJ, 496, 407
- [] Hillier, D. J., Miller, D. L., 1999, ApJ, 519, 354
- [] Howarth, I. D., Walborn, N. R., Lennon, D. J., Puls, J., Nazé, Y., Annuk, K., et al., 2007, MNRAS, 381, 433
- [] Hubrig, S., Kholtygin, A., Scholler, M., Langer, N., Ilyin, I., Oskinova, L., Information Bulletin on Variable Stars, 6019, 1
- [] Humphreys, R. M., 1978, ApJS, 38, 309
- [] Kaper, L., Henrichs, H. F., Nichols, J. S., Snoek, L. C., Volten, H., Zwarthoed, G. A. A., 1996, A&AS, 116, 257
- [] Kopp, R. A., Holzer, T. E., 1976, SoPh, 49, 43
- [] Marcolino, W. L. F., et al., 2012, MNRAS, 422, 2314
- [] Martins, F., Plez, B., 2006, A&A, 457, 637
- [] Martins, F., Escolano, C., Wade, G. A., Donati, J. F., Bouret, J.-C., 2012, A&A, 538, 29
- [] Nazé, Y., Vreux, J., Rauw, G., 2001, A&A, 372, 195
- [] Nazé, Y., ud-Doula, A., Spano, M., Rauw, G., De Becker, M., Walborn, N. R., 2010, A&A, 520, 59
- [] Owocki, S., ud-Doula, A., 2004, ApJ, 600, 1004
- [] Owocki, S., Puls, J., 1999, ApJ, 510, 355
- [] Puls, J., Vink, J. S., Najarro, F., 2008, A&ARv, 16, 209
- [] Sota, A., Maíz-Apellániz, J., Walborn, N. R., Shida, R. Y., 2008, RMxAC, 33, 56
- [] Sundqvist, J. O., Puls, J., Feldmeier, A., Owocki, S. P., 2011, A&A, 528, 64
- [] Sundqvist, J. O., ud-Doula, A., Owocki, S. P., Townsend, R. H. D., Howarth, I. D.., Wade, G. A., 2012, MNRAS, 423, 21
- [] ud-Doula, A., Owocki, S. P., 2002, ApJ, 576, 413
- [] Wade, G. A., et al., 2011, MNRAS, 416, 3160
- [] Wade, G. A., et al., 2012, MNRAS, 425, 1278
- [] Walborn, N. R., 1973, AJ, 78, 1067
- [] Walborn, N. R., Howarth, I. D., Herrero, A., Lennon, D. J., 2003, ApJ, 588, 1025
- [] Walborn, N. R., et al., 2004, ApJ, 617, L61
- [] Walborn, N. R., et al., 2010, ApJ, 711, L143