Interaction of a Contact Resonance of Microspheres with Surface Acoustic Waves
Abstract
We study the interaction of surface acoustic waves (SAWs) with the contact-based, axial vibrational resonance of m silica microspheres forming a two-dimensional granular crystal adhered to a substrate. The laser-induced transient grating technique is used to excite SAWs and measure their dispersion. The measured dispersion curves exhibit “avoided crossing” behavior due to the hybridization of the SAWs with the microsphere resonance. We compare the measured dispersion curves with those predicted by our analytical model, and find excellent agreement. The approach presented can be used to study the contact mechanics and adhesion of micro- and nanoparticles as well as the dynamics of microscale granular crystals.
pacs:
68.35.Iv, 78.47.jj, 46.55.+d, 45.70.-nWave phenomena in granular media is a rich and rapidly developing field of research NesterenkoBook ; GranularPhysicsBook ; GranularCrystalReviewChapter . At the heart of this field is the Hertzian model of elastic contact between spherical particles, in which the stiffness of the contact depends on the applied force Hertz . One type of granular media, often referred to as “granular crystals”, consists of close-packed, ordered arrays of elastic particles that interact via Hertzian contact NesterenkoBook ; GranularCrystalReviewChapter . Granular crystals have been shown to support a wide range of linear and nonlinear dynamical phenomena not encountered in conventional materials, and have been suggested for various engineering applications NesterenkoBook ; GranularCrystalReviewChapter .
Acoustic studies of granular media typically involve macroscopic particles with dimensions of – mm NesterenkoBook ; GranularPhysicsBook ; GranularCrystalReviewChapter , whereas contact-based vibrations of microparticles with dimensions of (or under) m remain largely unexplored. The scale factor is significant as a microparticle system cannot be thought of simply as a scaled down version of a macroscale system which is governed by the same physics. Rather, microparticles are expected to yield qualitatively different dynamics. One crucial factor is the role of adhesion Bhushan ; Israelachvili , which is almost negligible on millimeter scales but significant on micron scales. Because of adhesion, a microsphere in contact with a substrate is pulled toward the latter. This results in an equilibrium contact stiffness and an axial “contact resonance” vibrational mode with frequency determined by the particle mass, the adhesion, and the elastic properties of the particle and substrate Peri2005 . This phenomenon has not hitherto been observed experimentally, although rocking-mode vibrations at much lower frequencies have been studied in – m spheres Dybwad1985 ; Peri2005 ; Butt2010 , and vibrations corresponding to free particle eigenmodes at much higher frequencies have been studied in m silica spheres Tournat2009 .
In this letter, we study the contact-based, axial vibrational resonance of m diameter microspheres forming a two-dimensional granular crystal adhered to a substrate using another hitherto unexplored phenomenon, i.e., the interaction of axial contact resonances of microparticles with surface acoustic waves (SAWs) in the substrate. We use the laser-induced transient grating (TG) technique RogersReview2000 ; NelsonTG2012 to excite the long-wavelength (relative to the particle size) SAWs and measure their dispersion. The measured dispersion curves exhibit classic “avoided crossing” behavior due to the hybridization of the SAWs with the contact resonance of microspheres. Such coupling between SAWs and mechanical surface oscillators was studied in theoretical works Kosevich1989 ; Baghai1992 ; Garova1999 , and the experimental work Laude2011 . We analyze our measurements using a simple model that yields an analytical expression for the dispersion relation. We find excellent agreement between our model and the measurements using the frequency of the contact resonance as a single fitting parameter, and we compare our results with estimates based on the Derjaguin-Muller-Toporov (DMT) contact model DMT1983 .
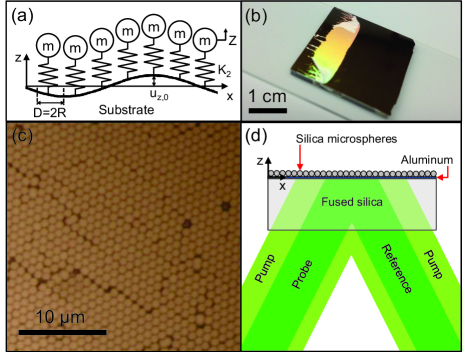
Our sample is a hexagonally packed monolayer of m diameter silica microspheres deposited on an aluminum-coated fused silica substrate, as shown in Fig. 1(b,c). The fused silica slab is mm thick, and the aluminum layer, which serves as a medium to absorb pump laser light, is m thick. To assemble the monolayer on the substrate, we used the “wedge-shaped cell” convective self-assembly technique SunWedgeMethod2010 ; LopezWedgeMethod2011 ; Supplementary . The resulting monolayer has an overall area of mm by mm, as shown in Fig. 1(b). A representative optical image of the monolayer packing is shown in Fig. 1(c). Although the monolayer has a relatively uniform distribution, defects and grains of uniform packing are clearly present.
We use a laser-induced TG technique RogersReview2000 ; NelsonTG2012 to measure the phase velocity dispersion of SAWs in our sample. The TG setup with heterodyne detection used for these experiments has been described previously NelsonTG2012 . In summary, two excitation beams derived from the same laser source ( nm wavelength, ps pulse duration, J total pulse energy at the sample) enter the sample through the transparent silica substrate, as shown in Fig. 1(d), and are overlapped at the aluminum layer forming a spatially periodic interference pattern. The pump spot has m diameter at intensity level. Absorption of the laser light by the aluminum film induces rapid thermal expansion, which leads to the generation of counter-propagating SAWs with wavelength defined by the period of the interference pattern. The period is controlled by a phase mask pattern used to create the two excitation beams, by splitting the incident beam into diffraction orders RogersReview2000 . Switching phase mask patterns allows measurements at multiple acoustic wavelengths.
SAW detection is accomplished using a quasi-cw probe beam ( nm wavelength, mW average power at the sample) focused at the center of the excitation pattern to a spot of m diameter. The probe beam also enters the sample through the silica substrate and is diffracted by surface ripples and refractive index variations in the substrate induced by SAWs NoteSurfaceRipples . The diffracted beam is overlapped with the reflected reference beam (local oscillator) RogersReview2000 ; NelsonTG2012 and directed onto a fast avalanche photodiode with a 1 GHz bandwidth. The signal is recorded using an oscilloscope and averaged over repetitions.
Figure 2(a,b) shows typical signal waveforms acquired at an acoustic wave vector magnitude . Figure 2(a) shows the signal from a sample location without microspheres, and Fig. 2(b) corresponds to a location with spheres. In both cases there is a sharp initial increase, which corresponds to the excitation pulse arriving at the sample. The slowly decaying component is due to the “thermal grating” associated with the temperature profile in the sample RogersReview2000 ; NelsonTG2012 . The high frequency oscillations are due to acoustic waves.
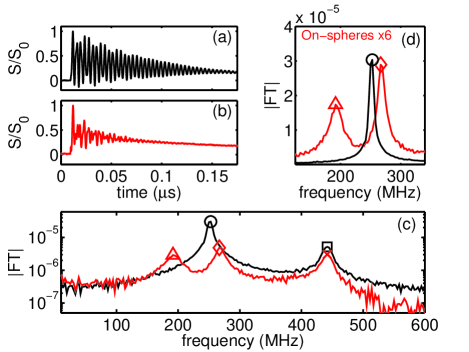
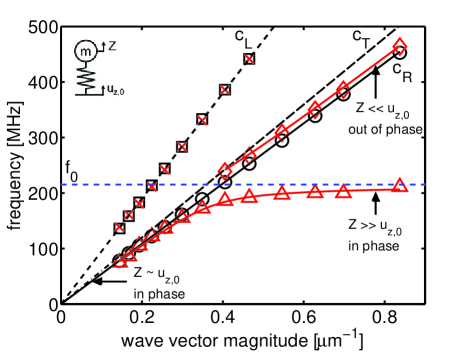
Figure 2(c,d) shows the Fourier spectra of acoustic oscillations corresponding to the signals in Fig. 2(a,b) Supplementary . In the off-spheres case there are two clear peaks, which correspond to a Rayleigh SAW (the low frequency peak) and a longitudinal wave in the substrate NoteLateralWaves . Figure 3 shows the acoustic dispersion curves. For the off-spheres case, we see linear dispersion curves that agree very well with lines corresponding to the longitudinal and Rayleigh wave velocities in fused silica. We used typical wave speeds for fused silica of m/s (longitudinal) and m/s (transverse) Silica , and we calculated the Rayleigh wave speed m/s by numerically solving the Rayleigh equation Ewing . More accurate calculations accounting for the aluminum layer Supplementary ; Ewing showed that the reduction in the Rayleigh wave speed due to the aluminum layer does not exceed .
The on-spheres case yields starkly different behavior from the off-spheres case, as can be seen by comparing the signal waveforms shown in Fig. 2(a,b). The comparison of the spectra in Fig. 2(c) shows that the longitudinal peak is unaffected by the presence of the spheres whereas the SAW peak is split in two. The on-spheres dispersion curves in Fig. 3 reveal a classic “avoided crossing” between the Rayleigh wave and a local microsphere resonance. The lower branch starts as a Rayleigh wave at low wave vector magnitudes and approaches a horizontal asymptote corresponding to the resonance frequency. The upper branch is close to the Rayleigh wave at high wave vector magnitudes; in the “avoided crossing” region it deviates from the Rayleigh line and stops at the threshold corresponding to the transverse acoustic velocity of the substrate.
To describe SAW propagation in our system of microspheres coupled to an elastic substrate, we adapt an approach developed in the theoretical works Kosevich1989 ; Baghai1992 ; Garova1999 . As shown schematically in Fig. 1(a), we model the substrate as an elastic half-space (), where the surface of the halfspace is connected to an array of linear surface oscillators, with mass and stiffness , which represent the microspheres connected to the substrate via “contact springs”. We calculate the mass of a microsphere as , where g/ is the density of the silica microspheres as provided by the manufacturer (Corpuscular, Inc.).
We approximate the microspheres as point-masses, as the lowest spheroidal resonance of the microspheres, GHz Sato , is much greater than the frequencies observed in the experiment. The equation of motion for the surface oscillator can be written as , where is the displacement of the substrate surface, and is the displacement of the oscillator relative to the surface. The particles exert a vertical force on the substrate, leading to the following boundary conditions at the surface :
| (1) |
where and are components of the elastic stress tensor Ewing , and is the area of a primitive unit cell in our hexagonally packed monolayer.
Since the acoustic wavelength is much larger than the sphere size, in Eq. 1 we use an effective medium approach, and approximate the average normal stress at the surface as the force exerted by the microsphere “spring” divided by the area of a unit cell (assuming perfect packing) even though the stress is localized around the contact area. We follow the standard procedure for the derivation of the Rayleigh wave equation Ewing , but use Eq. 1 instead of stress-free boundary conditions to obtain the following dispersion relation for the SAWs in our coupled oscillator system Supplementary :
| (2) |
where is the angular frequency of the contact resonance, and g/ ASMSilica is the density of the silica substrate. On the left-hand side of Eq. 2, the term in square brackets is familiar from the Rayleigh equation, and the term in the parentheses describes the resonance of the oscillators. The right-hand side of Eq. 2 is responsible for the coupling between the Rayleigh waves and the oscillators; if it is made to vanish (for instance by assuming a vanishing areal density ), then the oscillators and SAWs in the substrate are effectively decoupled. We also see that and relate to the coupling strength, relates to the frequency of the avoided crossing through , and relates to both.
By taking the frequency of the contact resonance as a fitting parameter, and using least squares minimization between the numerical solution of Eq. 2 and the measured dispersion, we find MHz. The fitted resonant frequency is plotted as the blue dashed line in Fig. 3, and gives a contact stiffness of kN/m. We plot the numerical dispersion curve from our fitting as the red solid line in Fig. 3.
Any real solution of Eq. 2 must yield the phase velocity smaller than , otherwise at least one of the square root terms becomes imaginary. Therefore, the calculated upper dispersion branch terminates at the threshold , in agreement with the experiment. In some cases leaky wave solutions with complex can be found above the threshold Garova1999 , however we did not investigate complex solutions since in our experiment the upper branch peak disappeared past the threshold.
Using the oscillator equation of motion, we estimated the relative displacements (and phase) of the microspheres and the surface for various limiting cases Supplementary , as is shown in Fig. 3. In the flat dispersion region of the lower branch, there is predominantly sphere oscillation with very small surface displacements. Indeed, our experimental data show that the amplitude of the corresponding peak becomes progressively smaller compared to the Rayleigh-like upper branch as the wave vector magnitude is increased Supplementary .
We estimate the frequency of the contact resonance (and the contact stiffness) of the microspheres using the DMT contact model DMT1983 ; Supplementary , and compare with the resonant frequency obtained from the measured data. The DMT model describes the contact between an elastic sphere and a flat substrate under the presence of adhesive forces. The model assumes that the deformation profile is Hertzian and the adhesive forces act outside the contact area. For the case of small displacements, the full DMT model can be approximated as DMT1983 :
| (3) |
where is a force applied to the sphere, is the displacement of the center of the sphere towards the substrate, J/ is the work of adhesion between silica and alumina (as the aluminum surface is normally oxidized) Supplementary , is the effective microsphere radius of contact (which reduces to for a sphere on a flat substrate Hertz ), and is the the effective modulus, where the aluminum has elastic modulus GPa and Poisson’s ratio ASMAluminum , and the microspheres have elastic modulus GPa and Poisson’s ratio GlassHandbook . Using Eq. 3, we calculate the equilibrium displacement nm, the linearized stiffness around the equilibrium point kN/m, and MHz. Below the axial contact resonance, a rocking mode is also predicted MHz Peri2005 , however this is significantly below our measured acoustic frequency range. The discrepancy between the estimated and the measured values of may be caused by uncertainties in the contact and adhesion models. Challenges in application of DMT to real nanoscale contacts have been underscored by studies in atomic force microscopy Bhushan ; Hurley2006 . Typical adhesion studies relying on measuring a pull-off force provide limited information for verification of adhesion theories Bhushan ; Peri2005 . Our experiment provides a direct pathway to the contact stiffness, and thus offers a promising tool for studying adhesion and contact mechanics.
Potentially useful information can also be obtained by studying the attenuation of the SAWs. As can be seen in Fig. 2(d), the peaks in the on-spheres case are broader. Faster attenuation is also evident from a comparison of the signal waveforms in Fig. 2(a,b). In the off-spheres case, the acoustic signal decays as the SAW wavepacket leaves the probe spot, with material losses being negligible within the time window of the measurement AlexJAP2009 . The apparent decay time is thus determined by the width of the wavepacket (i.e. the width of the excitation spot) and the SAW group velocity. In the on-spheres case the group velocity is lower, yet the decay time is shorter, which indicates that the presence of the spheres leads to additional attenuation. One possible mechanism is scattering due to the spheres. A single oscillator on the surface of a halfspace will radiate acoustic energy into the substrate; however, a collective mode of a periodic array with will not radiate Garova1999 ; AlexJAP2009 . In our case, the sphere packing is not perfectly periodic, which may lead to scattering and radiation into the bulk. In the flat region of the lower dispersion branch, the acoustic mode is close to the contact resonance of the spheres. In this case, the peak width may also be determined by inhomogeneous broadening caused by sphere-to-sphere variation of the contact stiffness. If this is the case, then the peak width can be used to study the statistics of contact stiffnesses. Peak broadening may also be caused by anharmonicity, but we estimate sphere displacements to be in the linear regime Supplementary , and no anharmonic effects such as second harmonic generation are observed. In the future, it would be interesting to study the nonlinear regime, which should be achievable based on observations of a complete detachment of micron-sized particles by high-amplitude SAWs MaznevAblation .
We have seen that an avoided crossing between the Rayleigh wave and contact resonance of the spheres occurs at wavelengths much larger than the sphere size and is well described by the effective medium approximation. Thus our structure belongs to a class of “locally resonant metamaterials”, for which interesting effects have been observed on the macroscale LiuScience2000 ; SodaCans . We expect the effective medium model to break down at shorter wavelengths where phononic crystal effects should be seen Garner1993 . Furthermore, our model treats the spheres as independent oscillators that interact through the elastic substrate but not directly. Although the spheres are closed-packed, the model describes the data very well. We believe that this is, again, due to the fact that the acoustic wavelength is large compared to the sphere size. At shorter wavelengths we expect to see rich dynamics due to interaction between the spheres NoteOnFytas2012 ; Tournat2D ; the interaction with SAWs will make such dynamics even richer.
In summary, we have studied the interaction of SAWs with the contact-based resonance of microspheres forming a two-dimensional granular crystal. The experimental method can be used to study the adhesion and contact mechanics of microparticles. It also enables the study of granular crystals on the microscale. A rich array of dynamical phenomena observed in macroscale granular crystals, and their promise for practical applications GranularCrystalReviewChapter , suggest interesting possibilities for microscale granular crystals. An analogy can also be made between SAWs interacting with a microsphere contact resonance and surface plasmon-polariton waves in a metal film interacting with a localized surface plasmon resonance of a metallic nanoparticle coupled to the metal film Smith2012 . This may lead to acoustic analogies of some plasmonic phenomena and applications PlasmonicsBook . Finally, the nonlinearity of the Hertzian contact holds promise for an application of our approach to developing nonlinear SAW devices.
N.B. thanks G. Theocharis for useful discussions, and K. Broderick for guidance in substrate fabrication. This work was supported by the the Defense Threat Reduction Agency through grant HDTRA 1-12-1-0008. A.K. and N.X.F. are also partially supported by NSF grant CMMI-1120724.
References
- (1) H. Hinrichsen and D. E. Wolf, The Physics of Granular Media (WILEY-VCH Verlag GmbH & Co. KGaA, Weinheim, 2004).
- (2) V. F. Nesterenko, Dynamics of Heterogeneous Materials (Springer-Verlag, New York, NY, 2001).
- (3) G. Theocharis, N. Boechler, and C. Daraio, in Acoustic Metamaterials and Phononic Crystals, edited by P. A. Deymier (Ch. 7, Vol. 173, Springer, Berlin, Heidelberg, 2013).
- (4) H. Hertz, J. Reine Angew. Math., 92 156 (1882).
- (5) B. Bhushan, Handbook of Micro/Nano Tribology: Second Edition (CRC Press, Boca Raton, FL, 1999).
- (6) J. Israelachvili, Intermolecular and Surface Forces (Elsevier, Inc., Burlington, MA, 2011).
- (7) G. L. Dybwad, J. Appl. Phys. 58, 2789 (1985).
- (8) M. D. Murthy Peri and C. Cetinkaya, J. Colloid. Interface Sci. 288, 432 (2005).
- (9) E. Vittorias, M. Kappl, H. J. Butt, D. Johannsmann, Powder Tech. 203, 489 (2010).
- (10) T. Dehoux, Optics Lett. 34, 3740 (2009).
- (11) J. A. Rogers, et al., Annu. Rev. Mater. Sci. 30, 117 (2000).
- (12) J. A. Johnson, et al., J. Appl. Phys. 111, 023503 (2012).
- (13) Y. A. Kosevich and E. S. Syrkin, Phys. Lett. A 135, 298 (1989).
- (14) A. R. Baghai-Wadji, V. P. Plessky, and A. V. Simonian, Sov. Phys. Acoust. 38, 442 (1992).
- (15) E. A. Garova, A. A. Maradudin, and A. P. Mayer, Phys. Rev. B 59 13291 (1999).
- (16) Y. Achaoui, et al., Phys. Rev. B 83, 104201 (2011).
- (17) V. M. Muller, B. V. Derjaguin, and Y. P. Toporov, Colloids and Surfaces 7, 251 (1983); M. D. Pashley, Colloids and Surfaces 12, 69 (1984).
- (18) J. Sun, et al., Langmuir 26, 7859 (2010).
- (19) V. Canalejas-Tejero, et al., Langmuir 28, 161 (2012).
- (20) See supplementary information.
- (21) By comparing with measurements made from the front side, we find that the signal contribution from surface ripples is dominant, except in the case of longitudinal waves, where the contribution from refractive index variation is dominant.
- (22) Strictly speaking, a bulk longitudinal wave does not propagate along the free surface. However, there’s an evanescent disturbance that propagates with the longitudinal wave velocity termed as a lateral wave or a surface skimming bulk wave, see A. G. Every and G. A. D. Briggs, Phys. Rev. B 58, 1601 (1998).
- (23) D. R. Lide, Handbook of Chemistry and Physics (CRC Press, Boca Raton, 2003).
- (24) W. M. Ewing, W. S. Jardetzky, and F. Press, Elastic Waves in Layered Media (McGraw-Hill Book Company, Inc., New York, NY, 1957).
- (25) Y. Sato and T. Usami, Geophys. Mag. 31, 15 (1962).
- (26) D. E. Dieter, ASM Handbook, Volume 20 - Materials Selection and Design (ASM International, 1997).
- (27) ASM International Handbook Committee, ASM Handbook, Volume 2 - Properties and Selection: Nonferrous Alloys and Special-Purpose Alloys (ASM International, 1990).
- (28) N. P. Bansat, R. H. Doremus, Handbook of Glass Properties (Academic Press, Inc., Orlando, FL, 1986).
- (29) M. Kopycinska-Muller, R. H. Geiss, and D. C. Hurley, Ultramicroscopy 106, 466 (2006).
- (30) A. A. Maznev, O. B. Wright, J. Appl. Phys. 105, 123530 (2009).
- (31) A. A. Kolomenskii and A. A. Maznev, J. Appl. Phys. 77, 6052 (1995).
- (32) Z. Liu, et al., Science 289, 1734 (2000).
- (33) F. Lemoult, M. Fink, and G. Lerosey, Phys. Rev. Lett. 107 064301 (2011).
- (34) H. R. Garner, T. Ohkawa, IEEE T. Ultrason. Ferr., 40, 69 (1993).
- (35) Recent results indicate contact-based modes in nanosphere clusters, see M. Mattarelli, et al., Soft Matter 8, 4235 (2012).
- (36) V. Tournat, et al., New J. Phys. 13, 073042 (2011).
- (37) J. J. Mock, et al., Nano Lett. 12 1757 (2012).
- (38) S. A. Maier, Plasmonics: Fundamentals and Applications (Springer, 2007).