On the Radio Polarization Signature of Efficient and Inefficient Particle Acceleration in Supernova Remnant SN 1006
Abstract
Radio polarization observations provide essential information on the degree of order and orientation of magnetic fields, which themselves play a key role in the particle acceleration processes that take place in supernova remnants (SNRs). Here we present a radio polarization study of SN 1006, based on combined VLA and ATCA observations at 20 cm that resulted in sensitive images with an angular resolution of 10 arcsec. The fractional polarization in the two bright radio and X-ray lobes of the SNR is measured to be 0.17, while in the southeastern sector, where the radio and non-thermal X-ray emission are much weaker, the polarization fraction reaches a value of 0.60.2, close to the theoretical limit of 0.7. We interpret this result as evidence of a disordered, turbulent magnetic field in the lobes, where particle acceleration is believed to be efficient, and a highly ordered field in the southeast, where the acceleration efficiency has been shown to be very low. Utilizing the frequency coverage of our observations, an average rotation measure of rad m-2 is determined from the combined data set, which is then used to obtain the intrinsic direction of the magnetic field vectors. While the orientation of magnetic field vectors across the SNR shell appear radial, a large fraction of the magnetic vectors lie parallel to the Galactic Plane. Along the highly polarized southeastern rim, the field is aligned tangent to the shock, and therefore also nearly parallel to the Galactic Plane. These results strongly suggest that the ambient field surrounding SN 1006 is aligned with this direction (i.e., from northeast to southwest) and that the bright lobes are due to a polar cap geometry. Our study establishes that the most efficient particle acceleration and generation of magnetic turbulence in SN 1006 is attained for shocks in which the magnetic field direction and shock normal are quasi-parallel, while inefficient acceleration and little to no generation of magnetic turbulence obtains for the quasi-perpendicular case.
1 Introduction
Shock waves driven by supernova remnants (SNRs) are proposed to accelerate particles to relativistic energies through the diffusive shock acceleration (DSA) mechanism (Krymskii 1977; Axford et al. 1977; Bell 1978a, b; Blandford & Ostriker 1978). In this process, also known as first-order Fermi acceleration, electrons, protons, and other ions scatter back and forth on magnetic irregularities across the shock, gaining energy on each successive crossing. The orientation of the ambient magnetic field with respect to the direction of the shock velocity and the level of turbulence of the field throughout the shock transition region play key roles in the DSA process (for a review see Malkov & O’C Drury 2001). A critical issue of the DSA theory concerns the amplification of the ambient magnetic field, which is now believed to occur synergistically with particle acceleration (Bell & Lucek 2001; Bell 2004). In this picture, accelerated particles streaming ahead of the shock excite magnetohydrodynamic turbulence that can amplify the ambient magnetic field far above its initial seed value. The field so produced is expected to be highly turbulent () (e.g., Bell 2004). Radio polarization observations are therefore crucial to understanding such processes, since they can provide information on the degree of order and orientation of the magnetic field in the shocked gas of the remnant. Bilateral SNRs are ideal targets for these studies—the highly symmetric morphology of such remnants suggests evolution in a magnetized environment with large-scale order.
The remnant of SN 1006, a large ( arcmin) bilateral SNR located at high Galactic latitude, is an ideal laboratory to study the polarization and magnetic field distribution while avoiding confusion from other sources in the line of sight. It is widely accepted that SN 1006 is the remnant of a Type Ia supernova event (Stephenson & Green 2002, p. 174). Optical proper motion measurements, combined with the shock velocity as inferred from H spectra (Ghavamian et al. 2002), place this remnant at a distance of 2.18 kpc (Winkler et al. 2003). At both radio and X-ray wavelengths (e.g., Reynolds & Gilmore 1986; Cassam-Chenaï et al. 2008; Dyer et al. 2009; Rothenflug et al. 2004), the SNR appears as a circular shell, with two bright lobes perpendicular to the Galactic Plane. In contrast, the H image (Winkler & Long 1997) reveals a system of faint, relatively thin filaments defining an almost perfect, complete circular ring, with enhanced emission at the NW, between the bright radio and X-ray lobes. Based on XMM-Newton X-ray observations, Acero et al. (2007) estimated a higher ambient density at this location. TeV energy rays, originating in the radio and X-ray bright lobes, have recently been detected with H.E.S.S. (Acero et al. 2010).
The first full polarization map of SN 1006 was obtained by Kundu (1970) using 6 and 11-cm observations performed with the NRAO 43-m telescope at Green Bank. The SNR was found to have an average polarization percentage of 10% to 15% at 5 GHz and a radial orientation of the magnetic field. A similar result was obtained by Dickel & Milne (1976) using higher resolution observations, albeit with a lower fractional polarization (%). The highest resolution polarization study of SN 1006 was done by Reynolds & Gilmore (1993), based on VLA observations at 1370 and 1665 MHz. They found peak polarization fractions of 30% in the lobes, somewhat higher than previous results, and that the magnetic field, although presenting mostly a radial orientation, was predominantly disordered. Moreover, they also detected weak polarized flux from the faint SE quadrant.
One of the current theories to explain the bilateral symmetry of SN 1006 (e.g., Fulbright & Reynolds 1990; Dyer et al. 2004; Petruk et al. 2009; Schneiter et al. 2010) interprets the limb-brightened emission of the lobes as a result of a shock expanding into a region of the interstellar medium (ISM) whose magnetic field is perpendicular to the shock normal. In the case of SN 1006, that means that the magnetic field would be aligned SE to NW (the equatorial model). Acceleration rates are higher in perpendicular shocks (Ellison et al. 1995; Jokipii 1987), as the magnetic field is directly compressed and charged particles are accelerated as they traverse magnetic gradients; however, the injection of thermal particles is lower due to the high obliquity of fields with the shock normal, requiring a mechanism for scattering thermal electrons and ions back into the shock. However, other work (e.g., Rothenflug et al. 2004; Cassam-Chenaï et al. 2008) on the variation of the non-thermal synchrotron X-ray and radio emission with azimuthal angle around the limb of SN 1006 casts doubt on this interpretation. These results suggest that the morphology of the emission is best explained if the bright limbs are polar caps, requiring that the ambient magnetic field direction extends from SW to NE. Acceleration rates in the bright caps in this situation (quasi-parallel shocks) would be comparatively lower than in the former case (quasi-perpendicular), but injection rates of thermal particles would be much higher. The simple geometrical argument that Rothenflug et al. (2004) applied to the XMM-Newton image, favors the equatorial belt model when applied to a radio image. To reconcile the model with the observations in both spectral ranges, Petruk et al. (2011) propose a somewhat contrived model of a magnetic field with a gradient.
When DSA is very efficient, the back reaction of the accelerated particles on the structure of the supernova remnant can have significant and observable consequences. One of these, potentially active in young ejecta-dominated remnants, is a narrowing of the distance from the forward shock to the contact discontinuity (Decourchelle et al. 2000), an effect that was first observed in the Tycho SNR (Warren et al. 2005). Cassam-Chenaï et al. (2008), using Chandra X-ray observations, discovered this effect in SN 1006 by comparing the outermost location of the H filaments to the outermost extent of the ejecta, as traced by the 0.5-0.8 keV band which is dominated by emission from highly ionized O ions in the SN ejecta. This study found that the gap between the forward shock and contact discontinuity was largest at the SE rim and that the gap smoothly decreased with azimuthal angle as one proceeded toward the bright lobes. The authors concluded that this was direct evidence for a variation in acceleration efficiency as a function of azimuth around the rim of SN 1006, likely due to a corresponding azimuthal variation in the orientation between the shock normal and the ambient magnetic field direction.
In this paper we offer insights on these critical issues by carrying out a new high resolution polarization study of SN 1006 based on observations performed with the Australia Telescope Compact Array (ATCA) and the Very Large Array (VLA). The combination of these two data sets allows us to construct images with unprecedented detail, from which new information is derived to clarify the role of magnetic fields in the emission of SN 1006.
2 Observations and Data Reduction
Full-polarization radio continuum observations of SN 1006 were carried out in 2003 using the Very Large Array (VLA) of the National Radio Astronomy Observatory and the Australia Telescope Compact Array (ATCA). VLA observations were performed on 24 January 2003 for a four-hour duration in its CnD array configuration (primarily used to observe sources at southern declinations). Visibility data were recorded from two 12-MHz frequency bands centered at 1370 and 1665 MHz. We used the source 3C 286 as our flux calibrator, and 1451400 as the phase calibrator for SN 1006. ATCA observations were performed on three separate occasions: 12 hours in the 6B configuration on 24 January, 12 hours in the 6A configuration on 3 March, and seven hours in the 750C configuration on 12 June. Visibility data were recorded from two 128-MHz frequency bands centered at 1384 and 1704 MHz, divided into 32 channels each. We used PKS 1934638 as our flux calibrator, and PKS 1458391 as the phase calibrator.
Flux, phase and polarization calibration of VLA data was performed using the Astronomical Image Processing System (AIPS). The ATCA data was calibrated using the Miriad software package (Sault et al. 1995). We used Miriad to perform the remainder of the reduction process. The Stokes visibility data from all observations were split into two data sets: 1370 MHz VLA data were combined with 1384 MHz ATCA data in one set, and 1665 MHz VLA data were combined with 1704 MHz ATCA data to form the other set. We created uniform-weighted ‘dirty’ images of Stokes I (total intensity), Q and U for both frequency data sets using the Miriad task INVERT. Images were mosaicked to handle a slight pointing offset between the VLA and ATCA observations. The Miriad task PMOSMEM was used to perform a joint maximum-entropy deconvolution of the mosaicked dirty images. This program can operate on all Stokes images handling the positive and negative emission found in Stokes Q and U maps. Although the resulting resolution of the dirty maps was 8′′ 6′′ , we restored them during deconvolution with a circular beam of 10′′ to improve their signal-to-noise. The total intensity image constructed with these data was previously published in Cassam-Chenaï et al. (2008).
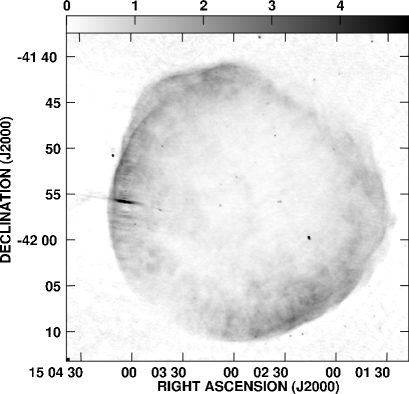
We used the Miriad task IMPOL to combine the Stokes , and to form images of linear polarized power (), polarized fraction (), linear position angle ( tan), a rotation measure map between frequency data sets, and all of their associated error maps. All polarization maps (except total intensity) were blanked where was lower than , where is the noise level for the Stokes and maps. We used mJy beam-1. The Ricean bias was removed in first order in the same task by computing the polarized power as , hence the minimum value of the polarized emission is 0.15 mJy beam-1. In Fig. 1 we present the resulting total intensity (1(a)) and polarized intensity (1(b)) maps of SN 1006, where in the latter, pixels where the total intensity was lower than 0.25 mJy beam-1 (the outermost contour of SN 1006 according to Fig. 1(a)) were further blanked.
The integrated flux density of our total intensity map is Jy, in agreement with Cassam-Chenaï et al. (2008), where an independent calibration of the same data was presented. This value is lower than the combined single-dish and interferometer flux of 18.68 Jy found by Dyer et al. (2009) at the same frequency. We expect a shortage due to missing flux from short uv spacings. We also recovered an integrated flux of Jy from our linear polarization map after primary beam correction, in excellent agreement with the VLA observations of Reynolds & Gilmore (1993). Their images also include central emission in excess of that found in our images. Indeed, the integration time, bandwidth and uv coverage of differing observations, array configurations, and interferometers can result in images with different background noise levels and integrated flux densities, but we must also note here that the use of different image processing techniques can too. To verify the integrity of our process and resulting images, we processed our VLA and ATCA data separately, and found that the polarization maps were also similar. We are confident the combined reduction did not corrupt the resulting polarization maps, and the combination of VLA and ATCA visibility data actually improved the overall sensitivity toward small-scale structure, as can be appreciated, for example, towards the background source ESO 328-IG 013 (section 3.1).
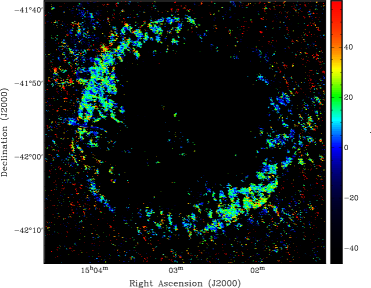
As mentioned above, the polarization position angle maps at the two frequencies were combined by IMPOL to form a rotation measure (RM) map that could be used to derotate the position angles in order to derive the intrinsic direction of the electric field vectors. Earlier work by Dickel & Milne (1976) and Reynolds & Gilmore (1993) show that the RM toward SN 1006 does not cause position angles to wrap more than 2 radians, so we computed the RM for each pixel using only two frequencies, assuming no radian ambiguities. The resulting image is shown in Fig. 2. We found that the distribution of RM values across both the NE and SW lobes of the shell is well represented by a Gaussian distribution centered at 12 rad m-2, with a deviation of 20 rad m-2. This level of deviation is expected, considering that the use of a cutoff in the Stokes Q and U maps corresponds to a position angle error of 14 degrees. Inspecting each lobe separately, we find that the RM distributions peak at 12 rad m-2 and 14.5 rad m-2 for the NE and SW lobes respectively. We found no evidence of significant differences of the RM value in each lobe, unlike that found in G296.5+10.0 (Harvey-Smith et al. 2010), another high-latitude bi-polar SNR whose RM varies significantly, from in one of the lobes to +44 rad m-2 in the other one. In G296.5+10.0, the difference is attributed to a toroidal magnetized wind from the progenitor, which is not the case for SN 1006, where the similarity in the RM values for both lobes is quite reasonable considering the symmetry of the source.
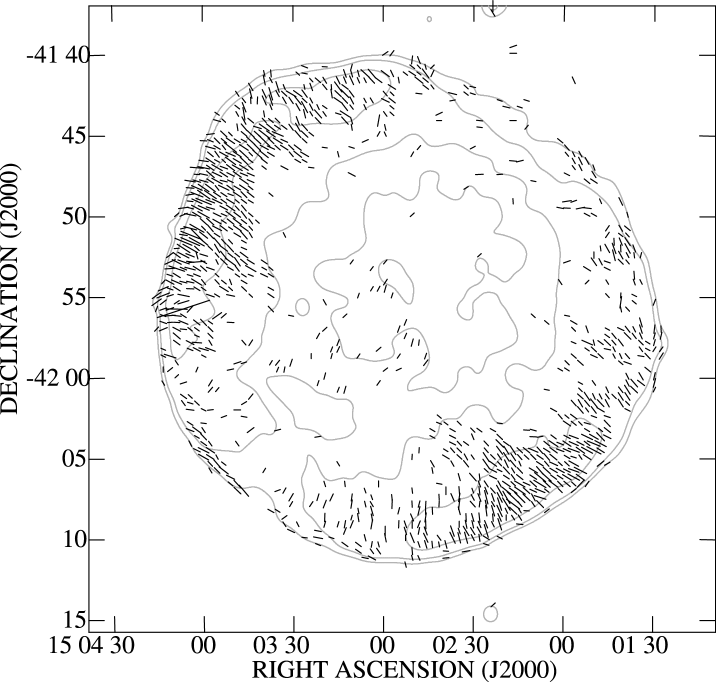
Our RMs agree with previous polarization studies within the quoted errors. Reynolds & Gilmore (1993) found an RM of rad m-2 on the NE lobe, and rad m-2 on the SW lobe. A single-dish polarization study by Milne (1971) at 2.7 and 5.0 GHz yielded RM values of rad m-2 in the NE, and rad m-2 in the SW, although a re-analysis of similar data by Dickel & Milne (1976) had an error of 23 rad m-2. While the RM appears different on average between the two lobes, they are not significantly so. Using the assumption that our average RM value of 12 rad m-2 was uniformly distributed over the remnant, the lowest frequency polarization position angle map was derotated to the position angle at zero frequency, and further rotated 90∘ to display the orientation of the magnetic field. The resulting magnetic vector map is shown in Fig. 3. Pixels were blanked where the flux density fell below 10 mJy beam-1 in a total intensity image convolved to 60 arcsec. The magnetic vectors show an overall radial direction, and appear very much the same as reported by Reynolds & Gilmore (1993).
3 Results
3.1 Fractional polarization
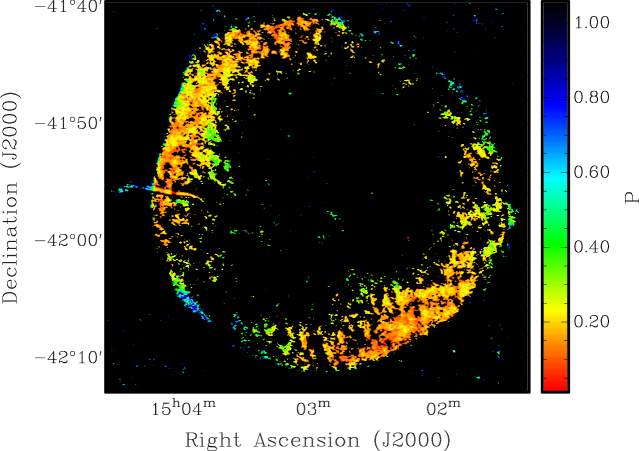
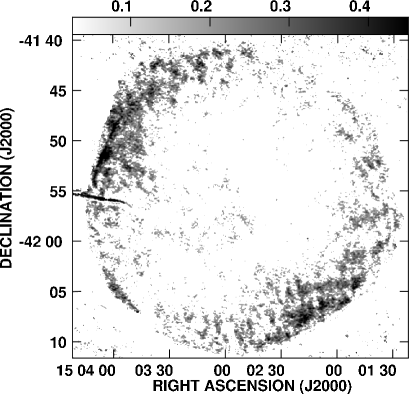
Figure 4 shows the distribution of the fractional polarization , computed as described in the previous Section. The map was compared to the error map , and those pixels for which the ratio were blanked. In this image, unpolarized emission is represented in red. The average fractional polarization in the SE and NW lobes is . Reynolds & Gilmore (1993) note that since their images do not include single dish observations, a smooth component of the total intensity is missing, so that if all the polarized flux is assumed to be detected, the fractional polarization measured is only an upper limit. They discuss this problem and conclude that the ratio maps must show values very close to the true ones, especially near the rim. Since the total flux we measure is much closer to the real one, the fractional polarization should be accordingly closer to its true value.

Reynolds & Gilmore (1993) called attention to a faint arc on the SE rim visible in the Stoke parameter Q map that closely follows the circular rim of the shell. The authors argued that this feature is real, however their sensitivity did not allow them to provide additional information about its morphology or polarization properties. We have examined our Q image and found that the highest emission occurs at an arc that extends from 113∘ to 180∘ at a radius of 880 arcsec centered at RA(2000)= 15h2m5336, Dec.(2000)= 56′25′′. Between 113∘ and 140∘, the emission at the arc is several times above the noise, while the rest of the feature is weaker. In Fig. 5 we show the average emission in the Q parameter on 4-arcsec wide annuli from the center over the sector defined by the full arc. The azimuthal average clearly enhances the emission at the arc, confirming that this feature is real. The same result is observed when only the weakest part of the arc is considered (dashed line in Fig. 5). In Fig. 4, this feature appears to be highly polarized, with , where the uncertainty is the RMS of the observed polarization fractions rather than the error on the mean. High polarization is also observed at the NW rim. These results will be discussed in the next section.
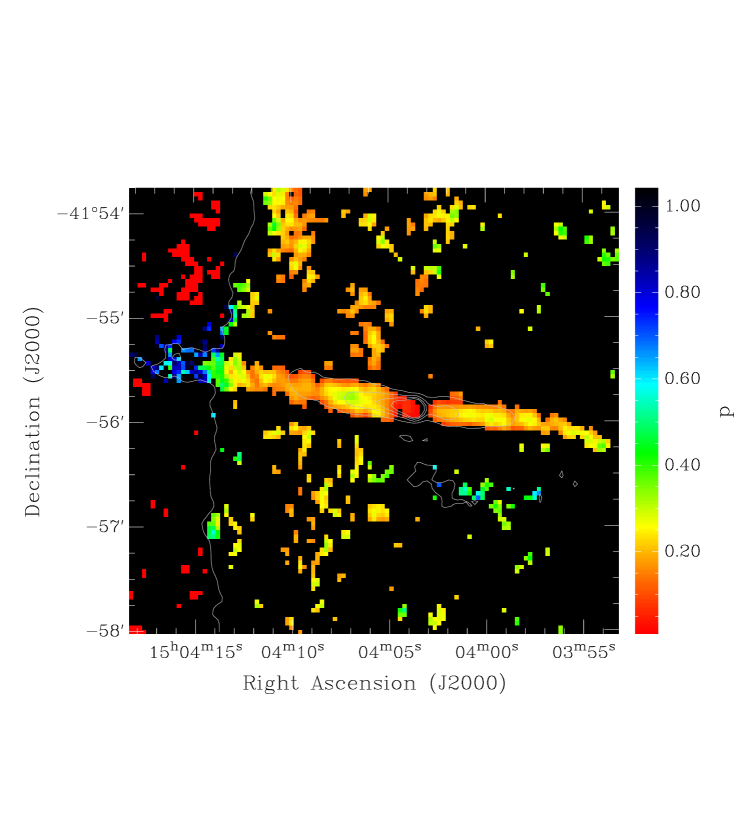
Finally, these observations allowed us to measure the polarization of a bright extragalactic source that lies on the remnant’s shell at a position angle of about 90∘. This source is cataloged in NED as ESO 328-IG 013, an interacting galaxy (Lauberts 1982); it is also coincident with a 2MASS galaxy (2MASX J150403644155511) at a redshift of and is also likely the radio source PMN J15034145. Reynolds & Gilmore (1993) noted that the fractional polarization was too high to be interpreted as the core of a radio galaxy or quasar. In fact, they found a fractional polarization of about 11% because they could not resolve the core of this elongated source. Our data reveal two polarized jets emerging from a clearly unpolarized core (Fig. 6). The jets extend for at least 2′ (100 kpc) and have typical polarizations of 18%5% on the shell of SN 1006 and 65%15% beyond the rim, and the core has 3%0.8%, more in line with the value expected for the core of an extragalactic source (e.g., Saikia 1999). The high polarization of that portion of the jet that lies beyond the rim is probably close to its true intrinsic value; however, over most of its extent the jet is superposed on the SNR emission which makes the fractional polarization appear lower than its true value. To support this argument, we note the remarkable difference between the flux density of the galaxy just to the East of the edge of SN 1006 ( mJy beam-1) and immediately to the West ( mJy beam-1), while the polarized flux for the same regions is about 0.46 and 0.52 mJy beam-1 respectively. Moreover, the flux of SN 1006 just to the North and South of the galaxy in the inner border of the shell varies between 1.3 and 1.5 mJy beam-1, implying that there is a major contribution from the SNR to the flux measured on the galaxy. The contribution from the SNR decreases slowly along 1 arcmin inwards from the SNR edge, and much faster as it gets closer to the core of the galaxy. At the core, the flux density of the galaxy is 20 times higher than the SNR. A detailed study of the polarization measurements on ESO 328-IG 013 will be the subject of a separate paper.
3.2 Magnetic Field Orientation
Figure 3 shows the distribution of magnetic vectors after combining the ATCA and VLA polarization observations. A comparison with Fig. 8 in Reynolds & Gilmore (1993), where only VLA observations were used, shows a close agreement in those regions where data are available, although they detected higher levels of polarized emission in the center of the remnant. Based on previous studies, in which polarized emission could only be detected on the brightest lobes, it was suggested that the magnetic fields were predominantly radial. There were, nevertheless, hints from Reynolds & Gilmore (1993) of a non-radial field orientation along the faint SE rim based on two, barely significant, magnetic field vectors. Our data allow us to gain insight on the details of the magnetic field distribution at the outer rim and at the lowest intensity regions in the SE and NW.
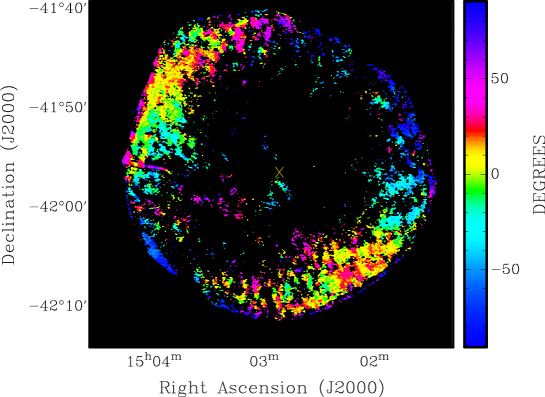
In order to determine whether the orientation of the magnetic field is radial along the whole SNR, we computed the angular difference between each magnetic vector and the radial direction, a polar-referenced angle, by adopting a polar coordinate system centered at the SNR’s nominal center, located by Reynolds & Gilmore (1986) and Winkler & Long (1997) at RA(2000)= 15h2m517, Dec.(2000)= 56′33′′. The polar-referenced angle varies between 90∘ and ; it is negative for a clockwise shift with respect to the radial direction and positive for a counter-clockwise shift. Since the two extreme angular values represent the same orientation (tangential), we used a color scheme that allows us to visualize both with the same color. In the plot shown in Fig. 7(a), yellow and green colors correspond to radial magnetic field orientations, while blue colors indicate tangential ones. It is clear that the overwhelmingly radial direction in the bright lobes is not preserved in the SE and NW, where the orientation is predominantly tangential. Even in the lobes, there are some departures from the radial direction, mainly at the rim.
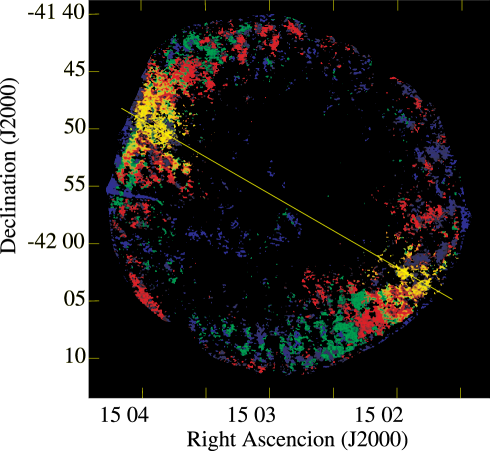
Furthermore, we selected only those pixels with radial field orientations within , which is the error in the position angle (Section 2), and plotted them in green in Fig. 7(b). We also selected vectors parallel to the Galactic Plane, which lies at a fixed angle of (counterclockwise from North) as projected in this image, and overplotted them in red. In both cases, the scale is such that pixels in the limits of the tolerance interval are displayed with the lowest intensity. Finally, pixels not belonging to any of these two groups are overplotted in blue. In this case, the faintest pixels correspond to angles closest to the Galactic Plane direction. Along this direction (yellow line in Fig. 7(b)), pixels appear in yellow, clearly indicating that the magnetic vectors there fulfill both criteria.

We examined the distribution of polar-referenced magnetic field direction (Fig. 7(a)) solely using information from pixels within the NE, SW and SE regions of SN 1006. We extracted the information from the bright lobes using pixels within two radial wedges with azimuth ranges from 20∘ to 100∘ (NE) and 170∘ to 250∘ (SW), and radial ranges from 540 to 860 arcsecs from the center. We found that the distributions peak at 9∘ in the NE lobe and -4∘ in the SW lobe, with standard deviations, , of 20∘ and 25∘, respectively. We extracted information from pixels in the SE using a radial wedge with an azimuth range from 113∘ to 147∘ , and a radial range from 865 to 920 arcsec from center. We shifted the difference angle range from [∘, 90∘] to [0∘, 180∘], a more appropriate range for identifying magnetic fields that are tangential (purely tangent would then be 90∘). The distribution in the SE peaks at ∘, with a standard deviation of 18∘, clearly consistent with a tangential orientation.
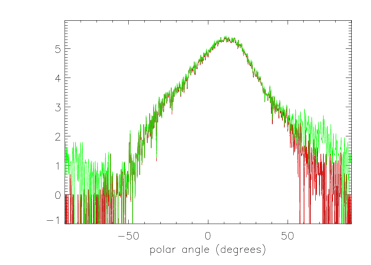
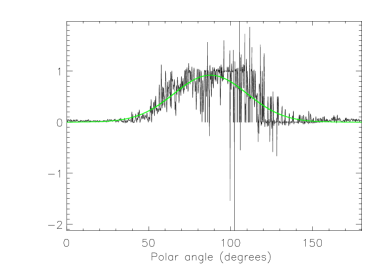
A surprising result is obtained if the outer radius of the SW lobe sector is extended so as to include the outer rim (see Fig. 8). In Fig. 8, the logarithmic distribution of polar-referenced field angles, including only the inner sector (radius of 860 arcsec) is plotted in red, while the green line displays the distribution at a radius of 920 arcsecs. While the distribution is the same for polar referenced angles between approximately ∘ and 50∘, there is a clear excess of more oblique vectors when the region with radii between 860 and 920 arcsecs is included. To further highlight this trend, in Fig. 8 we plot the polar referenced angle distribution from only the radial range between 860 and 920 arcsec (with the distribution shifted to the range [0∘, 180∘] as before). A simple Gaussian fit (albeit crude given the evident non-Gaussian nature of the distribution) gives a peak at ∘ with a deviation of 30∘. Although more sensitive polarization observations are desirable to confirm this result, it is worth noting that indications of a tangential magnetic field at the outer edge have also been reported in the Cassiopeia A SNR (Gotthelf et al. 2001).
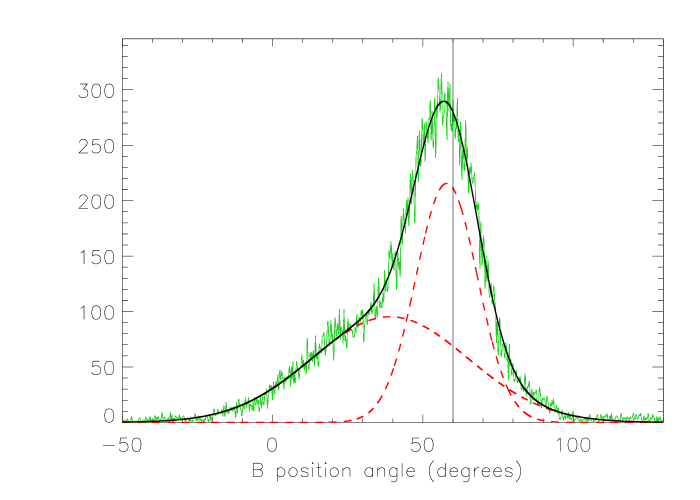
Finally, we examined the distribution of magnetic field orientation with respect to the direction of the Galactic Plane. The distribution, shown in Fig. 9, can be reasonably well fitted by the sum of a constant term and two Gaussians (red, dashed lines): a broad one centered at and a narrow one centered at . The result is represented by the green line. The vertical solid line overlaid at corresponds to the position angle of the Galactic Plane in this direction. In Fig. 10, we consider only the two bright lobes, which provide a similar result: 47% of the magnetic vectors are clustered around , while the rest fall in a broad component centered at .
4 Discussion
Milne (1987) reviewed observations of polarized radio emission for 27 SNRs and by examining their projected magnetic fields, concluded that young remnants have radial magnetic fields while well-defined tangential fields are seen only in older SNRs. Subsequent observations (e.g., Reynoso et al. 1997; Landecker et al. 1999; Wood et al. 2008) have supported this picture. In the case of SN 1006, the magnetic field orientation could only be measured on the bright lobes (Reynolds & Gilmore 1993, and references therein) and, as expected for a young SNR, was found to be radial. These studies left open the question of whether fainter regions of the shell had a radial field as well.
If the projected magnetic field were radial all around the shell, then the measured position angles with respect to North should be uniformly distributed between 90∘ and 90∘. However, considering that most of the information on the magnetic field in SN 1006 comes approximately from the first and third quadrants (the NE and SW bright lobes), there will be a bias in the distribution favoring position angles between 0∘ and 90∘. While the broad Gaussian centered at 45∘ in Fig. 9 is not conclusive support for this model, the narrow component near is clearly at odds with it. When we reproduce the histogram for azimuthal sectors of width over the lobes, the fixed angle component near is found in most, but not all, of the sectors.
Examination of Fig. 7(b) clarifies the situation, showing clearly that the pattern of magnetic field vector orientations is not uniform. Patches with a radial orientation (colored green) are found all along the northern lobe and partially in the southern lobe. On the other hand, regions with vectors parallel to the Galactic Plane (colored red) are found over practically all of the shell. (The pixels colored yellow are located where the local radial direction happens to match the fixed field direction.) The patches with radial and fixed field directions are interspersed throughout the bright lobes. There is no correlation between the magnetic field orientation and the fractional polarization in these patches. At the outermost edge of the remnant’s shell, several azimuthal sectors display orientations (coded in blue) which are neither radial nor parallel to the Galactic Plane, possibly pointing to the addition of a radial and a fixed Galactic component.
We have established that an important fraction of the magnetic field vectors in SN 1006 are parallel to a fixed angle near . This is particularly clear in the SE sector, where the magnetic field vector distribution is strongly dominated by a fixed field component at an angle of and a broadening width of . We draw the conclusion that the fixed angle component indicates the direction of the ambient magnetic field projected onto the plane of the sky, which in this case runs nearly parallel to the Galactic Plane. This allows us to answer the long-lasting question concerning which of the two competing models explains the bright lobes, , whether they arise from a limb-brightened equatorial belt or two polar caps. Our study finds that the two bright lobes in SN 1006 are actually polar caps.
The linear polarization fraction of an optically thin source emitting synchrotron radiation in a uniform field is limited by the following relation: . The mean spectral index for SN 1006 is = 0.6, so that the expected maximum value for is 70.5%. Such high values are not observed for SNRs. In general, is measured to be 10% – 15%, with higher values (35% – 50%) in just a few exceptional cases (Landecker et al. 1999; Dickel et al. 2000; Reynoso & Green 2007). The measured fractional polarization of the SW and NE lobes is about 17%, in agreement with previous polarization studies towards SN 1006 but far from the theoretical maximum. According to Burn (1966), this means that only 24% of the magnetic energy is in an ordered component. Therefore, even though the magnetic fields appear ordered at the level of our image resolution, the low fractional polarization indicates more generally that the fields on smaller scales are highly disorganized in these regions.
In contrast, the SE region of faint radio and non-existent X-ray synchrotron emission shows a high fractional polarization compatible with the theoretical expected value. This requires the emission region to host a highly ordered magnetic field, likely just the swept-up ambient field (see Cassam-Chenaï et al. 2008). Figs. 3 and 7(a) show that the magnetic field is mostly tangential at this faint region. This orientation was derived assuming a uniform RM for the whole SNR. Were the RM half the average value in this region, the vectors would rotate counter-clockwise by , but would still be close to the external magnetic field direction estimated from the bright lobes.
We can therefore link efficient particle acceleration and disordered, amplified magnetic fields with quasi-parallel shocks in the bright SW and NE lobes of SN 1006. Likewise, we link inefficient particle acceleration and highly-ordered swept-up magnetic fields with quasi-perpendicular shocks in the faint SE rim. This scenario is also in agreement with the recent detection of very high energy -rays at the lobes (Acero et al. 2010). Petruk et al. (2012) consider the coincidence between the radio, X-rays and -ray emission as possible evidence for a leptonic origin of the -rays, and set upper limits to the magnetic field strength of a few hundred micro-gauss, which are less constraining than previous determinations (see Petruk et al. 2012, and references therein).
The radial magnetic fields usually observed in young SNRs have been ascribed to amplification along the Rayleigh-Taylor fingers developed at the interface between the shocked ambient medium and the ejecta (e.g., Jun & Norman 1996). However, we have found that the radial distribution is only partially observed in the bright lobes of SN 1006. Dolginov et al. (2004) solved the nonlinear problem of the generation of a magnetic field by particles accelerated in a MHD shock front. Their model is based on the assumption of uniform stationary particle injection, which is probably suitable for SN 1006 due to the low density and homogeneity of the ambient medium, far as it is from the Galactic Plane. They found that when the ambient magnetic field has a component perpendicular to the shock front, the parallel component is destroyed by the secondary field generated by the accelerated particles, resulting in a radial field distribution. Our results for the bright lobes suggest that this rearrangement is not complete and a fraction of the original field survives as inferred from the peak near in the distribution of magnetic field directions. On the other hand, if the shock front were parallel to the ambient magnetic field, Dolginov et al. (2004) find a second possible solution in which the field is not suppressed but, instead, is amplified and can be two orders of magnitude stronger than the mean value measured in the cold and warm phases of the ISM. We offer the following comments, based on the properties of the SE sector of SN 1006, where the observed field is nearly parallel to the shock front. First, Cassam-Chenaï et al. (2008) showed that the faint radio surface brightness there could be accounted for by a small injection rate of particles into the acceleration process (corresponding to 10% of the shock energy going into accelerated particles) and shock compression by a factor of 4 of a typical 3 G ambient ISM magnetic field. In other words no magnetic field amplification appears to be required in the SE sector. Second, the high degree of radio polarization we find in the current study requires that the post-shock magnetic field be highly uniform. The interpretation we favor is that particle acceleration and the generation of turbulent magnetic field are inefficient at the SE rim of SN 1006.
We take the fixed angle component observed almost all along the SNR shell as a strong indication of the ambient magnetic field direction. The prevalence of this direction at the highly polarized SE arc, which can be explained by the second solution of Dolginov et al. (2004), further supports this hypothesis. The patchy distribution of regions with either fixed angle or radial magnetic vectors, which is a surprising result of our study, remains to be understood.
5 Conclusions
We have presented a new radio polarization study of SN 1006 that has unveiled new features related to the polarization fraction and magnetic field direction of both the SNR and the surrounding ISM. These findings have implications for DSA theory. We found that the brightest radio, X-ray, and TeV -ray features have the lowest polarization fractions, indicating the presence of a disordered, turbulent magnetic field precisely in the regions where particle acceleration is most efficient. Moreover, the SE region of the shell, with very faint synchrotron emission, shows a fractional polarization close to the theoretical maximum value for an optically thin source, indicating a highly ordered magnetic field at a location where particle acceleration is very inefficient (Cassam-Chenaï et al. 2008). While most of the SNR shell appears to have a radial magnetic field distribution, we have found that a significant portion of the distribution share a single angle of , which in turn coincides with the Galactic Plane direction. In the SE sector the distribution of magnetic field directions is consistent with a single component at an angle of . Overall, the evidence points to an ambient magnetic field roughly parallel to the Galactic Plane, of which the SNR retains some knowledge even after the passage of the shock front. The portions of SN 1006 where the shocks are quasi-parallel are more efficient at producing particle acceleration and generating magnetic turbulence; elsewhere where the shocks are quasi-perpendicular particle acceleration is inefficient and there is little turbulent magnetic field generation. Finally, given these results, considerations of geometrical symmetry clearly establish that, rather than being the limb-brightened edges of an equatorial belt, the bright synchrotron emitting lobes in SN 1006 are polar caps.
Acknowledgements
The authors acknowledge the anonymous referee for comments that improved the presentation of our results. We also thank Roger Blandford and Stephen Reynolds for their critical reading of the manuscript. E. M. R. is partially supported by grants PIP 114-200801-00428 (CONICET) and UBACyT 20020090200039. D. A. M. acknowledges support from a Furman University RPG Grant. The National Radio Astronomy Observatory is a facility of the National Science Foundation operated under cooperative agreement by Associated Universities, Inc. The Australia Telescope is funded by the Commonwealth of Australia for operation as a National Facility managed by CSIRO. This research has made use of the NASA/IPAC Extragalactic Database (NED) which is operated by the Jet Propulsion Laboratory, California Institute of Technology, under contract with the National Aeronautics and Space Administration.
References
- Acero et al. (2010) Acero, F., Aharonian, F., Akhperjanian, A. G., Anton, G., Barres de Almeida, U., Bazer-Bachi, A. R., Becherini, Y., Behera, B., Beilicke, M., Bernlöhr, K., Bochow, A., Boisson, C., Bolmont, J., Borrel, V., Brucker, J., Brun, F., Brun, P., Bühler, R., Bulik, T., Büsching, I., Boutelier, T., Chadwick, P. M., Charbonnier, A., Chaves, R. C. G., Cheesebrough, A., Conrad, J., Chounet, L., Clapson, A. C., Coignet, G., Dalton, M., Daniel, M. K., Davids, I. D., Degrange, B., Deil, C., Dickinson, H. J., Djannati-Ataï, A., Domainko, W., O’C. Drury, L., Dubois, F., Dubus, G., Dyks, J., Dyrda, M., Egberts, K., Eger, P., Espigat, P., Fallon, L., Farnier, C., Fegan, S., Feinstein, F., Fiasson, A., Förster, A., Fontaine, G., Füsling, M., Gabici, S., Gallant, Y. A., Gérard, L., Gerbig, D., Giebels, B., Glicenstein, J. F., Glück, B., Goret, P., Göring, D., Hauser, D., Hauser, M., Heinz, S., Heinzelmann, G., Henri, G., Hermann, G., Hinton, J. A., Hoffmann, A., Hofmann, W., Hofverberg, P., Holleran, M., Hoppe, S., Horns, D., Jacholkowska, A., de Jager, O. C., Jahn, C., Jung, I., Katarzyński, K., Katz, U., Kaufmann, S., Kerschhaggl, M., Khangulyan, D., Khélifi, B., Keogh, D., Klochkov, D., Kluźniak, W., Kneiske, T., Komin, N., Kosack, K., Kossakowski, R., Lamanna, G., Lemoine-Goumard, M., Lenain, J., Lohse, T., Marandon, V., Marcowith, A., Masbou, J., Maurin, D., McComb, T. J. L., Medina, M. C., Méhault, J., Moderski, R., Moulin, E., Naumann-Godo, M., de Naurois, M., Nedbal, D., Nekrassov, D., Nicholas, B., Niemiec, J., Nolan, S. J., Ohm, S., Olive, J., de Oña Wilhelmi, E., Orford, K. J., Ostrowski, M., Panter, M., Paz Arribas, M., Pedaletti, G., Pelletier, G., Petrucci, P., Pita, S., Pühlhofer, G., Punch, M., Quirrenbach, A., Raubenheimer, B. C., Raue, M., Rayner, S. M., Reimer, O., Renaud, M., de Los Reyes, R., Rieger, F., Ripken, J., Rob, L., Rosier-Lees, S., Rowell, G., Rudak, B., Rulten, C. B., Ruppel, J., Ryde, F., Sahakian, V., Santangelo, A., Schlickeiser, R., Schöck, F. M., Schönwald, A., Schwanke, U., Schwarzburg, S., Schwemmer, S., Shalchi, A., Sushch, I., Sikora, M., Skilton, J. L., Sol, H., Stawarz, Ł., Steenkamp, R., Stegmann, C., Stinzing, F., Superina, G., Szostek, A., Tam, P. H., Tavernet, J., Terrier, R., Tibolla, O., Tluczykont, M., van Eldik, C., Vasileiadis, G., Venter, C., Venter, L., Vialle, J. P., Vincent, P., Vink, J., Vivier, M., Völk, H. J., Volpe, F., Vorobiov, S., Wagner, S. J., Ward, M., Zdziarski, A. A., Zech, A., & HESS Collaboration. 2010, A&A, 516, A62+
- Acero et al. (2007) Acero, F., Ballet, J., & Decourchelle, A. 2007, A&A, 475, 883
- Axford et al. (1977) Axford, W. I., Leer, E., & Skadron, G. 1977, in International Cosmic Ray Conference, Vol. 11, International Cosmic Ray Conference, 132–137
- Bell (1978a) Bell, A. R. 1978a, MNRAS, 182, 147
- Bell (1978b) —. 1978b, MNRAS, 182, 443
- Bell (2004) —. 2004, MNRAS, 353, 550
- Bell & Lucek (2001) Bell, A. R. & Lucek, S. G. 2001, MNRAS, 321, 433
- Blandford & Ostriker (1978) Blandford, R. D. & Ostriker, J. P. 1978, ApJ, 221, L29
- Burn (1966) Burn, B. J. 1966, MNRAS, 133, 67
- Cassam-Chenaï et al. (2008) Cassam-Chenaï, G., Hughes, J. P., Reynoso, E. M., Badenes, C., & Moffett, D. 2008, ApJ, 680, 1180
- Decourchelle et al. (2000) Decourchelle, A., Ellison, D. C., & Ballet, J. 2000, ApJ, 543, L57
- Dickel & Milne (1976) Dickel, J. R. & Milne, D. K. 1976, Australian Journal of Physics, 29, 435
- Dickel et al. (2000) Dickel, J. R., Milne, D. K., & Strom, R. G. 2000, ApJ, 543, 840
- Dolginov et al. (2004) Dolginov, A. Z., Podol’Skaya, N. I., & Toptygin, I. N. 2004, Astronomy Letters, 30, 169
- Dyer et al. (2009) Dyer, K. K., Cornwell, T. J., & Maddalena, R. J. 2009, AJ, 137, 2956
- Dyer et al. (2004) Dyer, K. K., Reynolds, S. P., & Borkowski, K. J. 2004, ApJ, 600, 752
- Ellison et al. (1995) Ellison, D. C., Baring, M. G., & Jones, F. C. 1995, ApJ, 453, 873
- Fulbright & Reynolds (1990) Fulbright, M. S. & Reynolds, S. P. 1990, ApJ, 357, 591
- Ghavamian et al. (2002) Ghavamian, P., Winkler, P. F., Raymond, J. C., & Long, K. S. 2002, ApJ, 572, 888
- Gotthelf et al. (2001) Gotthelf, E. V., Koralesky, B., Rudnick, L., Jones, T. W., Hwang, U., & Petre, R. 2001, ApJ, 552, L39
- Harvey-Smith et al. (2010) Harvey-Smith, L., Gaensler, B. M., Kothes, R., Townsend, R., Heald, G. H., Ng, C.-Y., & Green, A. J. 2010, ApJ, 712, 1157
- Jokipii (1987) Jokipii, J. R. 1987, ApJ, 313, 842
- Jun & Norman (1996) Jun, B.-I. & Norman, M. L. 1996, ApJ, 472, 245
- Krymskii (1977) Krymskii, G. F. 1977, Akademiia Nauk SSSR Doklady, 234, 1306
- Kundu (1970) Kundu, M. R. 1970, ApJ, 162, 17
- Landecker et al. (1999) Landecker, T. L., Routledge, D., Reynolds, S. P., Smegal, R. J., Borkowski, K. J., & Seward, F. D. 1999, ApJ, 527, 866
- Lauberts (1982) Lauberts, A. 1982, The ESO/Uppsala Survey of the ESO(B) Atlas, (Munich: European Southern Observatory)
- Malkov & O’C Drury (2001) Malkov, M. A. & O’C Drury, L. 2001, Reports on Progress in Physics, 64, 429
- Milne (1971) Milne, D. K. 1971, Australian Journal of Physics, 24, 757
- Milne (1987) —. 1987, Australian Journal of Physics, 40, 771
- Petruk et al. (2011) Petruk, O., Beshley, V., Bocchino, F., Miceli, M., & Orlando, S. 2011, MNRAS, 413, 1643
- Petruk et al. (2009) Petruk, O., Dubner, G., Castelletti, G., Bocchino, F., Iakubovskyi, D., Kirsch, M. G. F., Miceli, M., Orlando, S., & Telezhinsky, I. 2009, MNRAS, 393, 1034
- Petruk et al. (2012) Petruk, O., Kuzyo, T., & Bocchino, F. 2012, MNRAS, 419, 608
- Reynolds & Gilmore (1986) Reynolds, S. P. & Gilmore, D. M. 1986, AJ, 92, 1138
- Reynolds & Gilmore (1993) —. 1993, AJ, 106, 272
- Reynoso & Green (2007) Reynoso, E. M. & Green, A. J. 2007, MNRAS, 375, 92
- Reynoso et al. (1997) Reynoso, E. M., Moffett, D. A., Goss, W. M., Dubner, G. M., Dickel, J. R., Reynolds, S. P., & Giacani, E. B. 1997, ApJ, 491, 816
- Rothenflug et al. (2004) Rothenflug, R., Ballet, J., Dubner, G., Giacani, E., Decourchelle, A., & Ferrando, P. 2004, A&A, 425, 121
- Saikia (1999) Saikia, D. J. 1999, MNRAS, 302, L60
- Sault et al. (1995) Sault, R. J., Teuben, P. J., & Wright, M. C. H. 1995, in Astronomical Society of the Pacific Conference Series, Vol. 77, Astronomical Data Analysis Software and Systems IV, ed. R. A. Shaw, H. E. Payne, & J. J. E. Hayes, 433–+
- Schneiter et al. (2010) Schneiter, E. M., Velázquez, P. F., Reynoso, E. M., & de Colle, F. 2010, MNRAS, 408, 430
- Stephenson & Green (2002) Stephenson, F. R. & Green, D. A. 2002, Historical supernovae and their remnants, (Oxford: Clarendon Press)
- Warren et al. (2005) Warren, J. S., Hughes, J. P., Badenes, C., Ghavamian, P., McKee, C. F., Moffett, D., Plucinsky, P. P., Rakowski, C., Reynoso, E., & Slane, P. 2005, ApJ, 634, 376
- Winkler et al. (2003) Winkler, P. F., Gupta, G., & Long, K. S. 2003, ApJ, 585, 324
- Winkler & Long (1997) Winkler, P. F. & Long, K. S. 1997, ApJ, 491, 829
- Wood et al. (2008) Wood, C. A., Mufson, S. L., & Dickel, J. R. 2008, AJ, 135, 2358