Structure and dynamics in yttrium-based molten rare earth alkali fluorides
Abstract
The transport properties of molten LiF-YF3 mixtures have been studied by pulsed field gradient nuclear magnetic resonance spectroscopy, potentiometric experiments, and molecular dynamics simulations. The calculated diffusion coefficients and electric conductivities compare very well with the measurements across a wide composition range. We then extract static (radial distribution functions, coordination numbers distributions) and dynamic (cage correlation functions) quantities from the simulations. Then, we discuss the interplay between the microscopic structure of the molten salts and their dynamic properties. It is often considered that variations in the diffusion coefficient of the anions are mainly driven by the evolution of its coordination with the metallic ion (Y3+ here). We compare this system with fluorozirconate melts and demonstrate that the coordination number is a poor indicator of the evolution of the diffusion coefficient. Instead, we propose to use the ionic bonds lifetime. We show that the weak Y-F ionic bonds in LiF-YF3 do not induce the expected tendency of the fluoride diffusion coefficient to converge toward the one of yttrium cation when the content in YF3 increases. Implications on the validity of the Nernst-Einstein relation for estimating the electrical conductivity are discussed.
I Introduction
Molten salts are liquid mixtures of ionic species at high temperatures. They receive much attention due to their diverse but promising applications that range from metal production Groult et al. (2008, 2011); Cassayre et al. (2010), the pyrochemical treatment of nuclear waste Hamel et al. (2007); Salanne et al. (2008); Taxil et al. (2009); Fukasawa et al. (2012), primary or secondary coolants in several concepts of generation IV fission Waldrop (2012) and fusion Ihli et al. (2008) nuclear reactors, and electricity storage devices Bradwell et al. (2012).
In the context of nuclear applications, the nuclear reactions produce rare earth elements in the core. From the neutronic point of view, these have a poisoning effect and must therefore be eliminated. One of the advantages of most of the concepts of reactors based on molten salts, including the promising thorium-fueled molten salt fast reactor (MSFR) is that their fuel is dissolved in the primary coolant (which is the molten salt) Mathieu et al. (2006); Delpech et al. (2009). Such liquid state fuel allows for the elimination and reprocessing of several fission products and rare earth elements during the reactor operation, via chemical or electrochemical methods Gibilaro et al. (2009); Chamelot et al. (2010). One drawback is the complex handling of the molten salt fuel inside the (recycling) circuit: important care must be taken for controlling the physico-chemical conditionsLevesque et al. (2012); Gupta et al. (2012), and additional efforts have to be made on the development of adapted structure materials Waldrop (2012); Levesque et al. (2011); Levesque (2013).
The knowledge on molten fluoride salts chemistry has long remained fragmented and limited to a few experimental techniques (mainly electrochemical ones) due to experimental hindrances. One has to deal with high temperatures (from 500 K to 1800 K) and to control the corrosive properties by setting up original experiments. Many efforts have been made towards this direction and several experimental techniques have been adapted to the study of molten salts. The development of new cells has unlocked the study of molten fluorides by EXAFS spectroscopy Rollet et al. (2004a), which, coupled to other spectroscopic methods such as nuclear magnetic resonnance (NMR) Lacassagne et al. (2002); Bessada et al. (2006) or Raman Toth et al. (1973); Dracopoulos and Papatheodorou (2000), is able to provide a view of the local structure in these melts. As for the dynamic properties, similar improvements have been made and the self-diffusion coefficients can be measured up to 1500 K by pulsed field gradient nuclear magnetic resonance (PFG-NMR) Rollet et al. (2009, 2010). Such measurements are important since the diffusion coefficients provide an information on the individual dynamics of the ions, complementing the viscosity or electrical conductivity measurements which inform about the collective dynamics of the macroscopic system.
During the past decade, these experimental efforts have been accompanied by the development of simulation tools adapted to the study of molten fluorides and chlorides, namely density functional theory Benes et al. (2009), thermodynamic modeling Benes and Konings (2009); Robelin and Chartrand (2013); Dewan et al. (2013) and molecular dynamics (MD) Salanne et al. (2007); Ohtori et al. (2009). Among those, the latter has proven to be efficient for the study of the structure and dynamics of the system at the microscopic scale, allowing the interpretation of experimental results Salanne et al. (2006); Sarou-Kanian et al. (2009); Pauvert et al. (2011) and the prediction of quantities that hitherto remained unknown Dewan et al. (2013). The simulations are based a polarizable ion model, which has strong physical grounds Salanne and Madden (2011); Madden and Wilson (1996); Madden et al. (2006) and can efficiently be parameterized from first-principles Salanne et al. (2012); Aguado et al. (2003); Rotenberg et al. (2010), i.e., without having empirically recourse to any experimental data.
In this work, we combine state-of-the-art experimental and simulation tools to study a series of LiF-YF3 molten salts of varying compositions. We first describe shortly the methodological aspects. Then, we compare measured and calculated self-diffusion coefficients and electrical conductivity to show that MD simulations are in quantitative agreement with experiments, which allows for further use of the simulations to discuss the interplay between the microscopic structure of the electrolytes and their dynamic properties.
II Methods
II.1 Pulsed field gradient nuclear magnetic resonance
Mixtures of LiF and YF3 salts (purity %) were prepared in a glove box under argon in order to avoid H2O and O2 contamination of the samples. We use boron nitride (BN) crucibles to confine the salts, and to prevent them from any chemical reaction. The amount of salt in each crucible is ca. 50 mg. The BN crucible is heated by a symmetrical irradiation with two CO2 lasers. The laser power is increased progressively until the target temperature is reached.
The high temperature PFG NMR spectra were recorded using a Bruker Avance WB 400 MHz operating at 9.40 T. An argon stream prevents oxidation of the BN at high temperature. The 10 mm liquid NMR probe is specially designed by Bruker and adapted in CEMHTI to work up to 1500 K. It is equipped with a gradient coil providing 5.5 GcmA-1 that is combined with a gradient amplifier of 10 A. We use a NMR pulse sequence combining bipolar gradient pulses and stimulated echoCotts et al. (1989). It is repeated with 8 gradients of linearly increasing strength.
Measurements were performed using the following NMR parameters: durations of radiofrequency magnetic field application for pulses s (19F) and s (7Li), gradient strength was varied from 0 to 50 G/cm, gradient application time between 1 and 5 ms. For 7Li measurements, we used a pre-saturation cycle before the diffusion sequence because of the long relaxation time of this nucleus (25 s in pure molten LiF).
Finally, the self-diffusion coefficients were obtained by nonlinear least-square fitting of the echo attenuationCotts et al. (1989).
II.2 Electrical conductivity potentiometric measurements
The experimental setup used for measuring the electrical conductivity is described in details in reference Rollet et al. (2012); the conductivity cell configuration was derived from the one proposed by Hives and Thonstad Hives and Thonstad (2004). The conductivity was measured for LiF-YF3 mixtures with compositions ranging from = 0.00 to 0.18, at several temperatures. Here we report the results obtained for the 1130 K isotherm. All the details are given in the Supplementary Material Document No.1 si .
II.3 Molecular dynamics simulations
We use molecular dynamics (MD) to compute static and dynamic properties of the molten salt at the atomic scale. The MD simulations used therein rely on interatomic interaction potentials parameterized from first principles. The parameterization procedure is described elsewhere Salanne et al. (2012). They are of ab initio accuracy and have been successful in reproducing accurately the electrical conductivity, the heat capacity, the viscosity, etc, of various ionic materials (mainly molten fluorides and solid oxidesBurbano et al. (2012); Marrocchelli et al. (2012)). In the case of molten fluorides, the interaction potential is best described as the sum of four different components: charge-charge, dispersion, overlap repulsion, and polarization. The detailed description of the potential is given in the Supplementary Material Document No.1 si .
We studied 11 concentrations ranging from = 0.10 to 0.60 by steps of 0.05. Each system was simulated along two isotherms. The first one at 1130 K allows for comparison with experimental data. The other one at 1200 K allows for comparison with previous works on fluorozirconates Pauvert et al. (2010, 2011). For both temperatures, (i) the equilibrium volume was determined from a simulation in the isothermal–isobaric (NPT) ensemble with a target pressure of 1 atm, using the method described by Martyna et al. Martyna et al. (1994); (ii) production runs were then performed in the canonical (NVT) ensemble, Martyna et al. (1992) with a time step of 1.0 fs. The total simulation time was of 4 ns for the production runs for each system. The relaxation time of the thermostat was set to 20 ps. The simulation cell parameters and the number of atom of each species are summarized for each composition and temperature in the Supplementary Material Document No.1 si . The cut-off distance for the real space part of the Ewald sum Aguado and Madden (2003) and the short range potential was set to half the length () of the cubic simulation cell. The value of the convergence parameter in the Ewald sum was set equal to and 83 -vectors were used for the reciprocal space part calculation of the forces and potential energy.
III Transport properties
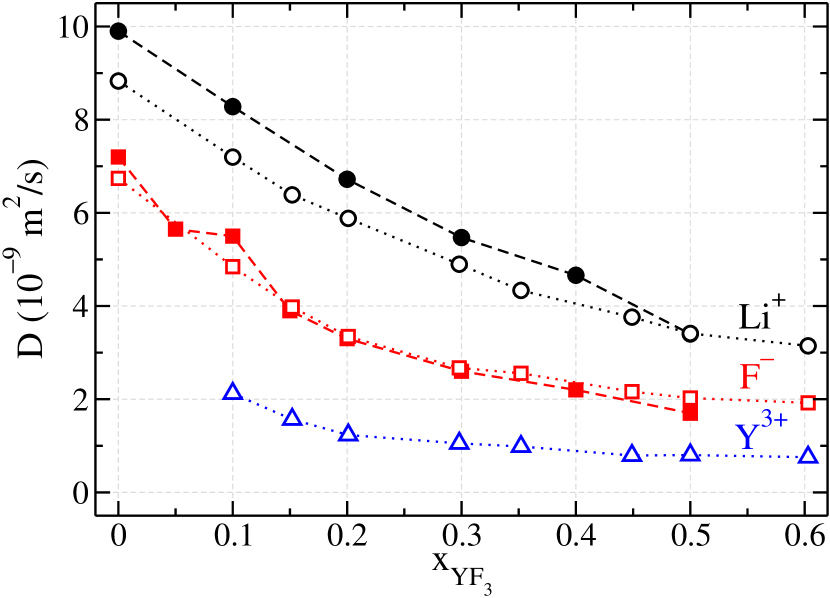
The self-diffusion coefficients of fluoride, lithium and yttrium ions along the 1130 K isotherm are presented in Fig. 1 as a function of the salt concentration. Both experimental and molecular dynamics results are presented for F- and Li+. For Y3+, the self-diffusion coefficient can only be measured from molecular simulations, due to the NMR characteristics of 89Y (low gyromagnetic ratio and long relaxation time up to 45 min). The self-diffusion coefficient of species is extracted from molecular dynamics simulations using Einstein’s relation, i.e., from the long-time slope of mean squared displacement:
| (1) |
where is the position of atom of type at time . The brackets denote an ensemble average over all trajectories and atoms of type . The self-diffusion of Li+ is about 60 % higher than that of F-, whatever the concentration. Excellent agreement is found between experiments and simulations. We can therefore be confident in the MD simulation results for Y3+. The latter value is about one third of the diffusion coefficient of Li+ over the whole range of compositions. All self-diffusion coefficients decrease at the same rate with the increase in yttrium fluoride concentration.
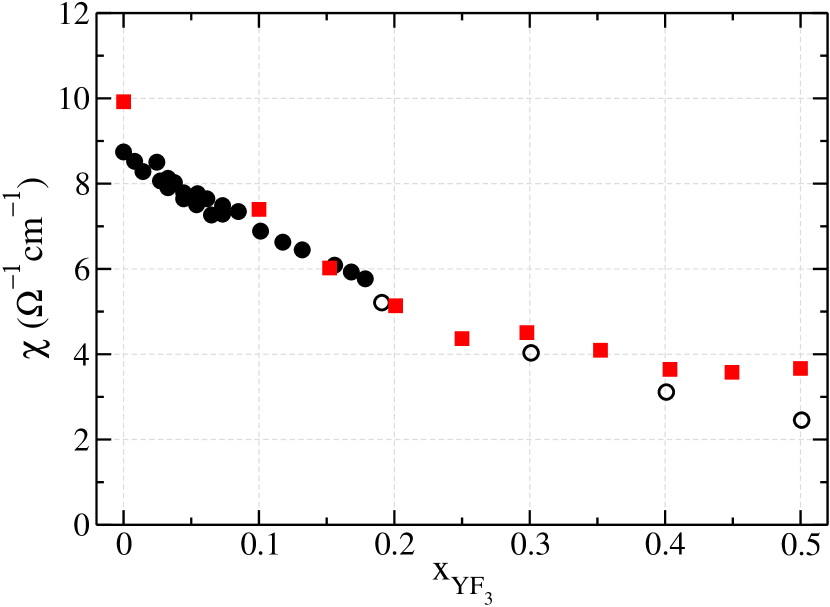
The electrical conductivities measured at a temperature of 1130 K are presented in Fig. 2 for different salt concentrations in YF3 and compared to experimental resultsJanz (1988). In molecular dynamics simulations, the electrical conductivity is calculated from
| (2) |
where with the Boltzmann constant, is the elementary charge, the volume of the cubic simulation cell of length , and is the net displacement of all the ions of species and charge in time . There are species here. The error bars associated to our calculations of the electrical conductivity from Eq. 2 are estimated to 10 %. Such high values are due to the collective nature of . It is not averaged over both the time steps and all the atoms of a given species, as self-diffusion coefficients are, and consequently require long simulations runs. The true electrical conductivity of Eq. 2 is thus often approximated by the Nernst-Einstein formulae, which relates to the individual diffusion coefficients of the various species in the liquid. Surprisingly, we find the electrical conductivity calculated from the Nernst-Einstein formulae to be overestimated by only 10 to 20 %. Larger differences, typically 40 %, are usually observed for such saltsBorucka et al. (1957); Harris (2010). Margulis et al. showed that the Nernst-Einstein relation always overestimates the conductivity in molten salts and ionic liquids because of conditions in the momentum balance that contraint the motion of ions of same charge to be anticorrelatedKashyap et al. (2011). The real electrical conductivity, as calculated from MD using Eq. 2, is plotted in Fig. 2. Again, good agreement is found with experiments.
The electrical conductivity falls from cm-1 in pure LiF to cm-1,when the molar fraction of YF3 rises from 0 to 0.5. This decrease in despite the addition of the highly charged Y3+ ions is not surprising in view of the variations observed in other mixtures Salanne et al. (2006, 2007); Janz (1988). It correlates with the reduced diffusion of all species with observed above; in the following sections, we will analyze these variations in light of the microscopic structure of the melt.
IV Microscopic structure
In the previous section, we have shown that our molecular dynamics simulations were able to predict the transport properties of molten LiF-YF3 with a very high accuracy. An advantage of such simulations is that we can extract precisely atomic scale informations on the local structure of such melts. We will mainly focus on the study of the solvation shell of yttrium ions.
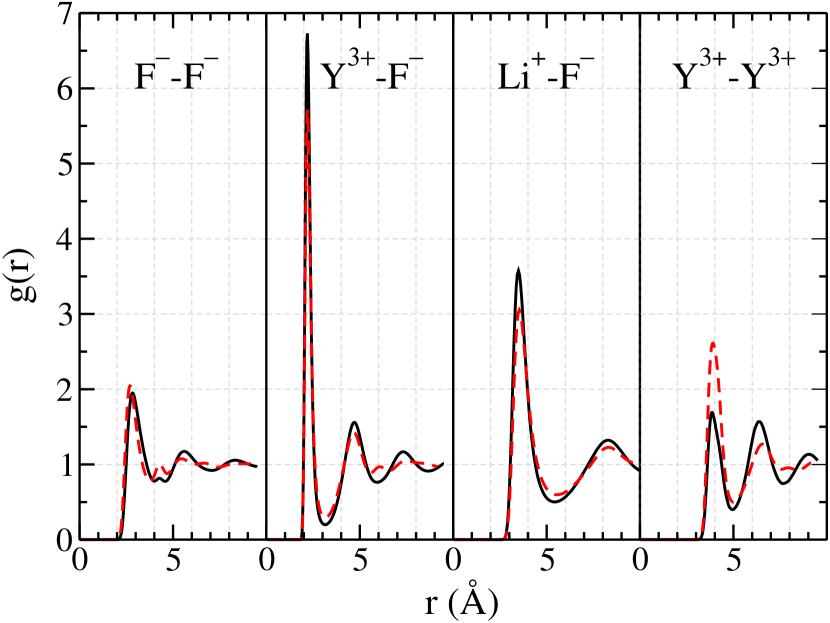
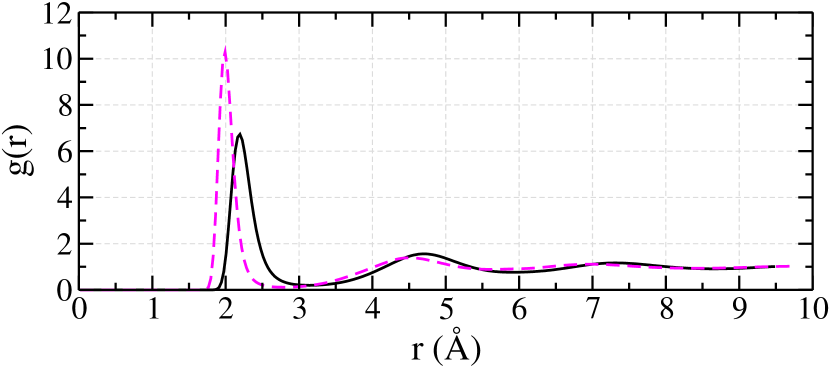
In Fig. 3, we present the partial radial distribution functions (RDF) for F--F-, F--Y3+, Y3+-Y3+ and Li+-F- pairs at 1130 K. Situations corresponding to low and high contents in YF3 ( and 0.60) are presented. Firstly, we observe that the Y-F ionic bond length, taken at the position of the first maximum in , is of 2.24 Å for all the compositions. This is significantly larger than the Zr-F distance (2.02 Å) in fluorozirconate melts shown in Fig. 4 while both cations have rather similar short-range repulsion potentials Salanne et al. (2012). This is due to the larger charge carried by the Zr4+ cations which therefore tend to be more attractive to fluorides with opposite charges. Secondly, we observe that the first peak in this Y-F RDF is 1.5 times less intense and sharper than its Zr-F counterpart. Also, the following minimum is less marked in YF3. These quantities seem to show that the first solvation shell of Y3+ is more weakly bound than the one of Zr4+ in molten fluorides. In the case of the Li+-F- pair, the RDF has a shape very similar to the case of other molten fluoride mixture Salanne et al. (2006).
The extraction of precise coordination numbers is a difficult experimental task, for example by extended X-ray absorption fine structure (EXAFS) spectroscopy, that leads to errors of the order of 20 % for liquid state systems. Here the difficulty is increased by the high temperatures of the systems. From NMR, it is possible to extract an average coordination number by comparing the chemical shift of the probed species to typical values obtained for this quantity in well-defined solid state compounds. This was performed in LiF-YF3 mixtures Rollet et al. (2004b); Bessada et al. (2009), which led to the conclusion that the yttrium ions are most probably 7-fold or 8-fold coordinated. A smaller coordination number (CN) of 6 was extracted from Raman spectroscopy experiments by Dracopoulos et al. in KF-YF3 mixtures Dracopoulos et al. (1997, 1998). Such a reduction in the CN when switching from LiF to KF-based systems and a stabilization of octahedral coordination shell in the latter is consistent with our recent results in molten fluorozirconates Pauvert et al. (2011).
Because of the intrinsic atomic-scale of our MD simulations, we can extract CNs with estimated error less than 2 %. The evolution of the CN of yttrium with its molar fraction in LiF-YF3 is presented in Fig. 5. We find the predominant species to be 7-fold coordinated yttrium ions for below 30 % and 8-fold coordinated ions above. From NMR experiments, one extracts the average CN over time. From Fig. 5, the average CN for an yttrium ion at the eutectic composition () is in our simulations, which compares well with the one estimated from NMR experiments Rollet et al. (2004b); Bessada et al. (2009). We observe almost linear evolutions for all CNs. The proportions of CNs 6 and 7 decrease with , and are compensated by increases in CNs 8 and 9. Contrarily to the case of LiF-ZrF4 mixtures, no anomalous behaviour is observed around a given specific composition Pauvert et al. (2010). The average coordination number , plotted in the bottom panel of Fig. 5, varies indeed remarkably slowly and linearly with , between 7.0 and 7.8.
As for the like-like RDFs which are also shown in Fig. 3, the F-F one does not show any strong evolution with the composition of the melt. The Y-Y one is characterized by a first peak, which is located at a distance of 3.9 Å which is smaller than twice the Y-F distance and therefore corresponds to pairs of cations that share a common fluoride anion. The intensity of this first peak slowly increases with the YF3 concentration. This evolution is linked to the slow increase in average CN discussed just above and shown in the bottom panel of Fig. 5. It is larger than the one of the corresponding Zr-Zr RDF in fluorozirconates Pauvert et al. (2010, 2011); Rollet et al. (2012). Such a structural feature, which denotes some medium-range, network-like ordering, has been shown to impact importantly the transport properties in molten fluorides.

(Bottom) Average coordination number of ytrium ions as a function of the composition of the melt.
V Discussion: interplay between structure and dynamics
In molten salts, the coordination number is often seen as the most important structural criterion. It is heavily used for the interpretation of various properties through the perspective of the Lux-Flood acidity Lux (1939); Flood (1947). In a molten fluoride melt, this definition of acidity induces that (i) an acid is a fluoride ion acceptor and (ii) a base is a fluoride ion donor Bieber et al. (2011). In this context, based on their coordination numbers, which range between 6 and 9, Y3+ and Zr4+ should both be considered as strongly acidic species. Nevertheless, very distinct behaviours are observed in these melts concerning the transport properties.
On the one hand, in MF-ZrF4 melts (with being Li+, Na+, K+ or even a mixture of Li+ and Na+), the ratio starts from a value very close to unity in the alkali fluoride melt, then strongly decreases upon addition of ZrF4. In parallel, the ratio also decreases, taking values close to unity in ZrF4 concentrated melts Salanne et al. (2009); Pauvert et al. (2011) (note that a similar behavior is observed in LiF-BeF2 mixtures Salanne et al. (2006, 2007)). Here, in LiF-YF3 both ratios hardly vary, showing that the diffusion of fluoride is barely impacted by the presence of yttrium ions, even at high YF3 concentrations.
On the other hand, we have already mentioned that the Nernst-Einstein approximation overestimates the electrical conductivity of LiF-YF3 molten salts by 10 to 20 %, independently of the composition. Such a relatively good agreement is usually observed in molten alkali halides, i.e., without complexing species. In LiF-NaF-ZrF4 mixtures, we have shown that deviation from the Nernst-Einstein approximation increases with , the content of complexing species. For the highest concentration studied (=0.29) the conductivity is overestimated by as much as a factor of 2 if correlations between the ions are neglected, in agreement with the picture of Margulis et al. discussed above that relates strong correlations in mobilities of the various ions in molten salts to a decrease in conductivityKashyap et al. (2011). This again shows that association effects between Y3+ and F- ions are weak in LiF-YF3 melts, despite the high coordination numbers. These points lead to the picture of a loosely bound network structure. The association behaviour of LiF-YF3 is thus qualitatively different from that of LiF-ZrF4, although their coordination number is high.
In order to investigate further the associative behaviour in LiF-YF3, we analyze the rate of change of the instantaneous coordination number, which can be interpreted as the solvation shell lifetime. This is done by performing a cage correlation function analysis. The first minimum of the Y-F partial radial distribution function is used as a simple geometrical criterion to determine the limit of the first coordination shell of a given Y3+. The number of counter-ions F- that have left the shell between times and is noted . The rate at which a single counter-ion (F-) leaves the Y3+ ions solvation shell (the cage) is given by the cage-out correlation function Rabani et al. (1997), which is defined as:
| (3) |
where is the Heaviside step function.
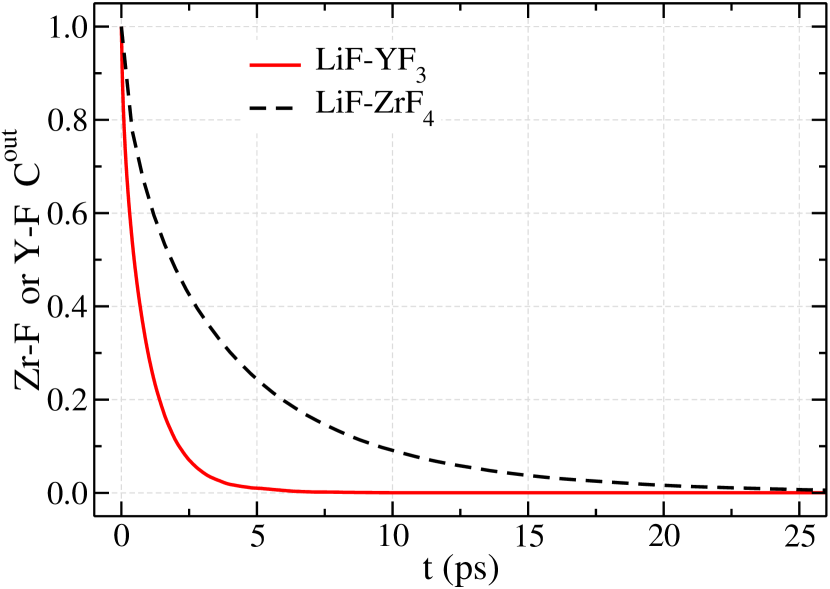
The cage-out functions for Y3+ and Zr4+ in LiF-YF3 and LiF-ZrF4 are presented in Fig. 6 for the same molar fraction of 0.35 at 1200 K. Note that the changes with composition are very small, as shown in the supplementary materials. The exponential decay of the cage-out function is much faster for the Y3+-based salt. The corresponding characteristic time is of 0.7 ps, which is much lower than the ones obtained in LiF-ZrF4 (3.1 ps), NaF-ZrF4 (15.7 ps) and KF-ZrF4 (76.4 ps). These values are summarized in Table 1. The very short characteristic time measured in the case of LiF-YF3 is at the origin of the particular transport properties obtained in this particular molten salt. It shows that even if Y3+ and Zr4+ have rather similar (and high) coordination numbers, the ionic bond is much weaker for the former.
Although the use of such cage correlation functions appears to be very useful for understanding the associative properties of molten salts, this quantity can only be obtained from simulations. It would nevertheless be valuable to extract similar information from a quantity which is more readily accessible. To this end, we compare in Fig. 7 the effective potential between Zr4+ and F-, and between Y3+ and F-, in the two melts. These were obtained from:
| (4) |
Indeed, Eq. 4 relates the partial radial distribution functions discussed above to an effective interaction potential. The last term in Eq. 4 accounts for the rotational invariance of . Following the transition state theory Truhlar et al. (1983); Masia and Rey (2003), the rate at which the F- ions escape from the Y3+ solvation shell should depend strongly on the height of the corresponding barrier. We observe a smaller barrier (by 1 ) in the LiF-YF3 melt, in agreement with the smaller characteristic time extracted from the cage-out correlation function. This clearly shows that the shape of the RDF, rather than the CN distribution, should be studied for determining the associating properties in a molten salt.
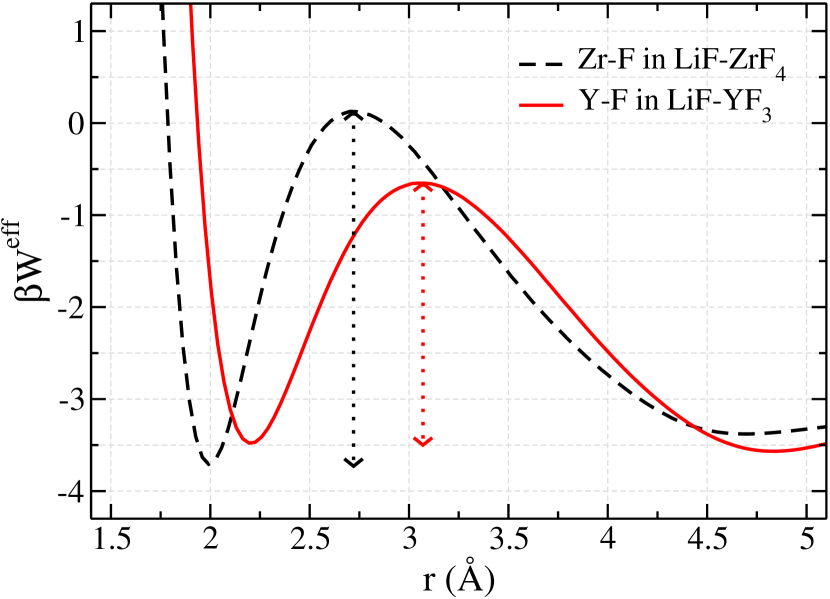
These functions show a deep first minimum followed by a local maximum. The height of this variation can be seen as an activation energy (), that we tabulate for LiF-YF3, LiF-ZrF4, NaF-ZrF4 and KF-ZrF4 in Table 1. This activation energy () that is the thermal energy a single counterion (F-) has to provide to cage out, is minimal in the case of Y3+. This also strenghtens the conclusions about the loosely bound nature of LiF-YF3.
| (ps) | () | |
|---|---|---|
| LiF-YF3 | 0.7 | 3.02 |
| LiF-ZrF4 | 3.1 | 4.48 |
| NaF-ZrF4 | 15.7 | 5.39 |
| KF-ZrF4 | 76.4 | 6.72 |
VI Conclusion
We have characterized the transport properties of LiF-YF3 melts by combining PFG-NMR spectroscopy, potentiometric measurements and molecular dynamics simulations. The latter are able to provide diffusion coefficients of Li+ and F- ions and electrical conductivities in quantitative agreement with the experiments. It is then possible to extract many other quantities, such as the partial radial distribution functions, the coordination number distributions and the cage-out correlation functions, as a function of the molar fraction of YF3. We have shown that despite being appealing, the coordination number is not the right observable to predict the strength of the association between a metallic species and the anion. It does therefore not bring much insight on the transport properties of molten salts. Indeed, although Y3+ and Zr4+ ions have similar coordination numbers in fluorozirconate melts, their diffusion coefficients do not show similar behavior: In LiF-ZrF4 melts, when increases, decays much faster than , eventually reaching . On the contrary, in LiF-YF3 melts, the three diffusion coefficients evolve in a similar way.
The analysis of the effective potentials, which can readily be extracted from the radial distribution functions, and of the cage correlation functions, which measure the lifetime of the first solvation shell of the ions, provide a much more complete framework for interpreting the dynamic properties. Here we show that the variation of the diffusion coefficients is linked to a short lifetime of the Y-F ionic bonds, which in turn arises from a rather shallow well in the effective potential. This points toward the potential use of the transition state theory for rationalizing the ionic association effects in molten salts.
Acknowledgements.
The authors acknowledge the support of the French Agence Nationale de la Recherche (ANR), under grant ANR-09-BLAN-0188 (“MILIFOX”) and of the PACEN program. The research leading to these results has received funding from the European Community’s Seventh Framework Program under grant agreement no 249696 EVOL.References
- Groult et al. (2008) H. Groult, A. Barhoun, H. E. Ghallali, S. Borensztjan, and F. Lantelme, J. Electrochem. Soc. 155, E19 (2008).
- Groult et al. (2011) H. Groult, A. Barhoun, E. Briot, F. Lantelme, and C. M. Julien, J. Fluorine Chem. 132, 1122 (2011).
- Cassayre et al. (2010) L. Cassayre, P. Palau, P. Chamelot, and L. Massot, J. Chem. Eng. Data 55, 4549 (2010).
- Hamel et al. (2007) C. Hamel, P. Chamelot, A. Laplace, E. Walle, O. Dugne, and P. Taxil, Electrochim. Acta 52, 3995 (2007).
- Salanne et al. (2008) M. Salanne, C. Simon, P. Turq, and P. A. Madden, J. Phys. Chem. B 112, 1177 (2008).
- Taxil et al. (2009) P. Taxil, L. Massot, C. Nourry, M. Gibilaro, P. Chamelot, and L. Cassayre, J. Fluorine Chem. 130, 94 (2009).
- Fukasawa et al. (2012) K. Fukasawa, A. Uehara, T. Nagai, N. Sato, T. Fujii, and H. Yamana, J. Nucl. Mater. 424, 17 (2012).
- Waldrop (2012) M. M. Waldrop, Nature 492, 26 (2012).
- Ihli et al. (2008) T. Ihli, T. K. Basu, L. M. Giancarli, S. Konishi, S. Malang, F. Najmabadi, S. Nishio, A. R. Raffray, C. V. S. Rao, A. Sagara, and Y. Wu, Fusion Eng. Des. 83, 912 (2008).
- Bradwell et al. (2012) D. J. Bradwell, H. Kim, A. H. C. Sirk, and D. R. Sadoway, J. Am. Chem. Soc. 134, 1895 (2012).
- Mathieu et al. (2006) L. Mathieu, D. Heuer, R. Brissot, C. Garzenne, C. L. Brun, D. Lecarpentier, E. Liatard, J. M. Loiseaux, O. Meplan, E. Merle-Lucotte, A. Nuttin, E. Walle, and J. Wilson, Prog. Nucl. Energy 48, 664 (2006).
- Delpech et al. (2009) S. Delpech, E. Merle-Lucotte, D. Heuer, M. Allibert, V. Ghetta, C. Le-Brun, X. Doligez, and G. Picard, J. Fluorine Chem. 130, 11 (2009).
- Gibilaro et al. (2009) M. Gibilaro, L. Massot, P. Chamelot, L. Cassayre, and P. Taxil, Electrochim. Acta 55, 281 (2009).
- Chamelot et al. (2010) P. Chamelot, L. Massot, L. Cassayre, and P. Taxil, Electrochim. Acta 55, 4758 (2010).
- Levesque et al. (2012) M. Levesque, M. Gupta, and R. P. Gupta, Phys. Rev. B 85, 064111 (2012).
- Gupta et al. (2012) M. Gupta, R. P. Gupta, and M. Levesque, Phys. Rev. B 86, 184201 (2012).
- Levesque et al. (2011) M. Levesque, E. Martínez, C.-C. Fu, M. Nastar, and F. Soisson, Phys. Rev. B 84, 184205 (2011).
- Levesque (2013) M. Levesque, Phys. Rev. B 87, 075409 (2013).
- Rollet et al. (2004a) A.-L. Rollet, C. Bessada, Y. Auger, P. Melin, M. Gailhanou, and D. Thaudière, Nucl. Inst. Meth. Phys. Res. Sec. B 226, 447 (2004a).
- Lacassagne et al. (2002) V. Lacassagne, C. Bessada, P. Florian, S. Bouvet, B. Ollivier, J.-P. Coutures, and D. Massiot, J. Phys. Chem. B 106, 1862 (2002).
- Bessada et al. (2006) C. Bessada, A.-L. Rollet, A. Rakhmatullin, I. Nuta, P. Florian, and D. Massiot, C. R. Chim. 9, 374 (2006).
- Toth et al. (1973) L. M. Toth, J. B. Bates, and G. E. Boyd, J. Phys. Chem. 77, 216 (1973).
- Dracopoulos and Papatheodorou (2000) V. Dracopoulos and G. N. Papatheodorou, Phys. Chem. Chem. Phys. 2, 2021 (2000).
- Rollet et al. (2009) A.-L. Rollet, V. Sarou-Kanian, and C. Bessada, Inorg. Chem. 48, 10972 (2009).
- Rollet et al. (2010) A.-L. Rollet, V. Sarou-Kanian, and C. Bessada, C. R. Chim. 13, 399 (2010).
- Benes et al. (2009) O. Benes, P. Zeller, M. Salanne, and R. J. M. Konings, J. Chem. Phys. 130, 134716 (2009).
- Benes and Konings (2009) O. Benes and R. J. M. Konings, J. Fluorine Chem. 130, 22 (2009).
- Robelin and Chartrand (2013) C. Robelin and P. Chartrand, J. Chem. Thermo. 57, 387 (2013).
- Dewan et al. (2013) L. C. Dewan, C. Simon, P. A. Madden, L. W. Hobbs, and M. Salanne, J. Nucl. Mater. 434, 322 (2013).
- Salanne et al. (2007) M. Salanne, C. Simon, P. Turq, and P. A. Madden, J. Phys. Chem. B 111, 4678 (2007).
- Ohtori et al. (2009) N. Ohtori, M. Salanne, and P. A. Madden, J. Chem. Phys. 130, 104507 (2009).
- Salanne et al. (2006) M. Salanne, C. Simon, P. Turq, R. J. Heaton, and P. A. Madden, J. Phys. Chem. B 110, 11461 (2006).
- Sarou-Kanian et al. (2009) V. Sarou-Kanian, A.-L. Rollet, M. Salanne, C. Simon, C. Bessada, and P. A. Madden, Phys. Chem. Chem. Phys. 11, 11501 (2009).
- Pauvert et al. (2011) O. Pauvert, M. Salanne, D. Zanghi, C. Simon, S. Reguer, D. Thiaudière, Y. Okamoto, H. Matsuura, and C. Bessada, J. Phys. Chem. B 115, 9160 (2011).
- Salanne and Madden (2011) M. Salanne and P. A. Madden, Mol. Phys. 109, 2299 (2011).
- Madden and Wilson (1996) P. A. Madden and M. Wilson, Chem. Soc. Rev. 25, 339 (1996).
- Madden et al. (2006) P. A. Madden, R. J. Heaton, A. Aguado, and S. Jahn, J. Mol. Struct.: THEOCHEM 771, 9 (2006).
- Salanne et al. (2012) M. Salanne, B. Rotenberg, C. Simon, S. Jahn, R. Vuilleumier, and P. A. Madden, Theor. Chem. Acc. 131, 1143 (2012).
- Aguado et al. (2003) A. Aguado, L. Bernasconi, S. Jahn, and P. A. Madden, Faraday Discuss. 124, 171 (2003).
- Rotenberg et al. (2010) B. Rotenberg, M. Salanne, C. Simon, and R. Vuilleumier, Phys. Rev. Lett. 104, 138301 (2010).
- Cotts et al. (1989) R. Cotts, M. Hoch, T. Sun, and J. Markert, J. Mag. Res. 83, 252 (1989).
- Rollet et al. (2012) A.-L. Rollet, M. Salanne, and H. Groult, J. Fluorine Chem. 134, 44 (2012).
- Hives and Thonstad (2004) J. Hives and J. Thonstad, Electrochim. Acta 49, 5111 (2004).
- (44) See supplementary material for details about the conductivity measurements and molecular dynamics simulations.
- Burbano et al. (2012) M. Burbano, S. T. Norberg, S. Hull, S. G. Eriksson, D. Marrocchelli, P. A. Madden, and G. W. Watson, Chem. Mater. 24, 222 (2012).
- Marrocchelli et al. (2012) D. Marrocchelli, S. R. Bishop, H. L. Tuller, and B. Yildiz, Adv. Func. Mat. 22, 1958 (2012).
- Pauvert et al. (2010) O. Pauvert, D. Zanghi, M. Salanne, C. Simon, A. Rakhmatullin, H. Matsuura, Y. Okamoto, F. Vivet, and C. Bessada, J. Phys. Chem. B 114, 6472 (2010).
- Martyna et al. (1994) G. J. Martyna, D. J. Tobias, and M. L. Klein, J. Chem. Phys. 101, 4177 (1994).
- Martyna et al. (1992) G. J. Martyna, M. L. Klein, and M. E. Tuckerman, J. Chem. Phys. 97, 2635 (1992).
- Aguado and Madden (2003) A. Aguado and P. A. Madden, J. Chem. Phys. 119, 7471 (2003).
- Janz (1988) G. J. Janz, J. Phys. Chem. Ref. Data 17, 1 (1988).
- Borucka et al. (1957) A. Z. Borucka, J. O. Bockris, and J. A. Kitchener, Proc. Roy. Soc. London. A. Math. Phys. Sci. 241, 554 (1957).
- Harris (2010) K. R. Harris, J. Phys. Chem. B 114, 9572 (2010).
- Kashyap et al. (2011) H. K. Kashyap, H. V. R. Annapureddy, F. O. Raineri, and C. J. Margulis, J. Phys. Chem. B 115, 13212 (2011).
- Rollet et al. (2004b) A.-L. Rollet, C. Bessada, A. Rakhmatullin, Y. Auger, P. Melin, M. Gailhanou, and D. Thiaudière, C. R. Chim. 7, 1135 (2004b).
- Bessada et al. (2009) C. Bessada, A. Rakhmatullin, A.-L. Rollet, and D. Zanghi, J. Fluorine Chem. 130, 45 (2009).
- Dracopoulos et al. (1997) V. Dracopoulos, B. Gilbert, B. Borrensen, G. M. Photiadis, and G. N. Papatheodorou, J. Chem. Soc., Faraday Trans. 93, 3081 (1997).
- Dracopoulos et al. (1998) V. Dracopoulos, B. Gilbert, and G. N. Papatheodorou, J. Chem. Soc., Faraday Trans. 74, 2601 (1998).
- Lux (1939) H. Lux, Ztschr. Elektrochem 45, 303 (1939).
- Flood (1947) H. Flood, Acta Chem. Scand. 1, 592 (1947).
- Bieber et al. (2011) A. Bieber, L. Massot, M. Gibilaro, L. Cassayre, P. Chamelot, and P. Taxil, Electrochim. Acta 56, 5022 (2011).
- Salanne et al. (2009) M. Salanne, C. Simon, H. Groult, F. Lantelme, T. Goto, and A. Barhoun, J. Fluorine Chem. 130, 61 (2009).
- Rabani et al. (1997) E. Rabani, J. D. Gezelter, and B. J. Berne, J. Chem. Phys. 107, 6867 (1997).
- Truhlar et al. (1983) D. G. Truhlar, W. L. Hase, and J. T. Hynes, J. Phys. Chem. 87, 2664 (1983).
- Masia and Rey (2003) M. Masia and R. Rey, J. Phys. Chem. B 107, 2651 (2003).