Ab initio study of low-energy electronic collective excitations in bulk Pb
Abstract
A theoretical study of the dynamical dielectric response of bulk lead at low energies is presented. The calculations are performed with full inclusion of the electronic band structure calculated by means of a first-principles pseudopotential approach. The effect of inclusion of the spin-orbit interaction in the band structure on the excitation spectra in Pb is analyzed, together with dynamical exchange-correlation and local-field effects. In general, results show significant anisotropy effects on the dielectric response of bulk Pb. At small momentum transfers in all three symmetry directions the calculated excitation spectra present several peaks with strong acoustic-like dispersion in the energy range below 2 eV. The analysis shows that only one of such modes existing at momentum transfers along the -K direction can be interpreted as a true acoustic-like plasmon whereas all other modes are originated from the enhanced number of intraband electron-hole excitations at corresponding energies. Comparison with available optical experimental data shows good agreement.
pacs:
71.20.Be,71.45.GmI INTRODUCTION
In the last two decades significant progress was achieved in the understanding of dynamical processes involving both single particles – electrons and holes – and collective electronic excitations in metallic systems from the so-called ab initio perspective. In particular, in the course of the study of dynamics of electronic excitations the relative importance of such intrinsic processes as electron-phonon and electron-electron decay was thoroughly analyzed.ChulkovCR06 ; ecbessr04 One of the important results of these investigations was the demonstration of a crucial role of electronic band structure of real solids in such events.
At the same time, it is known that the band structure can be influenced by spin-orbit (SO) effects, especially in heavy elements. Remarkable examples are lead, bismuth and bismuth tellurohalides, where the SO interaction produces strong modifications of the band structure gonzebi ; zubizarreta ; Eremeev and vibrational spectra,heboprb10 ; biph ; Sklyadneva influencing the electron-phonon interaction in these materials.
The effect of the SO interaction on the electronic structure was intensively investigated in the past, while the inclusion of this interaction into calculation of dielectric properties from first-principles was performed in few cases only. Thus it was demonstrated that the SO interaction induces sizeable effects in the optical properties and dielectric properties in the small momentum transfer limit of heavy elements, in particular Pb.glamnjp10 However, a detailed study of the impact of the SO interaction on the excitation spectrum of Pb over a whole momentum-energy domain is still missing. Especially in a low-energy region where the major effect is expected. This constitutes a main topic of the present study, in such a way giving a whole picture of the low-energy electronic dynamics in the elemental lead in addition to the phonon dynamics studied heavily up to now.
One of the characteristics of lead is that it presents the second-highest critical temperature of all bulk elemental superconductors ( = 7.23 K),dyroprb75 which has been shown to be related to its large electron-phonon coupling (EPC) constant. In addition, SO coupling has a strong impact on the electron-phonon interaction in bulk Pb, increasing its strength as much as .heboprb10 Studying the electronic collective excitations near the Fermi level () and the SO effects on them would complete the description of the low-energy dynamics in bulk lead, and it is done in the present work.
For many years the electron-density response of solids was studied using a free-electron gas (FEG) model in which the electron valence density is parameterized by a single quantity: the density parameter , which stands for the average inter-electron distance.pino66 The FEG model gave insight into basic properties of the momentum- and frequency-dependent dynamical dielectric response. However, band structure effects that are missing in a FEG model frequently can produce strong impact on the dynamical dielectric response of solids. In particular, interband transitions (not presented in a FEG model) give rise, for instance, to a strong red shift of the Ag plasmon frequency cazaliprb00 or to a negative momentum dispersion of the plasmon in Cs.aryaseprl94 Moreover, these transitions can dominate in some materials the energy-loss landscape in the low-energy-transfer domain.zhsiprb01 ; kupiprl02 ; ecchprb12
In three-dimensional (3D) solids the FEG model predicts the existence of a -dependent threshold for collective excitations, exceeding in metals several eV. Hence, according to the FEG theory, plasmons can not participate directly in the low-energy dynamical processes near the Fermi surface. However, in the fifties it was predictedpines56 ; pinespr58 the existence of a very-low energy excitation, which should be present in systems with several energy bands crossing the Fermi level with different Fermi velocities, , as it is the case of bulk Pb. This very-low energy mode presents an acoustic-like dispersion at small momentum transfers ’s, i.e., , where is the group velocity of the acoustic plasmon being very close to the Fermi velocity in the energy band with the slower carriers. Thus, the frequency tends to zero as . Exchange of acoustic plasmons have been suggested as a possible mechanism of electron pairing in superconductors (see, i.e., Ref. ishiiprb93, and references therein). Nevertheless, to the best of our knowledge this kind of acoustic-like modes has not been demonstrated to exist in bulk metallic systems experimentally. Similar mode has been recently predicted euro ; Silkin05 and proved experimentallynature ; papaprl10 ; podiepl10 on metal surfaces. On the other hand, recent detailed ab initio calculations of the dynamical dielectric response in a variety of bulk metallic systems like MgB2,silkinprb09a ; balassprb08 Pd,silkinprb09b transition-metal dichalcogenides,faarprb12 ; cugaprb12 and CaC6ecchprb12 predicted, with some initial controversy,zhsiprb01 ; kupiprl02 the existence of a such kind of acoustic plasmons in metallic systems. In particular, in the case of Pd and CaC6 this acoustic-like mode disperses in all three symmetry directions while in the layered compounds MgB2 and NbSe2 the corresponding mode exists only for the momentum transfers along the direction perpendicular to the basal planes.
The main aim of the present study is twofold. First, the complexity of the low-energy electronic response of bulk Pb is demonstrated, together with the role of different physical ingredients. Second, the results on the modes characterized by an acoustic-like dispersion are presented and analyzed in detail. In particular we demonstrate strongly anisotropic character of such low-energy collective excitations in bulk lead. The calculations of the low-energy collective excitations have been done using the first-principles pseudopotential approach within the time-dependent density functional theory (TDDFT).rungeprl84 ; petersprl96
The rest of the paper is organized as follows: In Sec. II the details of the ab initio calculations of the dynamical dielectric response of 3D solids are presented. In Sec. III the general results for bulk Pb for the low-energy regime are presented together with comparison with experimental optical data, while in Sec. IV the acoustic-like collective excitations are analyzed in detail. Finally, the main conclusions are presented in Sec. V. Unless otherwise stated, atomic units are used throughout, i.e., .
II CALCULATION METHOD
A key quantity in the description of dynamical dielectric response properties of solids is the dynamical structure factor since, within the first Born approximation, the inelastic scattering cross section at momentum transfer and energy of X-rays and electrons is proportional to it.pino66 is related by the fluctuation-dissipation theorem to the dielectric function . For a periodic solid,
| (1) |
where is the normalization volume, G is a reciprocal-lattice vector, vector is located in the Brillouin zone (BZ), , and is the so-called energy-loss function, whose Fourier coefficients are related to those of the density-response function for interacting electrons through
| (2) |
where is the Fourier transform of the bare Coulomb interaction. Note that in this definition the vector is not restricted to be located inside the first BZ.
A crucial quantity in the evaluation of Eq. (2) is the density-response function , which in the framework of TDDFT rungeprl84 ; petersprl96 satisfies the matrix equation
| (3) |
where is the matrix of the Fourier coefficients of the density-response function for noninteracting Kohn-Sham electrons. stands for the Fourier components of the exchange-correlation kernel, whose exact form is unknown. Thus, approximations must be used to describe . Here we use two frequently used approaches for the description of : the random-phase approximation (RPA) (here one simply sets to zero, i.e., neglects the short-range exchange and correlation effects) and the time-dependent local-density approximation (TDLDA).gross96
We evaluate the matrix by calculating first the spectral function matrix using the following expressionaryaseprb94 ; aryase01
| (4) |
In Eq. (4), and are band indexes, wave vectors k’s are in the first BZ, and and are Bloch eigenvalues and eigenfunctions, respectively, of the Kohn-Sham Hamiltonian. From the knowledge of , the imaginary part of is easily evaluated using the relation
| (5) |
where for . The real part of is obtained from the corresponding imaginary part using the Hilbert transformation.
Inclusion of the matrix elements in Eq. (3) accounts for the so-called crystalline local-field effects (LFEs)adpr62 which can be significant if there is notable spatial variation in the electron density in the system. If LFEs are neglected, the energy-loss function is simply given by
| (6) |
In the present work, in the density functional theory (DFT) ground state calculations, the electron-ion interaction is represented by a norm-conserving non-local pseudopotential,bacheleprb82 and the local density approximation (LDA) is chosen for the exchange and correlation potential, with the use of the Perdew-Zunger pezuprb81 parametrization of the XC energy of Ceperley and Alder.cealprl80 Well-converged results for the face-centered cubic bulk Pb with the experimental lattice parameter have been obtained with a kinetic energy cut-off of 14 Ry, including plane waves in the expansion of the Bloch states.
Two different sets of calculations were carried out in evaluating Eq. (4). First, was calculated in the range 0 30 eV with a step of 0.005 eV, the band indexes in Eq. (4) running up to 25. A Monkhorst-Packmp 969696 grid of k vectors was used in the BZ sampling which corresponds to inclusion of 19000 points in the irreducible part of the BZ (IBZ). The delta function was represented by a Gaussian of width of 0.05 eV. Second, in order to properly describe the acoustic-like modes at energies below 1 eV, Eq. (4) was evaluated in the 0 4 eV range, with a step 1 meV and taking into account up to 12 energy bands. In this second set of calculations a fine 432432432 grid was used, with 850000 k points in the IBZ, and the width of the Gaussian replacing the delta function was set to 2 meV.
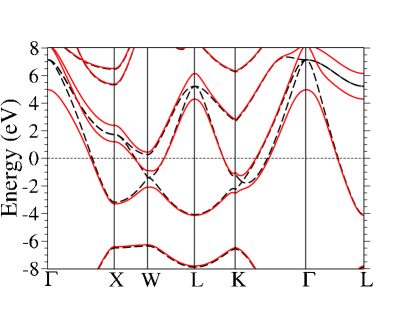
In Fig. 1 the calculated band structure of bulk fcc lead along some high-symmetry directions of the first BZ is shown, with (solid lines) and without (dashed lines) inclusion of SO interaction in the Hamiltonian of the system. As the fcc lattice is centrosymmetric, due to the Kramers degeneracy tinkam71 each band is double-degenerated in both cases. The calculated band structure is in good agreement with other calculations (see, i.e., Refs. heboprb10, ; vetoprb08, ) and with the experimental one jepoprb90 when the SO term is taken into account. As can be seen in Fig. 1, the inclusion of the SO interaction has sizeable effects on the bands crossing the Fermi level (of -orbital character), mainly around the high-symmetry points of the BZ. Thus, SO effects on the band structure of bulk Pb are expected to show up on the low-energy dielectric properties of this material.
The band structure calculations were performed with inclusion of the SO term in the Hamiltonian fully self consistently. In the evaluation of , the SO coupling enters Eq. (4) through the energy spectrum (via the function) and coupling matrices (the brackets). We checked that the replacement of the spinor wave functions by a scalar ones in the evaluation of slightly modifies the calculated dielectric properties of Pb in comparison with the full SO results, however without important changes.
III GENERAL RESULTS
In the FEG model, the plasma frequency is determined as with being the average electron density and electron effective mass, which in terms of the density parameter reads as . For lead, using the value of determined on base of experimental data, one obtains eV. This value is in good agreement with the one obtained in electron energy-loss experiments (see, e.g., Ref. ashtonjpf73, and references therein). Thus, the energy transfer range 8 eV, which is of interest here, is well below the bulk plasmon energy in lead. Note also that by calculating the dielectric response up to 30 eV the present results are well converged with respect to the finite energy range used in the numerical Hilbert transformation procedure.
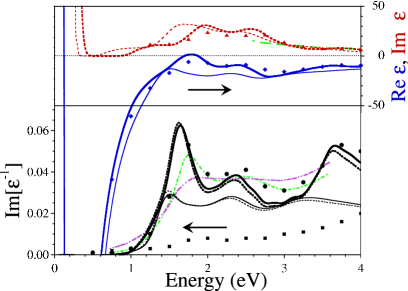
Comparison of the calculated energy-loss function with optical experimental data from Ref. mathewps71, obtained at 140 K and room temperature is performed in Fig. 2. The calculated curves correspond to the smallest momentum transfer =0.014 a.u. along the -X direction, allowing comparison with optical measurements. As can be seen in the figure, the loss function calculated without the spin-orbit interaction significantly deviates from both experimental curves. In particular, the first peak in the calculated curve is located at 1.5 eV, i.e. at a notably lower energy in comparison with experiment. Other broad peaks centered at energies of 2.35 eV and 3.4 eV, are also located at lower energies. Only inclusion of the SO coupling in the band structure leads to a fairly good agreement in the energy positions of all three features in this energy range with the experimental ones, especially with the measurements carried out at 140 K. Also our data with the SO interaction included are in good agreement with ab initio calculations of Ref. glamnjp10, . Some quantitative differences observed between two ab initio results are at the level of uncertainty in such kind of calculations.
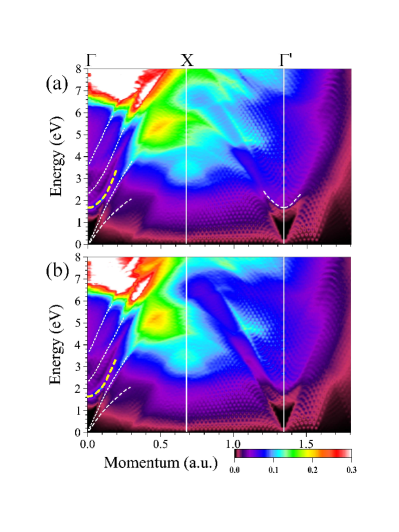
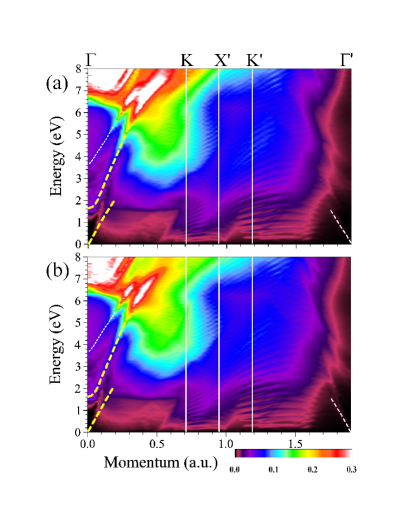
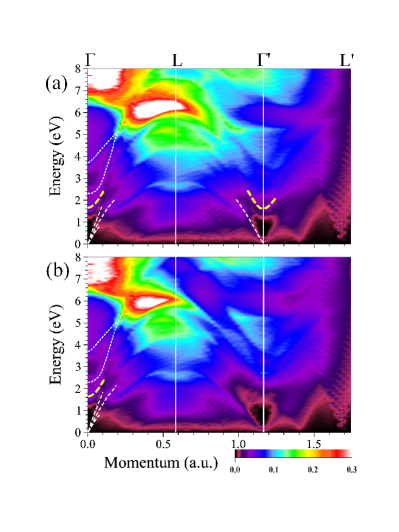
In Figs. 3-5 the energy-loss function, Im, calculated using the RPA approximation for the exchange-correlation kernel and including the SO interaction, is presented as a function of the energy transfer and value of the momentum transfer Q along three high-symmetry directions, both including and neglecting the LFEs. In these figures, at small ’s one can observe several peaks in the energy range below the prominent broad peak structure presented at energies above eV which coincides with the energy threshold for interband transitions between the occupied states (those located at energies below -6 eV in Fig. 1) and the states above the Fermi level.
The strong increase of intensity of the interband peak at 1.65 eV in the calculated loss function with the SO coupling included can be explained by the fact that, as seen in the upper panel of Fig. 2, the real part of the dielectric function reaches zero at a close energy due to a sharp increase in the corresponding imaginary part of the dielectric function. It seems in our calculations this effect is more pronounced than in the calculation of Glantsching and Ambrosch-Draxl.glamnjp10 Nevertheless, the evaluated loss functions in both calculations are rather similar in this energy range. Only little differences can be observed at larger energies, where the loss function calculated in Ref. glamnjp10, is slightly larger than that evaluated in the present work. This is explained by the larger imaginary part of the dielectric function in our calculation in the 1.7-2.7 eV energy region and the lower real part at energies above 2 eV. From this analysis we can conclude that the experimental optical data reflect clear SO effects. Note that in the experimental data of Ref. mathewps71, the two first lowest energy peaks are barely visible in the room temperature loss spectra and significantly more pronounced in the measurements performed at T=140 K. This is in agreement with the fact that Pb presents a strong electron-phonon coupling, which modifies the one-electron energy levels with increasing temperature. Hence, one can expect that in measurements performed at even lower temperatures, the first interband peak might increase its intensity and downshift in energy, in such a way improving agreement with the calculations.
On the other hand, comparison of the calculated results with the recently measured data obtained by reflection electron energy-loss spectroscopy (REELS)wegljpcrd09 reveals only a broad weak peak around 2 eV and presents significant underestimation in intensity of the whole spectrum. These might be a consequence that this REELS experiment setup might have insufficient resolution in this low-energy range, being apparently more suitable at higher energies.wegljpcrd09
In Figs. 3-5 one can see how the peaks in the loss function strongly disperse upward upon increase of momentum transfer values in all three directions. Thus the dominating 1.65 eV peak increases its energy up to eV ( eV) at a.u. along the -X (-K) direction. On the other hand, the 1.65 eV possesses along the -L direction much less dispersion and quickly disappears at eV. The other weaker 2.35 eV and 3.7 eV peaks disperse upward in -X and -K up to energies above 6 eV where they enter the manifold corresponding to interband transitions and can be resolved as separate features up to eV. On the contrary, along -L these upper-energy peaks disperse up to energy of eV where they merge each other and a much stronger peak continues dispersion up to energies about 6.3 eV. Starting from a.u. the dispersion of this peak turns from positive to negative and it can be clearly resolved up to a.u.
Below we present a systematic analysis of the effect of the main physical ingredients like LFEs, SO coupling, and XC effects on the low-energy electronic collective excitations in bulk Pb.
III.1 Local-field effects
From comparison of the upper and lower panels in Figs. 3-5 one can deduce that the LFEs affect the calculated dielectric properties rather weakly. From Figs. 2 and 6 it is seen that this effect is barely visible at small momentum transfers. Along the -X, -K and -L directions the main result of the LFEs in the formation of the excitation spectra in Pb is some distortion of the intensity of the aforementioned peaks at the finite momentum transfers. At energies above eV the LFEs produce significant increases in intensity of the dominant peaks.
Additionally the LFEs produce an upward shift in energy of all the features. However the effect is not very pronounced and in general do not exceed several tenths of eV. Thus in Fig. 6 one can see that the major upward shift about 0.3-0.4 eV occurs in the case of the eV feature at intermediate momentum transfers along the -L direction.
Another consequence of the inclusion of the LFEs is transmission of the 1.65 eV peak at small ’s to momentum transfers close to a.u. in the -X direction. At momentum transfers close to this one can see how intensity of the loss function at eV notably increases when the LFEs are included. At a.u. the corresponding increase in the loss function at eV due to LFEs can be seen in Fig. 6(a). Also some increase in the loss function caused by the LFEs due to the eV mode can be detected in the vicinity of a.u. along the -L direction. The example of this enhancement can be seen in Fig. 6(c), where a broad feature in the loss function appears at energies around 1.6 eV at a.u. when the LFEs are taken into account. However, in general, the impact of the LFEs on the loss spectra in Pb, being noticeable at certain energies, is not so strong as in other systems like MgB2silkinprb09a and compressed lithium.erroprb10 This signals about a less inhomogeneity in the valence charge density in Pb in comparison with those systems.
III.2 XC kernel
In Fig. 7, the calculated energy-loss function for several values of Q belonging to the three different high-symmetry directions is plotted, where comparison between results obtained with the RPA and the TDLDA kernels is made. As can be seen in the figure, the main effect of the TDLDA with respect to the RPA is the increase of the intensity of the calculated , but without qualitative changes in its shape. The most significant change is seen in Fig. 7(c) where the dominant interband peak in the -L direction is shifted downward in energy by 0.1 eV upon inclusion of the XC effects at the TDLDA level.
III.3 SO-interaction-induced effects
Inclusion of the SO coupling also affects the dielectric response of bulk Pb in an anisotropic way. As shown in Fig. 8, in all three high-symmetry directions the SO interaction increases the intensity of the broad feature located at energies above 6 eV. As was previously discussed inclusion of the SO in the calculation of the energy-loss function has sizeable effects at small momentum transfers at energies of 1.65 eV, 2.35 eV, and 3.7 eV. The impact of the SO coupling on the excitation spectra can also be observed in Fig. 8. Thus at a.u. along -X the appearance of a clear peak at 2.15 eV and two broad peaks at eV and eV caused by the SO interaction can be appreciated. At larger ’s the effect is smaller and consist mainly in the upward shift of the existing peaks. The same trend is observed in the -K and -L directions as well, although with less impact at intermediate and large momentum transfers. Additionally, in Fig. 8 one can detect that at small ’s in the low-energy region the inclusion of the SO interaction leads to the appearance of a pronounced peak. Thus at a.u. along the -X direction it is located at eV, whereas at a. u. the corresponding peak presents at eV and eV along the -K and -L directions, respectively. The dispersion of these peaks is highlighted by dashed lines in Figs. 3-5 and it is discussed in the next section.
IV ACOUSTIC-LIKE EXCITATIONS
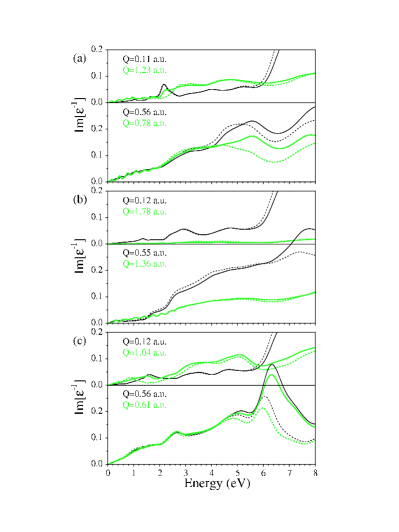
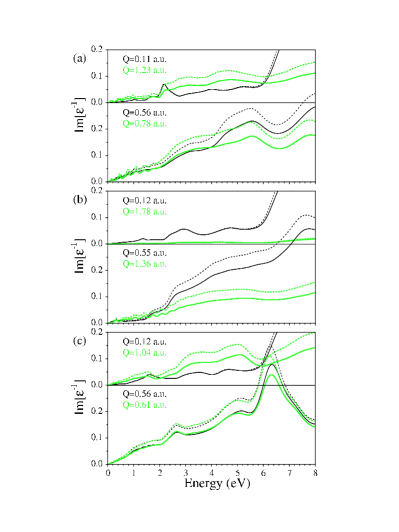
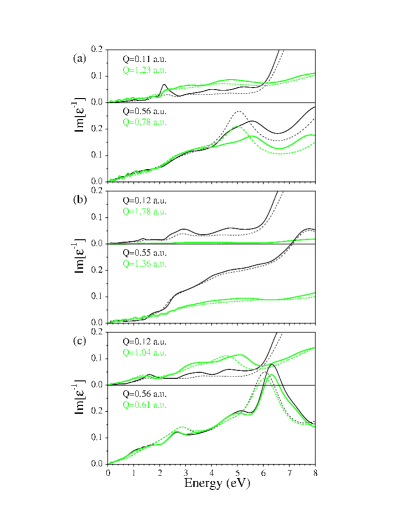
In the “low momentum–low energy” region of Figs. 3-5 the calculated loss function presents several peaks dispersing almost linearly with momentum, whose energy is vanishing upon vanishing of the momentum transfer. Upon momentum transfer increase these peaks can be traced up to an energy of about 2 eV in -K and -L, and up to even higher energies in -X. The number of such peaks depend on the direction, being two in the case of -X, one in -K, and three along -L. To study in more detail the origin of these modes characterized by an acoustic-like dispersion, in Figs. 9-11 we report the calculated dielectric and energy-loss functions at almost the same small momentum transfers in all three high-symmetry directions. Here we show the results obtained at the scalar-relativistic level and with inclusion of the SO coupling and spinor representation for wave functions. For comparison, in these figures the featureless curves derived from the Lindhard dielectric functiongrosso for the same q’s are presented as well. The ab initio curves were obtained with inclusion of the LFE and the TDLDA kernel, even though these two physical ingredients were found to affect negligibly the results in this low-energy range in all cases.
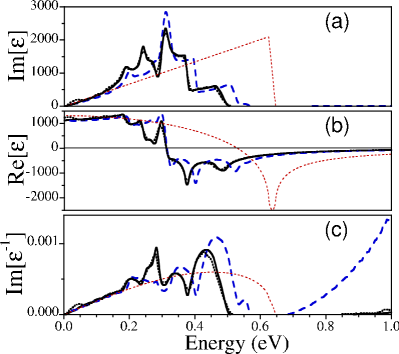
In Fig. 9 one can observe two clear peaks in the loss function, whose shape and intensity depends on whether the SO interaction is included or excluded from the calculation whereas spinor representation for the wave functions has minor impact on the results as was suggested in Ref. zubizarreta, . Note that we observe a similar little impact on the dielectric properties of Pb of the spinor representation for the wave functions in other symmetry directions as well. From the analysis of the real part of the dielectric function we conclude that neither of these peaks can be considered as a true plasmon mode as the real part of does not cross zero at the corresponding energies. The only zero-crossing in Re occurs at 0.32 eV close to the energy where Im has a maximum. As a result, at this energy the loss function presents a local minimum. Therefore this zero-crossing must be considered as a conventional Landau-overdamped mode which can not be realized.pino66 At the same time, inspection of Fig. 9 shows that the peaks presented in the energy-loss function are located at energies where the Im possesses local minima. Hence, despite rather large values of the Re at corresponding energies these peaks can be considered as corresponding to heavily damped acoustic plasmons. One can compare these results with those derived in the FEG model, where a zero-crossing of Re does not produce any peak in the loss function due to the peak in Im at the close energy.
The presence of peaks in the loss function is explained by the presence of a number of peaks in Im. These peaks in Im are due to intraband excitations within the energy bands crossing the Fermi level. Although all these bands are of the same -like character, their dispersion with different Fermi-velocity components in this symmetry direction is reflected in the presence of several peaks in Im.
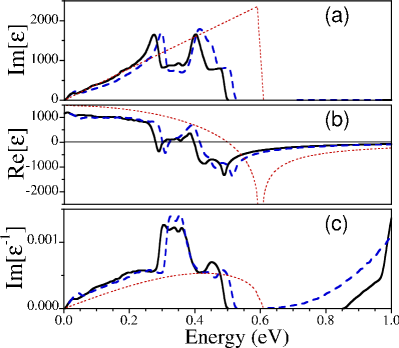
Concerning the -K direction, the loss function presented in Fig. 10 shows a broad main peak which is centered at 0.33 eV when the SO coupling is included in the calculations. Moreover, one can see that Re is rather small at that energy and even crosses zero at 0.30 eV with positive slope, when SO is included in the calculations. This signals that this peak corresponds to a true plasmon mode, although severely damped due to decay into electron-hole pairs. The presence of this peak in Im can be explained by the presence of two clear main peaks in Im at 0.26 eV and 0.40 eV, again when the SO interaction is included in the calculations. This makes the real part of the dielectric function cross zero three times, the second one with positive slope leading to the appearance of the peak in the loss function. Again, as it is in the -X direction, in the scalar-relativistic case all the peaks in Im and Im are located at higher energies.
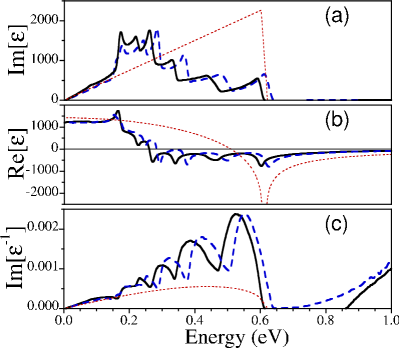
At momentum transfers along the -L direction the number of peaks in the loss function is maximal. As an example, in Fig. 11 one can detect up to three clear peaks in Im at energies of 0.30 eV, 0.38 eV, and 0.53 eV. Their dispersion is shown in Fig. 5. The presence of such large number of peaks in Im can be again explained by a large number of peaks in Im seen in Fig. 11 (up to five). However, neither of these peaks leads to an additional zero-crossing in Re. For this reason, all these peaks can be considered as being heavily damped plasmonic modes. Similar to what occurs in other symmetry directions the effect of inclusion of SO coupling is limited to the downward shift of these modes without qualitative changes.
In the calculation at the scalar-relativistic level we obtain that the upper border for the intraband electron-hole transitions is located at higher energies than when the SO interaction is included. This is explained by modifications in the energy bands around the Fermi surface. The main effect of the inclusion of the SO is the flattening of the band dispersion accompanying the opening energy gaps seen in Fig. 1. Consequently, this causes modifications of intraband excitations reflected in the integrated form through Eq. (4) in Im. Regarding the shape of the acoustic-like dispersing modes, the SO coupling only slightly affects at q’s in -X, where it gives rise to a new peak (which is located at eV in Fig. 9).
IV.1 Group velocities: comparison with
Concerning the group velocities of the acoustic modes, the values are dependent on the momentum transfer direction as readily seen from the slopes of the corresponding lines in Figs. 3-5, thus showing anisotropy as a result of band structure effects. More precisely, the group velocities present values of 0.33 and 0.41 a.u. in the -X direction, 0.41 a.u. in -K, and 0.40, 0.51 and 0.71 a.u. in -L. The velocity atomic unit is 2.1877 m/s. All the reported velocities are lower than the Fermi velocity derived from the FEG model ashcroft of a.u. On the other hand, all the estimated are higher than the experimental value of a.u.Bardeen1961 obtained in skin depth measurements. Note the estimated group velocities of the acoustic modes can not be simply assigned to the Fermi velocities of the bands crossing the Fermi surface on a fixed reciprocal space point in the calculated band structure. As an example, comparison of the above reported values of with the maximal Fermi velocities of the bands in the high-symmetry directions (see Fig. 1) of 0.60 a.u. (-X), 0.47 and 0.54 a.u. (-K) and 0.84 a.u. (-L) shows clear deviations between the calculated and values. In all cases . This is as expected, since collective electronic excitations can not be built faster than the velocity of the individual electrons. Thus, in each q direction, the maximum can be seen as the upper bound for the group velocities of the acoustic modes.
IV.2 Possibility of detection in EELS experiments
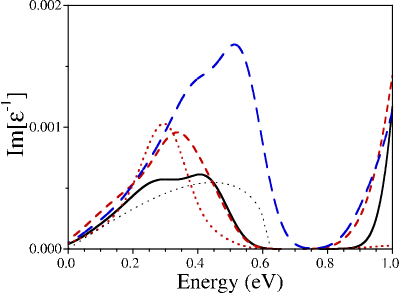
In order to evaluate the possibility of experimental detection of the aforementioned acoustic modes, in Fig. 12 a comparison of the energy-loss function for the acoustic dispersing peaks at the same momentum transfers reported in Figs. 9-11 in all three high-symmetry directions, together with the loss function derived from the Lindhard dielectric function at a.u. Also the acoustic-like plasmon mode is shown for q in the second BZ in the -K direction by a dashed red line. A Gaussian broadening has been applied to the first-principles results. The broadening parameter was fixed as 75 meV corresponding to the experimentally measured linewidth of quantum-well states in Pb(111) thin films hobrprb09 at T = 5 K. The intensity of the acoustic mode peak is maximal in the -L direction. However, from Fig. 12 we conclude that the most suitable acoustic plasmon for experimental detection corresponds to the peak dispersing in the second BZ in the -K direction. It presents the smaller linewidth once the broadening is applied, and more importantly it is located in a range in which the energy-loss function presents vanishing values except for the acoustic mode itself, getting isolated in this way (see Fig. 12). Note also that the cross section probed in EELS experiments is proportional to ,Kuzmany1998 making weak features in the low-momentum transfer range more difficult to be resolved.
However, an additional possibility of detecting an acoustic plasmon in bulk Pb can be suggested based on the general results obtained for the momentum transfer along the -X direction. As seen from Fig. 3, the fastest dispersing acoustic mode reaches an energy of 5 eV at a.u., with a gradual increase of its intensity. Thus, once the peak at 5 eV and a.u. is detected, one could trace its dispersion back towards vanishing energy and momentum transfer values.
V CONCLUSIONS
We have presented first-principles calculations of the low-energy (8 eV) electronic collective excitations in bulk Pb and studied in detail the effect of the main physical ingredients involved, as well as the existence and character of acoustic-like modes. Good agreement with available optical experimental data mathewps71 is interpreted as an evidence of remarkable SO effects, also in agreement with other theoretical works.wegljpcrd09 ; glamnjp10
In general, strong anisotropic effects are found, resulting in a distinct topology of for -K. The LFE and the SO coupling have sizeable effects on the dielectric screening of bulk Pb, showing an anisotropic behavior. For q vectors in the second BZ, the impact of the LFE on the energy-loss function is remarkable. Inclusion of exchange-correlation effects through the TDLDA kernel increases the intensity of the energy-loss function in the studied range, however without affecting its shape in a significant way.
Very-low energy modes with acoustic-like dispersions are found in all three studied high-symmetry directions and are shown to be a consequence of band structure effects. The character of these acoustic modes depends on the direction of q. The experimental detection of these acoustic modes by electron energy-loss measurements seems feasible as these modes keep their character up to 2 eV, and can reach energies as high as 5 eV in the -X direction.
ACKNOWLEDGEMENTS
We acknowledge financial support from the Spanish MICINN (No. FIS2010-19609-C02-01), the Departamento de Educación del Gobierno Vasco, and the University of the Basque Country (No. GIC07-IT-366-07).
References
- (1) E. V. Chulkov, A. G. Borisov, J. P. Gauyacq, D. Sánchez-Portal, V. M. Silkin, V. P. Zhukov, and P. M Echenique, Chem. Rev. (Washington, D.C.) 106, 4160 (2006).
- (2) P. M. Echenique, R. Berndt, E. V. Chulkov, Th. Fauster, A. Goldmann, and U. Höfer, Surf. Sci. Rep. 52, 219 (2004).
- (3) X. Gonze, J.-P. Michenaud, and J.-P. Vigneron, Phys. Rev. B 41, 11827 (1990).
- (4) X. Zubizarreta, V. M. Silkin, and E. V. Chulkov, Phys. Rev. B 84, 115144 (2011).
- (5) S. V. Eremeev, I. A. Nechaev, Yu. M. Koroteev, P. M. Echenique, and E. V. Chulkov, Phys. Rev. Lett. 108, 246802 (2012).
- (6) R. Heid, K.-P. Bohnen, I. Yu. Sklyadneva, and E. V. Chulkov, Phys. Rev. B 81 174527 (2010).
- (7) L. E. Díaz-Sánchez, A. H. Romero, and X. Gonze, Phys. Rev. B 76 104302 (2007).
- (8) I. Yu. Sklyadneva, R. Heid, K.-P. Bohnen, V. Chis, V. A. Volodin, K. A. Kokh, O. E. Tereshchenko, P. M. Echenique, and E. V. Chulkov, Phys. Rev. B 86 094302 (2012).
- (9) K. Glantschnig and C. Ambrosch-Draxl, New J. Phys. 12, 103048 (2010).
- (10) R. C. Dynes and J. M. Rowell, Phys. Rev. B 11, 1884 (1975).
- (11) D. Pines and P. Nozières, The Theory of Quantum Liquids (Benjamin, New York, 1966).
- (12) M. A. Cazalilla, J. S. Dolado, A. Rubio, and P. M. Echenique, Phys. Rev. B 61, 8033 (2000).
- (13) F. Aryasetiawan and K. Karlsson, Phys. Rev. Lett. 73, 1679 (1994).
- (14) V. P. Zhulkov, V. M. Silkin, E. V. Chulkov, and P. M. Echenique, Phys. Rev. B 64, 180507(R) (2001).
- (15) W. Ku, W. E. Pickett, R. T. Scalettar, and A. G. Eguiluz, Phys. Rev. Lett. 88, 057001 (2002).
- (16) J. P. Echeverry, E. V. Chulkov, P. M. Echenique, and V. M. Silkin, Phys. Rev. B 85, 205135 (2012).
- (17) D. Pines, Can. J. Phys. 34, 1379 (1956).
- (18) P. Nozières and D. Pines, Phys. Rev. 109, 1062 (1958).
- (19) Y. Ishii and J. Ruvalds, Phys. Rev. B 48, 3455 (1993).
- (20) V. M. Silkin, A. García-Lekue, J. M. Pitarke, E. V. Chulkov, E. Zaremba, and P. M. Echenique, Europhys. Lett. 66, 260 (2004).
- (21) V. M. Silkin, J. M. Pitarke, E. V. Chulkov, and P. M. Echenique, Phys. Rev. B 72, 115435 (2005).
- (22) B. Diaconescu, K. Pohl, L. Vattuone, L. Savio, P. Hofmann, V. M. Silkin, J. M. Pitarke, E. V. Chulkov, P. M. Echenique, D. Farías, and M. Rocca, Nature (London) 448, 57 (2007).
- (23) S. J. Park and E. E. Palmer, Phys. Rev. Lett. 105 016801 (2010).
- (24) K. Pohl, B. Diaconescu, G. Vercelli, L. Vattuone, V. M. Silkin, E. V. Chulkov, P. M. Echenique, and M. Rocca, EPL 90, 57006 (2010).
- (25) V. M. Silkin, A. Balassis, P. M. Echenique, and E. V. Chulkov, Phys. Rev. B 80, 054521 (2009).
- (26) A. Balassis, E. V. Chulkov, P. M. Echenique, and V. M. Silkin, Phys. Rev. B 78, 224502 (2008).
- (27) V. M. Silkin, I. P. Chernov, Yu. M. Koroteev, and E. V. Chulkov, Phys. Rev. B 80, 245114 (2009).
- (28) M. Faraggi, A. Arnau, and V. M. Silkin, Phys. Rev. B 86, 035115 (2012).
- (29) P. Cudazzo, M. Gatti, and A. Rubio, Phys. Rev. B 86, 075121 (2012).
- (30) E. Runge and E. K. U. Gross, Phys. Rev. Lett. 52, 997 (1984).
- (31) M. Petersilka, U. J. Gossmann, and E. K. U. Gross, Phys. Rev. Lett. 76, 1212 (1996).
- (32) E. K. U. Gross, J. F. Dobson, and M. Petersilka, in Density Functional Theory II, edited by R. F. Nalewajski (Springer, Berlin, 1996).
- (33) F. Aryasetiawan and O. Gunnarsson, Phys. Rev. B 49, 16214 (1994).
- (34) F. Aryasetiawan, in Strong Coulomb Correlations in Electronic Structure Calculations, edited by V. I. Anisimov (Gordon and Beach, Singapore, 2001).
- (35) S. L. Adler, Phys. Rev. 126, 413 (1962).
- (36) G. B. Bachelet, D. R. Hamann, and M. Schlüter, Phys. Rev. B 26, 4199 (1982).
- (37) J. P. Perdew and A. Zunger, Phys. Rev. B 23, 5048 (1981).
- (38) D. M. Ceperley and B. J. Alder, Phys. Rev. Lett. 45, 566 (1980).
- (39) H. J. Monkhorst and J. D. Pack, Phys. Rev. B 13, 5188 (1976).
- (40) M. Tinkam, Group Theory and Quantum Mechanics (McGraw-Hill, New York, 1971).
- (41) M. J. Verstraete, M. Torrent, F. Jollet, G. Zérah, and X. Gonze, Phys. Rev. B 78, 045119 (2008).
- (42) G. Jézéquel and I. Pollini, Phys. Rev. B 41, 1327 (1990).
- (43) A. M. Ashton and G. W. Green, J. Phys. F: Metal Phys. 3, 179 (1973).
- (44) A. G. Mathewson and H. P. Myers, Phys. Scr. 4, 291 (1971).
- (45) W. S. M. Werner, K. Glantschnig, and C. Ambrosch-Draxl, J. Phys. Chem. Ref. Data 38, 1013 (2009).
- (46) J. C. Lemonnier, M. Priol, and S. Robin, Phys. Rev. B 8, 5452 (1973).
- (47) I. Errea, A. Rodriguez-Prieto, B. Rousseau, V. M. Silkin, and A. Bergara, Phys. Rev. B 81, 205105 (2010).
- (48) G. Grosso and G. P. Parravicini, Solid State Physics (Academic Press, San Diego, 2000).
- (49) N. W. Ashcroft and N. D. Mermin, Solid State Physics (Thomson Learning, Southbank, Victoria, 1976).
- (50) J. Bardeen and J. R. Schrieffer, in Progress in Low Temperature Physics, edited by C. J. Groter (Interscience Publishers, Inc., New York, 1961).
- (51) I-P. Hong, C. Brun, F. Patthey, I. Yu. Sklyadneva, X. Zubizarreta, R. Heid, V. M. Silkin, P. M. Echenique, K. P. Bohnen, E. V. Chulkov, and W.-D. Schneider, Phys. Rev. B 80, 081409(R) (2009).
- (52) H. Kuzmany, Solid-State Spectroscopy. An introduction (Springer, Berlin Heidelberg, 1998).