On time-varying collaboration networks
Abstract
The patterns of scientific collaboration have been frequently investigated in terms of complex networks without reference to time evolution. In the present work, we derive collaborative networks (from the arXiv repository) parameterized along time. By defining the concept of affine group, we identify several interesting trends in scientific collaboration, including the fact that the average size of the affine groups grows exponentially, while the number of authors increases as a power law. We were therefore able to identify, through extrapolation, the possible date when a single affine group is expected to emerge. Characteristic collaboration patterns were identified for each researcher, and their analysis revealed that larger affine groups tend to be less stable.
keywords:
collaborative networks , time-varying networks , complex networks , pattern recognition1 Introduction
The progressive and inexorable informatization of scientific publishing has implied several important consequences, including the possibility to quantify and analyze the patterns characterizing scientific collaborations. For instance, many efforts have been dedicated to the identification of citations between articles (e.g. (Amancio, Oliveira Jr., & Costa, 2012; Amancio, Nunes, Oliveira Jr., & Costa, 2012; Roth, Wu, & Lozano, 2012; Amancio, Oliveira Jr., & Costa, b; Persson, 2010; Chen & Redner, 2010)). Another well-developed approach involves mapping and studying collaborations between researchers (e.g. (Liljeros, Edling, Amaral, Stanley, & Aaberg, 2001; Shrum, Chompalov, & Genuth, 2001; Newman, 2001, 2004)). Such works are often done by using complex networks (Costa, Rodrigues, Travieso, & Villas Boas, 2007). In the case of collaboration networks, each researcher is mapped as a node, while the joint authorships establish the links between those nodes. However, most such efforts disregards time, in the sense that the citation and collaborations are taken along long periods of time. By doing so, important information about transient patterns of collaboration are overlooked. For instance, some collaborations are more likely to follow an intermittent pattern, while others would be expected to proceed along continuous periods of time.
The current work aims precisely at addressing this important issue, which has been accomplished by parameterizing the collaboration networks explicitly along time. So, instead of a single network, we derive a sequence of networks defined from a starting time up to the present moment (i.e. our networks are cumulative). For each node in each of such parameterized networks, we define its respective affine group, corresponding to two sets of nodes. First, we identify those nodes that are directly attached to , as they are co-authors. The second set of nodes corresponds to those that belong to the same community (Girvan & Newman, 2002) as node , and therefore represents those authors that are more closely interrelated. Having obtained the time-parameterized networks and the respective affine groups, we proceed to analyze the evolution of the latter along time. More specifically, we calculate the mean size of the affine groups along time for three different collaboration networks extracted from the arXiv repository (www.arXiv.org). Remarkably, we found that these sizes scale as an exponential with different exponents, while the number of authors in the respective networks grows slower, as a power law. We also found that different affine groups tend to exhibit rather distinct intermittence patterns, which suggested a classification of the authors according to their time-dependent collaboration patterns. So, for each author, we calculated the maximum size of the affine groups to which it belonged, as well as the average duration of the respective collaborations. These findings suggest that authors who collaborate with more people also tend to have shorter collaborations.
2 Methodology
2.1 The time-varying collaboration network
The following procedure was applied in order to represent the relationship between authors in a specific topic. Let be the matrix representing the undirected and unweighted network. If authors and collaborate on at least one paper from the database, then a link between them is established so that . Otherwise, . Figure 1 serves as a gist of how the collaborative networks are constructed. Note that at every instant of time, new edges and new nodes might be included in the network.
We built three collaboration networks using the arXiv repository. Each network was built based on papers about an specific topic. We adopted the criteria employed in (Amancio, Oliveira Jr., & Costa, 2012; Amancio, Nunes, Oliveira Jr., & Costa, 2012; Amancio, Oliveira Jr., & Costa, b): given a keyword, we selected all papers in arXiv which contain this keyword in title or abstract. The keywords chosen were complex networks, graphene and topological insulator. For simplicity’s sake we call the respective networks of COMPNET, GRAPHENE, and TOPINSU. These three topics have been chosen for they represent modern topics of current interest in the area of Physics. Specifically, one network was obtained for each year of the aforementioned networks and the evolution of collaborative groups of authors was studied in terms of the time-varying collaboration networks. Details regarding the networks are given in Table 1.
| Network | ||||
|---|---|---|---|---|
| COMPNET | 1316 | 2013 | 5342 | 0.56 |
| GRAPHENE | 4468 | 6490 | 24956 | 1.09 |
| TOPINSU | 778 | 1436 | 5537 | 1.87 |
3 The affine group
Here we define the main concept in this paper, i.e. the affine group. For each author belonging to the set of authors we aim at identifying the subset of authors which are potentially interested in the same subject of research. The most natural choice of authors to belong to the affine group of are the current or previous collaborators of , i.e., the set . Obviously, authors possibly interested in the same subject may never have collaborated in the past. To consider this case we used the concept of community (Girvan & Newman, 2002) in networks. A community is a subnetwork (i.e., a group of nodes) that is more densely connected internally than with the other nodes of the network. Formally, a subnetwork is a community if the number of triangles (set of three connected nodes) is more than , where is an arbitrary constant (Seshadhri, Kolda, & Pinar, 2012) and . This suggests that authors belonging to the same community on average have more affinity than authors belonging to different communities. This might also be inferred from the observation that different communities have particular properties in networks displaying both community structure and assortativity (Newman, 2006). In order to include the definition of communities in the definition of the affine group, let represent the set of nodes in the same community as at the instant . Thus, the affine group of a node at instant , denoted by can be given by the set . To compute we used the algorithm proposed by Newman (Newman, 2006) (see Appendix A) to identify the communities for each collaborative network. This algorithm searches for the network partition which maximizes the modularity function , given as
| (1) |
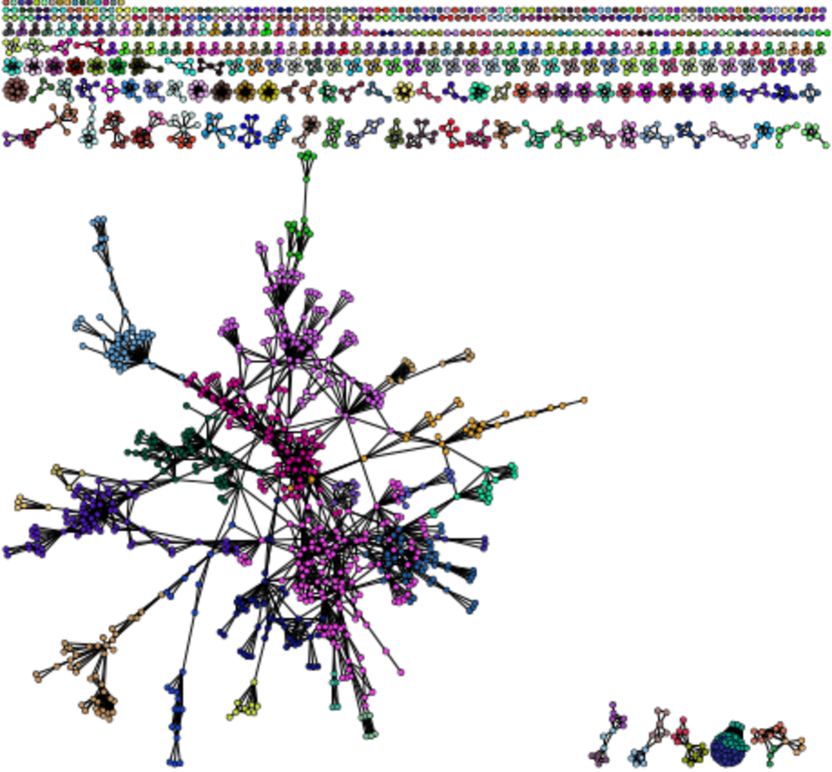
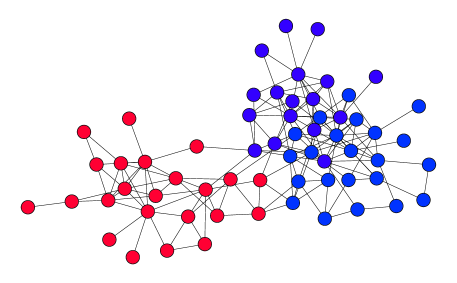
where is the number of edges and if nodes and belong to the same community and otherwise. We also assume that all the disjoint components with less than ten nodes correspond to a community. Therefore, the algorithm was applied only to the components with more than ten nodes. Figure 2 shows the partition of COMPNET in 2011.
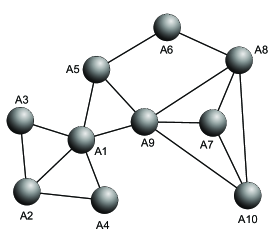
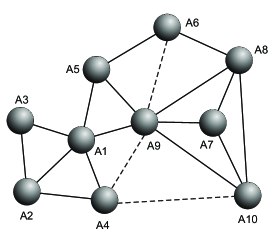
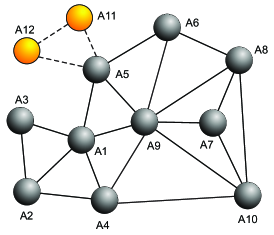
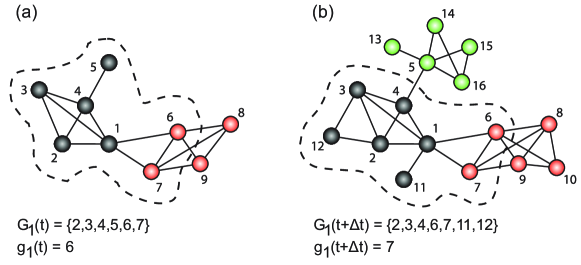
With respect to this definition, the affine group of a researcher is the set of people who could be specially interested in your work, or from who you are mostly interested in. It is important to note that the affine group of a given node changes over time, following the progress of network topology. In order to illustrate this concept, in Figure 3 we show a synthetic network at two different time instants as well as the affine group of node . In Figure 3(a) one can see that at instant , the network has 9 nodes and the affine group of node is given by . In Figure 3(b), we show the network at instant , which has evolved as consequence of the addition of new authors and new collaborations performed during the time interval . The affine group of node 1 is now given by . Therefore, we can observe that while node 5 no longer belongs to the affine group of node 1, two new nodes (11 and 12) joined this group. The dynamics of how the affine groups evolve along time is the main focus of this paper. It is intrinsically determined by how the authors interact and, consequently, how the communities present in this time-varying collaboration network merge to each other, or split themselves, creating new communities.
4 Results and Discussion
In Figure 4(a-d) we show the affine group of four different researchers of the network COMPNET as a function of time. The variable corresponds to each column for different values of . Yellow marks indicate that a given author belongs to the affine group of the reference node at that instant. The rows are sorted from the less active collaboration (top row) to the most active collaboration (bottom row). We see that, in general, the emerging patterns tend to be cumulative, in the sense that since a node was in the affine group of node in past, keeps inside this group in future. As a consequence, we expected that the size of the groups of collaboration tends to increase along time. It is easy to see that the size of a affine group as a function of time, denoted by , is given by the sum of the column in Figure 4.
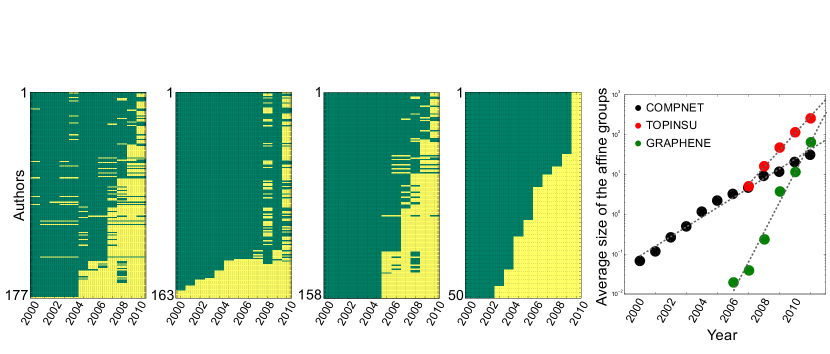
We also studied the average values of averaged over all authors for networks, COMPNET, TOPINSU and GRAPHENE, as a function of time. As the time progresses, the groups increased with average behavior given by an exponential growth. Indeed, when plotting the same curve in monolog scale, as shown in Figure 4(e), we note that the average values are well fitted by the function . Figure 4(e) also shows that the exponential behavior is not particular to COMPNET, since both GRAPHENE and TOPINSU also exhibit an exponential growth. In particular, the analysis of reveals that the average growth of affine groups in the network is faster in the TOPINSU network. On the other hand, in the COMPNET community, the development of affine groups appears to be more limited and restricted than the other reasearch fields in Physics. The values of and which best fit the data for each network are shown in Table 1.
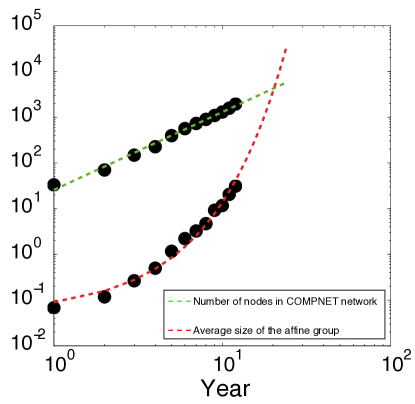
While the average size of the affine groups grows exponentially, we find out that the number of authors for the three studied networks grows only as power-law along time. This means that there is a tendency of emergence of a single, giant group. In other words, the connectivity patterns of the collaborative networks reveal the imminent emergence of a group of global collaboration. Interestingly, one can predict the emergence of such a group. In the case of COMPNET, there will be a unique affine group around the year 2020, as revealed in Figure 5.
4.1 Probability for a new connection
We also evaluated the probability of a new connection at instant link two nodes and , whichever of them was in the affine group of the other. In order to test the robustness of our findings, we report in Table 2 the values of along time normalized by z-score. To compute the z-score, we counted the number of new random edges that were established inside the affine group. This procedure was repeated 100 times and the average and standard deviation were computed. If represents the real number of new edges established inside the same affine group, then the z-score is defined as:
| (2) |
Note that the normalized version of given in equation 2 quantifies if the number of new links inside affine groups is greater than what would be expected just by chance. The values of Z are given in Table 2. With the exception of the network COMPNET in 2004, all observed values are positive. Remarkably, the z-score for TOPINSU and GRAPHENE are particularly high. This means that new collaborations are preferably established within collaborative groups. As such, this pattern could be used, for example, to suggest future collaborations as authors belonging to the same affine group probably shared the same research interests.
| Network | 2000 | 2001 | 2002 | 2003 | 2004 | 2005 | 2006 | 2007 | 2008 | 2009 | 2010 | 2011 |
|---|---|---|---|---|---|---|---|---|---|---|---|---|
| COMPNET | - | - | - | - | -0.31 | 4.27 | 10.43 | 4.01 | 9.80 | 2.84 | 6.30 | 0.57 |
| TOPINSU | - | - | - | - | - | - | - | - | 83.4 | 31.3 | 34.9 | 25.6 |
| GRAPHENE | - | - | - | - | - | - | - | - | - | - | 20.1 | 29.0 |
4.2 Authors classification
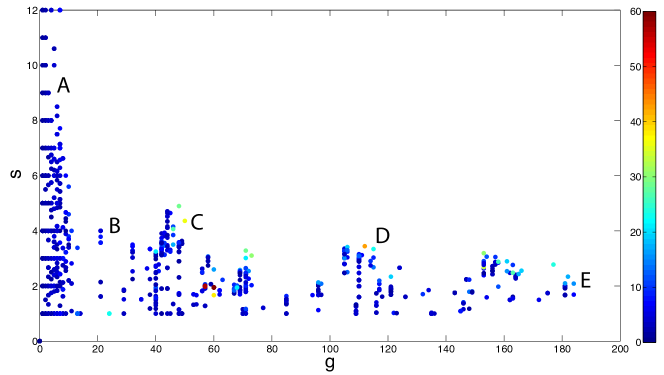
As it was shown in Figure 4, different authors tend to have different patterns of collaboration. For instance, the author shown in 4(a) has a kind of intermittent collaborations, which is the opposite of that observed for the author in 4(d). In order to investigate what these patterns tell us about the scientific community, we extracted the following features from the affine group of each author: i) - the maximum size of the affine group along the years, and ii) - the average size of the period in which authors were in the same affine group. Figure 6 shows how the authors are distributed according to these two attributes. It is clear from the overall distribution of authors in this figure that authors that tend to participate in larger affine groups also have shorter collaboration periods. On the other hand, authors in the region A of Figure 4 have small groups, but these groups last for long periods of time. Given that the nodes are colored according to their degree, it also follows from this figure that the previous result is not affected by the number of co-authors.
5 Conclusions
The problem of scientific collaboration has been addressed by a large number of works in terms of complex networks. However, the effect of time has not been usually taken into account. Actually, the study of time varying models of networks has been restricted to a few works (Perra, Gonçalves, Pastor-Satorras, & Vespignani, 2012). In the present article, we obtained sequences of networks from arXiv parameterized in terms of time, which allowed us to investigate the evolution of collaboration patterns. This was accomplished by defining the affine group of each author and then taking respective measurements regarding the number and duration of pairwise collaborations. Several interesting results have been obtained. First, we have that the size of the affine groups follows an exponential law, while the total number of authors grows as power law. This implies that a single affine group will eventually emerge. By using extrapolation, we were capable of predicting the date of such an event. Another interesting finding was that researchers tend to exhibit different patterns of collaborations as far as the intermittency is concerned. We mapped these patterns into a 2D space by using the size of the affine groups and the average duration of the collaborations. It followed from this result that authors that belong to large affine groups tend to have shorter collaboration periods. Another interesting finding is the fact that authors tend to collaborate mainly with colleagues belonging to their affine group, probably because they share the similar research interests. Further works could take into account the intensity of the collaborations (weighted complex networks) as well as investigate the dynamics of migration of authors between groups. Another possibility is to introduce a decay factor for edges weights so that old collaborations are straightforwardly disregarded from the analysis of collaboration patterns.
Acknowledgements
This work was supported by FAPESP (2010/00927-9, 2010/16310-0 and 2011/50761-2).
Appendix A Community detection in complex networks
A feature shared by many real systems modeled as complex networks is the presence of community structure (Girvan & Newman, 2002). Nodes of clustered networks tend to organize into groups with many internal connections (above than what would be expected just by chance) and a few external links to the other communities (Newman, 2006). Social and information networks (see e.g. (Liljeros, Edling, Amaral, Stanley, & Aaberg, 2001; Chen & Redner, 2010; Ding, 2011)) are some examples of networks displaying this type of organization. A large number of recent results suggests that real complex networks may display local properties that are very distinct from the global properties of the entire network, so that the focus on the network as a whole without considering the community structure may overlook many interesting features of the modeled system (Newman, 2006).
In the current paper, the method employed to detect communities is based on spectral decomposition (Mieghem, 2001). For simplicity’s sake, let us consider the case where the network comprises two communities. Let be the number of edges inter communities, given by:
| (3) |
where indicates that the sum is considered only if nodes and are placed in different communities. The membership of each node is stored in vector comprising elements. If node belong to community , then = 1. Otherwise, and belongs to . Note that, if we introduce in Equation 3, it can be rewritten as
| (4) |
Computing the local degree of as
| (5) |
the total degree of the network is given by
| (6) |
Replacing equation 6 in equation 4, one obtains
| (7) |
Because represents the number of edges inter-communities, the objective is to minimize this quantity. To do so, we first expand the Laplacian matrix as a linear combination of the eigenvectors :
| (8) |
where are the eigenvalues associated with . In order to minimize , one needs to associate the highest coefficients to the lowest eigenvalues . Thus, the objective is to position parallel to . Unfortunately, if one followed this optimization strategy a trivial solution would be obtained, since all nodes would belong to a single, giant community. For this reason, rather than , the eigenvector is chosen to set the direction onto is projected. To minimize the amount of inter communities edges, the best heuristic is to set whenever the -th element of is negative. Analogously, should be set to whenever the -th element of is positive, minimizing the inner product between and .
To exemplify how the algorithm works, we detected two communities in a social network depicted in Figure 7. As the figure reveals, two partitions were consistently identified. The method employed by (Newman, 2006) is very similar to the one described here. Rather than minimizing the number of edges inter communities, (Newman, 2006) maximizes the number of edges intra-communities that are above the expected just by chance using the modularity function. As well, they provide methods to identify the potential presence of more than two communities.
References
- (1)
- Amancio, Nunes, Oliveira Jr., & Costa (2012) Amancio, D. R., Nunes, M. G. V., Oliveira Jr., O. N., & Costa, L. da F. (2012). Using complex networks concepts to assess approaches for citations in scientific papers. Scientometrics, 90 2.
- Amancio, Oliveira Jr., & Costa (2012) Amancio, D. R., Oliveira Jr., O. N., & Costa, L. da F. (2012) Three-feature model to reproduce the topology of citation networks and the effects from authors visibility on their h-index. Journal of informetrics, 6.
- Amancio, Oliveira Jr., & Costa (b) Amancio, D. R., Oliveira Jr., O. N., & Costa, L. da F. (2012) On the use of topological features and hierarchical characterization for disambiguating names in collaborative networks. Europhysics Letters, 99.
- Chen & Redner (2010) Chen, P., & Redner, S. (2010) Community structure of the physical review citation network. Journal of Informetrics 4 3.
- Costa, Rodrigues, Travieso, & Villas Boas (2007) Costa, L. da F., Rodrigues, F. A., Travieso, G., & Villas Boas, P. R. (2007). Characterization of complex networks: a survey of measurements. Advances in Physics, 56, 167-242.
- Ding (2011) Ding, Y. (2011). Community detection: Topological vs. topical. Journal of Informetrics 5.
- Girvan & Newman (2002) Girvan, M., & Newman, M. E. J. (2002) Community structure in social and biological networks. Proc. Natl. Acad. Sci. USA 99
- Hsiang, & Rebecca (2012) Hsiang, L. C., & Rebecca, Y. H. (2012) Quantifying the degree of research collaboration: A comparative study of collaborative measures. Journal of Informetrics 6 1.
- Liljeros, Edling, Amaral, Stanley, & Aaberg (2001) Liljeros, F., Edling, C. R., Amaral, L. A. N., Stanley, H. E., & Aaberg, Y. (2001). The web of human sexual contacts. Nature 411
- Lusseau, Schneider, Boisseau, Haase, Slooten, & Dawson (2003) Lusseau, D., Schneider, K., Boisseau, O. J., Haase, P., Slooten, E., & Dawson, S. M. (2003). The bottlenose dolphin community of Doubtful Sound features a large proportion of long-lasting associations. Can geographic isolation explain this unique trait ? Behavioral Ecology and Sociobiology 54
- Newman (2006) Newman, M. E. J. (2006). Finding community structure in networks using the eigenvectors of matrices. Phys. Rev. E 74, 036104.
- Newman (2004) Newman, M. E. J. (2004) Coauthorship networks and patterns of scientific collaboration. Proc. Natl. Acad. Sci. USA 101.
- Newman (2001) Newman, M. E. J. (2001). The structure of scientific collaboration networks. Proc. Natl. Acad. Sci. USA 98.
- Mieghem (2001) Mieghem, P. (2011) Graph Spectra for Complex Networks. Cambridge University Press.
- Perra, Gonçalves, Pastor-Satorras, & Vespignani (2012) Perra, N., Gonçalves, B., Pastor-Satorras, R. & Vespignani, A. (2012) Activity driven modeling of time varying networks. Scientific Reports, 2 469.
- Persson (2010) Persson, O. (2010) Identifying research themes with weighted direct citation links. Journal of Informetrics, 4 3.
- Roth, Wu, & Lozano (2012) Roth, C., Wu, J., & Lozano, S. (2012) Assessing impact and quality from local dynamics of citation networks. Journal of informatrics, 6 1.
- Seshadhri, Kolda, & Pinar (2012) Seshadhri, C., Kolda, T. G., & Pinar, A. (2012) Community structure and scale-free collections of Erdös-Rényi graphs. Physical Review E 85 5
- Shrum, Chompalov, & Genuth (2001) Shrum, W., Chompalov, I., & Genuth, J. (2001) Trust, conflict and performance in scientific collaborations. Social Studies of Science, 31 5.