SED-inferred properties and morphology of Lyman-break galaxies at in the CDF-S
Abstract
After carefully cross-identifying a previously discovered GALEX-selected Lyman Break Galaxy (LBG) candidates one-to-one with their optical counterparts in the field of the CDF-S, we re-estimate their photometric redshifts using multi-wavelength data from UV, optical to NIR. With the consideration of their re-estimated photometric redshifts and SEDs, we refine a new updated sample of 383 LBGs at with two confirmed AGNs being excluded.
260 and 111 LBGs are classified as starburst and irregular types. Ages of LBGs spread from several Myr to 1.5Gyr with a median of Myr. Their dust-corrected star formation rates (SFRs) and stellar masses () are from to and from to with median values of and . The rest-frame FUV luminosity function of LBGs are presented with the best-fit Schechter parameters of , and , respectively.
LBGs of irregular types mainly distribute along the “main sequence” of star forming galaxies while most LBGs of starburst types locate in the starburst region. Together with previous studies, we suggest that the star formation mode for LBGs at is mainly starburst and it evolves to be more significant to the quenching mode after . A “downsizing” effect is clearly found with its physical implications and the comparisons with previous studies being discussed in detail. LBGs with larger SFRs are on average more compact. In the rest-frame color - diagram, LBGs distribute in the “blue” cloud. We suggest that LBGs may evolve along the blue “cloud” from later to earlier types.
HST images in F606W ( band) and F850LP ( band) are taken from the GEMS and GOODS-S surveys for morphological studies of LBGs. SExtractor and GALFIT are applied to get their morphological parameters. We establish an image gallery of 277 LBGs commonly detected in both bands by visually classifying individual LBGs as types of “chain”, “spiral”, “tadpole”, “bulge” and “clump”, respectively. A morphological sample of 142 LBGs with reliable results of and sizes in both bands is defined. We find that LBGs at are dominated by disk-like galaxies, with their median sizes of and in F606W and F850LP. Correlations between photometric and morphological properties of LBGs are investigated. Strong correlations between their half-light radii and , i.e., size-stellar mass relations, are found in both bands. Physical connections between correlations and the “downsizing” effect are discussed.
keywords:
galaxies: evolution - galaxies: Lyman break galaxies - galaxies: SEDs - galaxies: morphology1 Introduction
It is well established that massive galaxies are results of mergers of small ones (White & Frenk 1991; Cole et al. 2000; Somerville et al. 2001). Disks and ellipticals form due to gas angular momentum by tidal torques and through mergers among disks, respectively (e.g., Mo et al. 1998; Efstathiou 2000; Steinmetz & Navarro 2002; Governato et al. 2007; Croft et al. 2009; Scannapieco et al. 2009). The epoch of major mergers ends at for the brightest and most massive systems (Conselice et al. 2003 and the references therein). Although this hierarchical scenario of galaxy formation and evolution has archived great successes to explain a lot of observational phenomena in general, there still exist some poorly known fields, such as the role of AGN feedback, star formation, morphological evolution, etc. Details can be seen in the the recent review by Silk & Mamon (2012).
Currently there are two regimes that we understand the global evolution of galaxies well. One is the local universe where disk and elliptical galaxies have been studied in very detail for several ten years (see Longair 2006 for a detailed review; de la Fuente Marcos & de la Fuente Marcos 2009; van Dokkum & Conroy 2010; Bell et al. 2010; Boissier 2010; Tempel et al. 2011). Especially after the two-degree Field Galaxy Redshift Survey (2dFGRS, Colless et al. 2001) and the Sloan Digital Sky Survey (SDSS, York et al. 2000) which provide huge multi-color and spectroscopic galaxy samples with big sky coverages, many important and global statistical results have been obtained and taken as the “zero points” to calibrate the paradigm of galaxy formation and evolution as a whole (e.g., Blanton et al. 2003, 2005; Blanton 2006; Shen et al. 2003; Tremonti et al. 2004; Chang et al. 2006; Shao et al. 2007; Salim et al. 2007; Kauffmann et al. 2003a,b; Kauffmann et al. 2008; Abazajian et al. 2009; Li et al. 2008; Li & White 2009). Together with deep surveys, such as COMBO 17 (Wolf et al. 2004), DEEP2 (Madgwick et al. 2003; Davis et al. 2003) and COSMOS (Scoville et al. 2007), samples of more than galaxies with either photometric or spectroscopic redshifts from local to have shown the picture of galaxy evolution from half-age of the universe to the present day (Bell et al. 2004, 2006; Borch et al. 2006; Faber et al. 2007; Gerke et al. 2007; Conroy et al. 2007; Scoville et al. 2007; Yan et al. 2009; Jahnke et al. 2009; Salim et al. 2009; Maier et al. 2009; Kova et al. 2010; Coppa et al. 2010; Cucciati et al. 2010; Cooper et al. 2011).
The other is at high redshift (), where color-selected samples of galaxies, pioneering by Steidel et al. (1995), have been established, such as Lyman break galaxies (Adelberger et al. 1998), sub-mm galaxies (Smail et al. 2004), distant red galaxies (Franx et al. 2003) and BzK galaxies (Daddi et al. 2004). For instance, more than 1000 Lyman break galaxies (hereafter LBGs) at have been found and confirmed by the follow-up spectroscopic observations with further studies (Steidel & Hamilton 1993; Steidel et al. 1996; Pettini et al. 2000; Teplitz et al. 2000; Giavalisco 2002; Steidel et al. 2003). Applying the Lyman break technique to different bands, star forming galaxies at different redshift ranges are also successfully found. Wilkins et al. (2010), for instance, found 6 candidates of star forming galaxies at by comparing images of the Y (980nm) band in WFC3 with those of z (850nm) band in ACS from the observations of Hubble Space Telescope (HST). Adopting the multi-wavelength imaging data of the European Southern Observatory (ESO) Remote Galaxy Survey, Douglas et al. (2009) established a sample of 257 LBGs at . Using , and filters in the SUBARU deep field, Ouchi et al. (2004) compiled a large sample of 2600 LBGs with at . Based on FUV and NUV data in the Galaxy Evolution Explorer (GALEX) deep fields, Burgarella et al. (2006, 2007) obtained a very deep sample of LBG candidates at cross-correlated with optical data from COMBO 17. Nilsson et al. (2011a) analyzed slitless grism observations by HST ACS for 15 LBGs at drawn from the sample of Burgarella et al. (2007) and concluded that they are young while massive and dusty. Also based on GALEX data but cross-correlated with optical data from SDSS, Haberzettl et al. (2009) obtained a shallower sample of LBGs than that of Burgarella et al. (2006, 2007) at with the sky coverage of 1 .
Between these two regimes, i.e., named as the “redshift desert” (Steidel et al. 2004), many efforts have been devoted in recent years. Genzel et al. (2006, 2008, 2010, 2011), for instance, studied star forming galaxies at according to the Spectroscopic Imaging survey in the Near-infrared with SINFONI (SINS) at ESO’s Very Large Telescope (VLT). They found that disks appear at with star forming regions being very clumpy. Huang et al. (2009) established a sample of Ultra Luminous IR galaxies (ULIRGs)111ULIRGs defined by their IR luminosities at by the selection of IRAC color criterion and claimed that ULIRGs at that redshift display variable morphologies in their rest-frame UV band. Conselice et al. (2011) found that massive galaxies at show the bimodality in the color-magnitude space according to deep NIR surveys utilizing the NICMOS on HST. With the Photodetector Array Camera & Spectrometer (PACS) (Poglitsch et al. 2010) onboard newly launched Herschel Space Telescope (Pilbratt et al. 2010), Nordon et al. (2010) investigated star formation rates of massive galaxies at in the field of GOODS-N. By analyzing both their SEDs from rest-frame UV to mid-IR and direct 160 m FIR observations by PACS, Oteo et al. (2012) found that spectroscopically selected star-forming Ly emitting galaxies at show ages mostly below 100 Myr with a wide variety of dust attenuations, SFRs, and stellar masses, and their morphology is suggested to range from bulge-like galaxies to highly clumpy systems. According to the Herschel observations, Magdis et al. (2010b) investigated FIR properties of mid-IR-selected ULIRGs at and Bongiovanni et al. (2010) studied FIR counterparts of selected Ly emitters at . By the dropout from GALEX data, Burgarella et al. (2011) established a sample of LBGs at and analyzed their FIR luminosities. Nilsson et al. (2011b) studied Ly emitters at in the COSMOS field and found that their stellar masses are higher than those at higher redshift. Taking the similar method, Haberzettl et al. (2012) established a sample of 73 LBG candidates at recently, with the median stellar mass of and most of them showing disk-like structures. Basu-Zych et al. (2011) studied LBGs at based on observations in the Chandra Deep Field South (CDF-S) by the UV/Optical Telescope (UVOT) instrument on board Swift (Gehrels et al. 2004) together with multi-wavelength data. They found that their LBGs have stellar masses slightly lower than those at and slightly higher than CDF-S galaxies.
So far, one of the key questions in galaxy formation and evolution, i.e., how galaxies evolve from high to present day, arises after so many distant galaxies have been found. Most of the current studies focus on photometric properties, such as color, spectrum features, size, mass and spatial clustering, to understand the connections between high- and local galaxies. For instance, spectra of some bright LBGs (Pettini et al. 2000; Teplitz et al. 2000) are remarkably similar to those of local starbursts with their UV luminosities directly relating to the number of short-lived, massive stars. Sub-mm observations reveal a population of FIR-bright galaxies that might be similar to local (Ultra) Luminous IR galaxies ((U)LIRGs)222LIRGs defined by their IR luminosities (Blain 1999). Based on the correlation length of clustering, Shu, Mao & Mo (2001) suggested that LBGs and SCUBA galaxies at correspond to present-day bulges of disk galaxies (see also Giavalisco et al. 1996) and giant ellipticals, respectively. Heckman et al. (2005) and Hoopes et al. (2007) suggested that local () Lyman break analogs have similar UV surface brightness to high redshift LBGs, different from Scarpa et al. (2007).
Although most galaxies at high redshift must somehow be the progenitors of modern galaxies, that connecting specific high redshift populations to low-redshift counterparts remains a complicated issue (Delgado-Serrano et al. 2010). Yet, we still have very little knowledge of when and how the modern Hubble sequence came into place. The direct way is to investigate morphologies of galaxies at different redshifts and compare with local galaxies. It is not an easy task since it strongly depends on the resolutions and sensitivities of the observing facilities. Some observations have shown that morphologies of galaxies at appear very irregular, very different from local either ellipticals or disks (Giavalisco et al. 1996). Familiar Hubble types are observed with perhaps similar comoving volume densities at to those at (van den Bergh et al. 2000). Galaxies at high- are characterized observationally by compact structures with high surface brightness in their central regions and are harder to detect their outer regions with lower surface brightness. So it is difficult to analyze their morphological properties. As pointed out by Burgarella et al. (2001), only compact star forming regions could be easily detected in deep HST observations.
In the present paper, we study the photometric and morphological properties of LBGs at in detail, adopting broad multiwavelength data from UV, optical to NIR together with high quality HST images from the Galaxy Evolution from Morphologies and SEDs (GEMS) survey and the Great Observatories Origins Deep Survey (GOODS). The preliminary LBG candidate sample is taken from Burgarella et al. (2007). The structure of this paper is as follows. The description of the worked sample is set in Sect. 2. Detailed studies on photometric properties of LBGs are arranged in Sect. 3. HST images obtained from the GEMS and GOODS surveys and visual classifications are described in Sect. 4. Morphological properties are studied in Sect. 5. Correlations between photometric and morphological properties of LBGs are in Sect. 6 with conclusions in Sect. 7.
Throughout the paper the “concordance” cosmology with and is taken. The Hubble constant is with if needed. Under this cosmology, the luminosity distance and the angular diameter distance are and , respectively at , with the size scale being and the age of the universe being 5.75Gyr. Moreover, magnitudes are in the AB system (Oke & Gunn 1983) and colors are given in the rest-frame unless otherwise stated.
2 The LBG Sample
2.1 Preliminary sample and photometric data
The preliminary LBG candidate sample at redshift used in the present paper is described by Burgarella et al. (2007) (hereafter B07), and belongs to CDF-S. It can be briefly summarized as follows. Based on the deep (76 444s) near ultraviolet (NUV) image available in GALEX Release 2 (GR2) centered at and (J2000.0), and the deep (44 668s) image survey (DIS) in far ultraviolet (FUV) also by GALEX (Martin et al., 2005), B07 cross-identified GALEX sources within a radius of 2 arcsecs to their optical counterparts in the field of 0.263deg2 overlapped with COMBO 17 (Wolf et al. 2004). LBG candidates are selected among sources with , taking the criteria and the photometric redshift data from COMBO 17 into account. Discarding objects classified in COMBO 17 with the flags as ‘Star’, ‘WD’, ‘QSO(gal)’ and ‘Strange Object’, 420 LBG candidates, with the completeness of 80% down to , are selected with their photometric redshifts from COMBO 17 between 0.9 and 1.3. Among them, two candidates have quadruple counterparts found in COMBO 17, 40 have pair counterparts and the other 378 have single counterparts individually. Moreover, 62 among 420 LBG candidates have been detected in the 24m MIPS image by Spitzer. Based on SED studies, B07 obtained a median age of 250Myr and a median star formation rate of for their LBG candidates. A typical dust attenuation in of is estimated for candidates with 24 detections, while the other candidates without 24 detections display less with . Details can be found in B07.
Note that the MUSYC catalog (Cardamone et al. 2010, see below in this subsection for details), which is available more recently than COMBO 17, can be also adopted to select LBG candidates. If we replace the COMBO 17 catalog by the MUSYC catalog and take the same processes as B07, 442 LBG candidates are found with more than 85% objects common to B07. The difference is not significant for the statistical studies on the LBG population at . Moreover, taking the updated catalog of COMBO 17 (Wolf et al. 2008) into account, we find that more than LBG candidates in B07 can still be selected as LBG candidates and the mean offset of the photometric redshifts is only 0.015. Although the MUSYC catalog covers more bands, the COMBO 17 catalog displays higher survey sensitivity and spectral resolution. We prefer to keeping the selection of B07 for the following studies. It should be pointed out that the sample of B07 is unbiased, much deeper and more complete than their previous ones (Burgarella et al. 2006). For more clarity, we plot the distribution of B07 LBG candidates in the field of the CDF-S in the upper panel of Fig. 1, with diamonds “” and circles “”, squares “” and crosses “+” denoting candidates with single counterparts and multiple counterparts in COMBO 17, spectral data available from the MUSYC catalog and other previous studies, and AGNs respectively (see this section below).
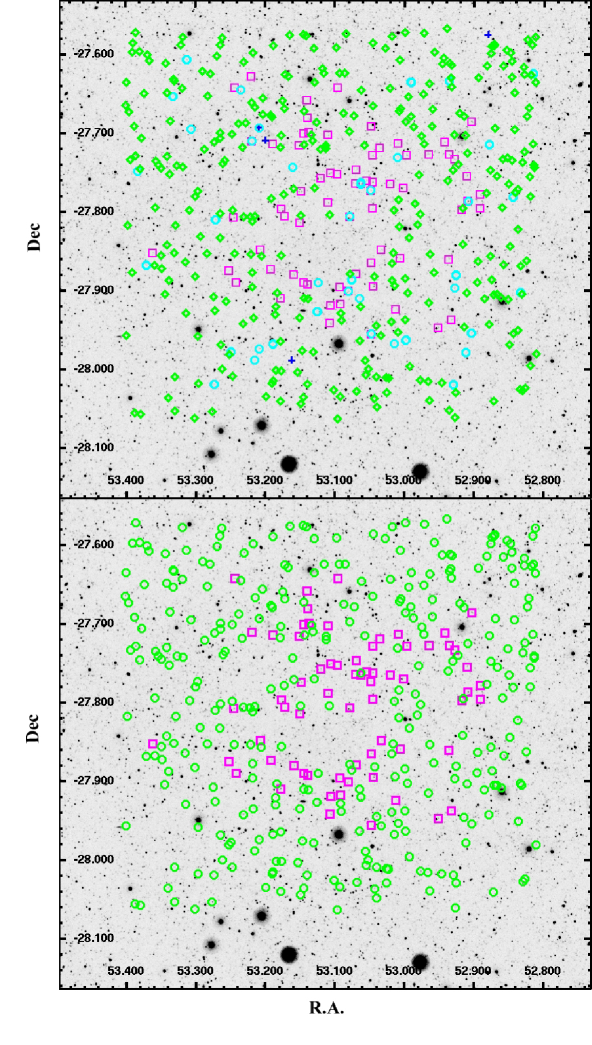
Image resolutions of UV and IR observations are too low, e.g., in FUV and in NUV for , for us to investigate morphological properties of LBGs at . Optical images by HST are adopted for the morphological studies (see Sect. 5 for details). So, identifications of optical counterparts for individual LBG candidates must be carefully performed. We start to re-do the cross-identifications of optical counterparts in the catalog of COMBO 17 for LBG candidates, taking the same processes proposed by B07. Since the space resolution of GALEX is 2.55 arcsecs (B07) and the intrinsic astrometric precision of COMBO 17 is about 0.5 arcsecs (Wolf et al. 2004), together with the astrometric precision of smaller than 0.2 arcsecs between the catalogs of COMBO 17 and MUSYC (Cardamone et al. 2010, see below), an appropriate radius of 3 arcsecs is taken in the present paper for cross-identifications.
Slightly different from B07, two LBG candidates in B07 with quadruple optical counterparts are found as one with four counterparts and the other one with two counterparts in COMBO 17. One candidate with pair counterparts in B07 is found to have a single counterpart. For the other LBG candidates, we have the same results of optical counterparts found in COMBO 17 as B07. To summarize, we find among 420 LBG candidates that 40 have pair, 1 has four and the other 379 (378 in B07) have single optical counterparts in COMBO 17, respectively. In total, 463 optical counterparts are found.
It is important to check the contamination of Active Galactic Nuclei (AGNs) in our LBG candidate sample. According to Silverman et al. (2010), based on optical spectra of X-ray sources, four confirmed AGNs are found among LBG candidates in B07, with UV IDs 81300, 39096, 68162 and 69870. Their corresponding spectral redshifts are 0.688, 0.652, 0.979, and 0.972, respectively. These four AGNs are classified as LBG candidates with single counterparts above. Note that only three AGNs, which are among the above four, can be found in the 2 Ms CDF-S catalog (Luo et al. 2008, 2010). It means that the AGN fraction in our LBG preliminary sample is , which is a bit less than those of LBGs at (Basu-Zych et al. 2011) and (Steidel et al. 2003; Lehmer et al. 2008). Since we focus on photometric and morphological studies for LBGs, they are excluded in the following part of the paper. So the number of LBG candidates becomes 416 with 375 among them found to have single optical counterparts in COMBO 17.
Since cross-identifications are done within a radius of 3 arcsecs centered on the coordinates of individual LBG candidates, it can be reasonably assumed that counterparts of those 375 LBG candidates with only single counterparts are their “true” optical counterparts individually. For those candidates with more than one counterparts in COMBO 17, more accurate estimates of their redshifts are needed for further identifications. To study in detail the photometric properties of LBGs at , FUV, NUV and more wavelength observations must be considered to re-estimate their photometric redshifts rather than simply taking the results from the optical catalog of COMBO 17 only (see subsection below).
Thanks to the Multiwavelength Survey by Yale-Chile (MUSYC) BVR selected catalog which covers the field of the present study with multi-wavelength data available from optical to NIR together with several tens of spectroscopic data from other observations (Cardamone et al. 2010). The main features of the MUSYC BVR selected catalog are as follows. In the catalog, UBVRI data are from ESO archive collected and calibrated as part of GaBoDS (the Garching-Bonn Deep survey, Hildebrandt et al. 2006) and -band data are from the Mosaic-II camera on the CTIO 4m Blanco telescope (Gawiser et al. 2006; Taylor et al. 2009). -band data are obtained from SofI on the ESO NTT3.6 telescope (Moy et al. 2003) and -band data are from the ISPI camera also on the CTIO Blanco 4m telescope (Taylor et al. 2009). The IRAC data in four channels (m, 4.5m, 5.8m and 8.0m) are from the Spitzer IRAC/MUSYC public Legacy in the ECDF-S (SIMPLE) project (Damen et al. 2011), respectively. Photometric redshifts of individual objects in MUSYC are also listed. Note that the magnitude limit of the MUSYC BVR catalog is , a bit shallower than COMBO 17 which is (Wolf et al. 2004; Faber et al. 2007). Details of the MUSYC BVR catalog are referred to Cardamone et al. (2010).
| counterpart(s) | COMBO | MUSYC | |
|---|---|---|---|
| single | 375 | 351 | 60 |
| pair | 40 | 36 single | 9 |
| 2 pair | 1 | ||
| four | 1 | 1 single | / |
| total | 459 | 392 | 70 |
Aiming to extend the observational wavelength coverage of COMBO 17 for the photometric redshift re-estimates of LBG candidates, we perform cross-identifications for the optical counterparts of LBG candidates found in COMBO 17 to those in the MUSYC BVR catalog. The astrometric precision less than 0.2 arcsecs between two catalogs enables us to do cross-identifications without any multi-counterpart problems from the COMBO 17 to MUSYC BVR catalogs. Since the magnitude limit is a bit shallower than that of COMBO 17, less number of counterparts are found in the MUSYC BVR catalog. Among 375 LBG candidates with single counterparts found in COMBO 17, 351 candidates are found with single counterparts and the rest 24 candidates are found without any counterparts in the MUSYC BVR catalog. For 40 LBG candidates with pair counterparts in COMBO 17, 2 and 36 candidates are found with pairs and single counterparts available, respectively, while the rest 2 candidates are found with none counterparts. For the one candidate with 4 counterparts in COMBO 17, only one counterpart is found in the MUSYC BVR catalog. Totally, 392 counterparts are found in the MUSYC BVR catalog among 459 counterparts in COMBO 17 for 416 LBG candidates in B07. There are 70 and 66 among these 459 and 392 counterparts in the COMBO 17 and MUSYC BVR catalogs, respectively, with spectral data available from the MUSYC BVR catalog, the K-selected catalog of Taylor et al. (2009) and the recent work done by Nilsson et al. (2011a).
Detailed results of the cross-identifications are summarized in Table 1. The first and second columns in Table 1 denote the number of counterparts of an LBG candidate and the corresponding numbers of LBG candidates found in COMBO 17. The third column denotes the results of cross-identifications from the COMBO 17 to MUSYC BVR catalogs and the fourth column shows the number with the spectroscopical data available, respectively.
2.2 Photometric redshifts of the preliminary sample
As in the previous subsection, the preliminary LBG sample is selected in UV together with photometric redshifts from their optical counterparts in COMBO 17. Most of the counterparts are also available in the MUSYC BVR catalog with NIR and IR data. The MUSYC BVR catalog covers observed spectral energy distributions (SEDs) with more bands while the COMBO 17 catalog shows higher sensitivity and spectral coverage in general. Both of them provide good estimates of photometric redshifts globally. It is interesting to compare in Fig. 2 the photometric redshifts of the 392 counterparts available in both the COMBO 17 and the MUSYC BVR catalogs. Although the global accuracies of photometric redshifts for both catalogs are high, it can be found from the figure that many counterparts of the LBG candidates show significantly different photometric redshifts between two catalogs.

It must be pointed out that FUV and NUV data which are adopted to select LBG candidates at are not taken into account for redshift estimates in either the COMBO 17 or the MUSYC BVR catalog. So, it is worthy of re-estimating photometric redshifts for optical counterparts of LBG candidates individually, combining FUV and NUV data from B07 and data from MUSYC/COMBO 17 together.
We re-estimate photometric redshifts of individual counterparts for LBG candidates by fitting their observed SEDs to templates by the code Hyperz333http://webast.ast.obs-mip.fr/hyperz/ (Bolzonella et al. 2000), taking the extinction law as Calzetti et al. (2000). The templates adopted are the BC03 (Bruzual & Charlot 2003) templates with the assumptions of an exponentially decaying star formation history and a star formation time scales for different types (Bolzonella et al. 2000), the mean SEDs of local galaxies (Coleman, Wu & Weedman 1980, hereafter CWW) and the observed starburst templates of Arp220 types (Huang et al. 2009). The spectral types (with the star formation time scales if available) and their corresponding SpT numbers of different templates are listed in Table 2 respectively.
Considering survey sensitivity (Wolf et al. 2004, 2008), broad band data from COMBO 17 are preferred in the following studies although intermediate-band data would have favored a more accurate estimate of photometric redshifts. Moreover, the calibration update of the COMBO 17 (Wolf et al. 2008) has been taken into account. For the 392 counterparts of LBG candidates available in the both COMBO 17 and MUSYC BVR catalogs (see Table 1), we take data of 13 bands, i.e., FUV, NUV, U, B, V, R, I, z, J, H, K, m and 4.5m (the latter two from IRAC), to fit their SEDs. For the rest 67 counterparts available only in the COMBO 17 catalog, data of 7 bands, i.e., FUV, NUV, U, B, V, R and I, are taken. Since dust emission feathers are not taken into account for the BC03 templates, we have ignored 5.8m and 8.0m data of IRAC for the specific case of galaxies at .
| Spectral type (SpT) | Templates | (Gyr) |
|---|---|---|
| E (1) | BC03 | 1 |
| E (2) | CWW | – |
| S0 (3) | BC03 | 2 |
| Sa (4) | BC03 | 3 |
| Sb (5) | BC03 | 5 |
| Sbc (6) | CWW | – |
| Sc (7) | BC03 | 15 |
| Scd (8) | CWW | – |
| Sd (9) | BC03 | 30 |
| Irr (10) | BC03 | |
| Irr (11) | CWW | – |
| dusty (12) | CWW | – |
| Burst (13) | BC03 | |
| Arp220-modifying (14) | Arp220-rebuilt | – |
| Arp220 (15) | Arp220 | – |
∗ Note that and 0 correspond to a constant star formation rate and a single burst, respectively.
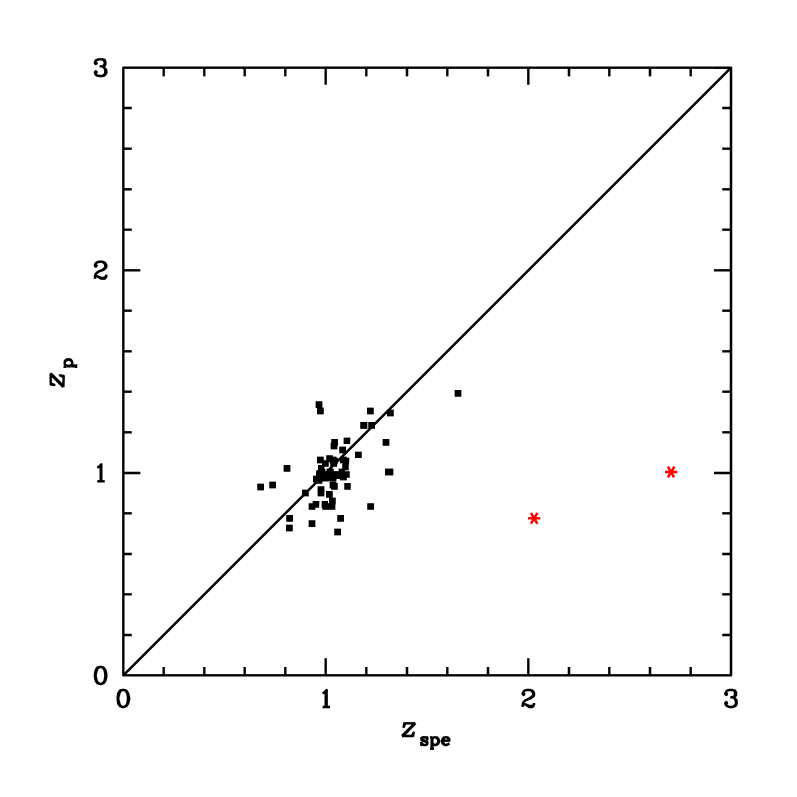
As can be seen in Table 1, there are 70 among 459 optical counterparts of LBG candidates with known spectroscopic data. We compare their re-estimated photometric redshifts with their spectroscopic redshifts in Fig. 3. Two counterparts with their UV IDs 67958 and 59121 in B07 (IDs 56523 and 42593 in MUSYC) are labeled in the figure as “” because of their unreliable spectroscopic redshifts due to very bad spectroscopic observations. To quantitatively clarify, we list uncertainties of our re-estimated photometric redshifts for LBGs candidates as a function of their apparent magnitudes in -band in Table 3. The corresponding uncertainties for the specific case of LBGs candidates in the COMBO 17 and MUSYC BVR catalogs are also listed in the table. Four AGNs and two counterparts with bad quality in spectral observations are excluded in the table. Here and in the table are defined respectively as the average of , i.e., the mean offset of to in a given magnitude range, and its corresponding standard deviation. The first column in the table lists the magnitude ranges in -band. Columns 2-4 are results of and for the present paper, the COMBO 17 (C) and the MUSYC (M) catalogs, respectively.
It can be seen from the figure that our re-estimated photometric redshifts of counterparts agree well with their corresponding spectral data if available, except two with unreliable spectroscopic redshifts. It can be also found from Table 3 that the averaged offset overall is -0.017 with its deviation of 0.063 for re-estimated photometric redshifts, comparable to those from the COMBO 17 and the MUSYC catalogs. For counterparts with , which contains half of spectral data available, the accuracies of our re-estimated photometric redshifts are better than those from the COMBO 17 catalog and a bit worse than those from the MUSYC catalog, respectively. To further demonstrate the goodness of SED fittings for LBG counterparts, the distribution of reduced (per degree) is shown in Fig. 4. It can be found that most of SED fittings are good () with a median value of 1.8 for . Together with Fig. 3 and Table 3, it can be concluded that our photometric redshift re-estimates are fairly good. Note that there are 15 counterparts with large , because most of them are very bright with small magnitude error bars, especially in NIR bands. Discussions of reliability for the SED fittings are in next subsection.
| , | , (C) | , (M) | |
| -0.021, 0.061 | 0.014, 0.021 | 0.002, 0.014 | |
| -0.020, 0.063 | -0.014, 0.041 | -0.004, 0.024 | |
| 0.002, 0.061 | 0.015, 0.089 | 0.027, 0.074 | |
| -0.067, 0.062 | 0.082, 0.097 | 0.017, 0.045 | |
| total | -0.017, 0.063 | 0.009, 0.072 | 0.010, 0.050 |

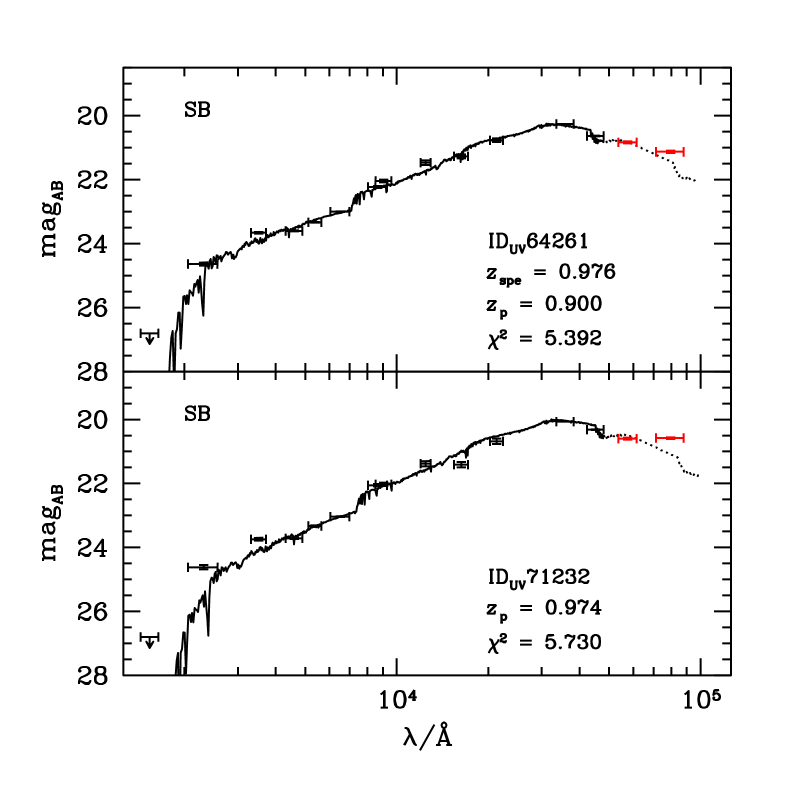
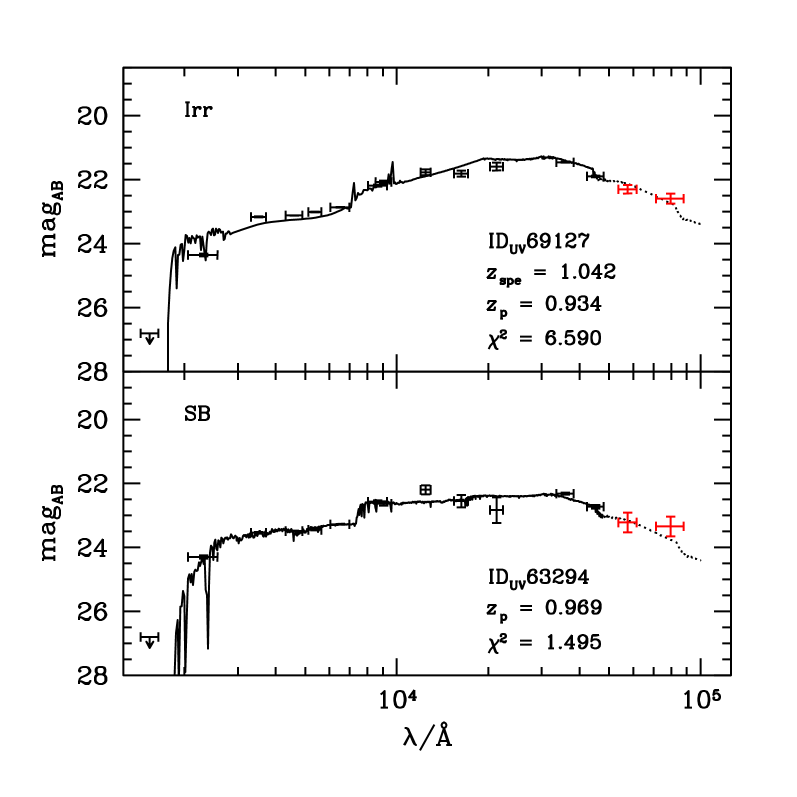
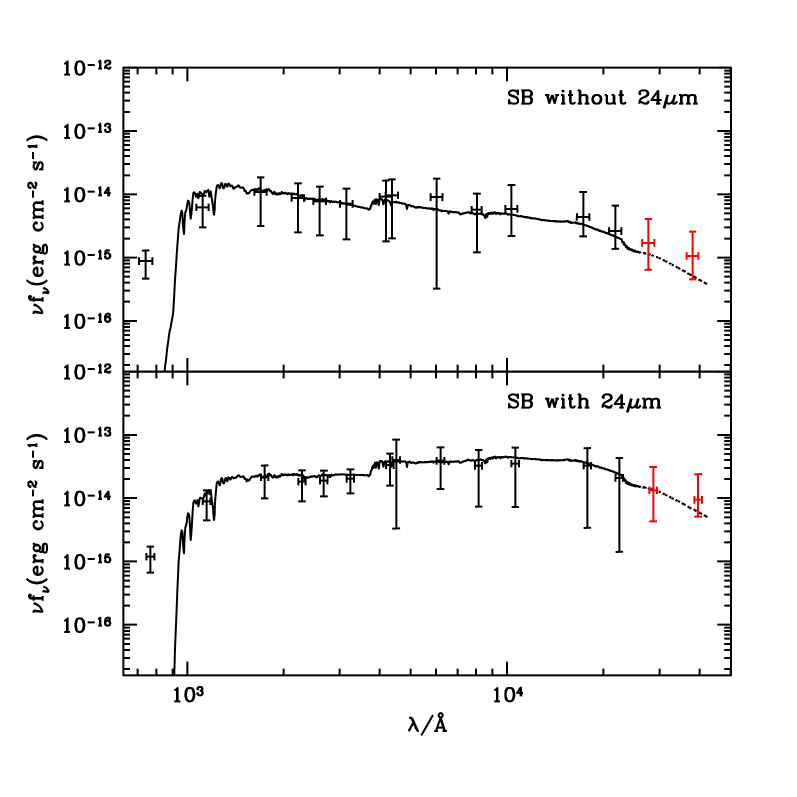
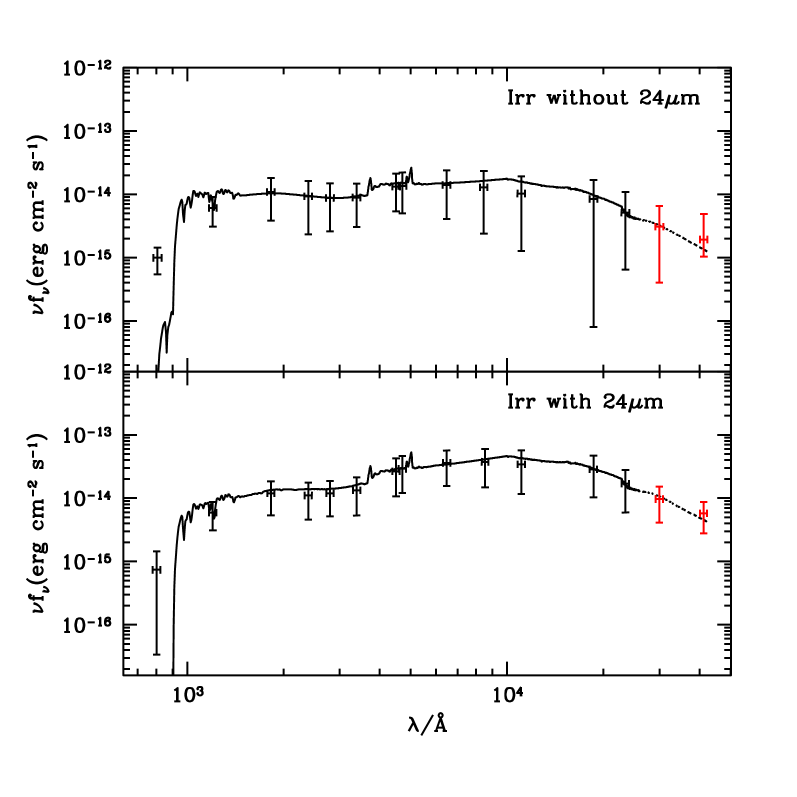
As examples, Figs. 5 and 6 show individually SED fittings of two LBG candidates without/with 24m detections from B07, i.e., Blue-/Red-LBG candidates (see next subsection), respectively, available in both the COMBO 17 and the MUSYC catalogs. Their corresponding IDs in UV from B07 are labeled in the figures. In each figure one LBG candidate with (upper panel) and the other one without (lower panel) spectroscopic redshifts are selected for clear comparison with their reduced (not small), re-estimated photometric and spectroscopic redshifts being labeled. They are classified as three starburst (SB) galaxies and an irregular (Irr) galaxy. The arrows in the figures are upper limits of the flux detections. The dashed lines are the extrapolations of template SEDs since 5.8m and 8m data of IRAC are not taken into account during SED fittings. Together with Table 3 and Figs. 3 & 4, it further shows that our results of SED fittings for LBG candidates are good.
]
Comparisons of photometric redshifts (replaced by if available) between our re-estimated results with those in the COMBO 17 and available in the MUSYC catalogs are interesting and shown in Fig. 7. It can be clearly found that there exist significant differences between our results and COMBO 17. Since we use broader coverage in wavelength, especially UV and NIR data, than COMBO 17 to estimate photometric redshifts, the quality of our re-estimated for the specific case of LBGs candidates at should be better (see also Table 3). Moreover, the agreement between our results and MUSYC is better mainly because NIR data have been included in MUSYC. Note that there still are some outliers of LBG candidates between our re-estimated photometric redshifts and those from the MUSYC catalog (see the lower panel of Fig. 7). After checking carefully, two sources (MUSYC IDs of 56523 and 42593) with their spectral redshifts in the MUSYC catalog have very bad quality in their spectroscopic observations (see also Fig. 3). For the other outliers with photometric redshifts higher than 1.6 or lower than 0.5 in the MUSYC catalog, they are either very bright or very faint in NIR bands compared to their optical magnitudes. This leads to over- or under-estimating their photometric redshifts if FUV and NUV are not considered as in the MUSYC catalog. We conclude that the consideration of UV data really plays an important role in the determination of photometric redshifts for LBG candidates.

2.3 Sample refinement
The processes of selecting the “true” optical counterpart of an LBG candidate are as follows. There are 70 counterparts with spectroscopic redshifts available from previous studies. We replace the photometric redshifts of 68 among these 70 counterparts by their observed spectroscopic redshifts except two with very bad spectroscopic observations (see previous subsections). The counterparts of 375 LBG candidates with only single counterparts are assumed to be their corresponding counterparts as discussed above. For a candidate with pair or four counterparts, their re-estimated photometric/spectroscopic redshifts firstly and the reduced during SED fittings secondly are considered for its “true” counterpart selection. If only one counterpart with photometric redshifts/spectroscopic is within the range , we assume this one to be the “true” optical counterpart of the candidate firstly, since the selection criterion of strongly suggests that it biases to locate at . If more than 2 counterparts of a candidate with their re-estimated photometric redshifts or none of them are within the redshift range, the counterpart with smaller is selected as the “true” counterpart.
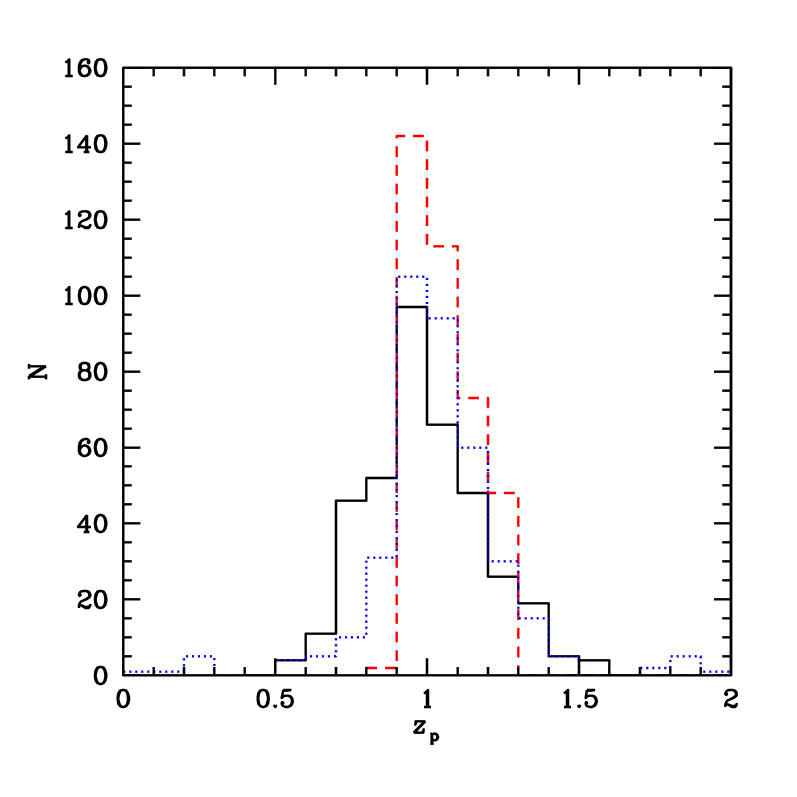
Now we have finished the determination of the “true” optical counterparts of all 416 LBG candidates selected by from the preliminary LBG sample of B07 with 4 AGNs being excluded. The distribution of their re-estimated photometric (spectroscopic if available) redshifts is plotted as the solid histogram in Fig. 8. For comparison, the distributions of the original photometric redshifts from COMBO 17 and the results of 394 candidates from MUSYC are also plotted as the dashed and dotted histograms in the figure. It can be found that the re-estimated photometric (spectroscopic if available) redshifts of all LBG candidates are between 0.5 and 1.6, because of the selection criterion as expected. Almost two thirds of LBG candidates (268 of 416) are within the redshift range of as B07. The numbers of candidates are 339 and 387 within the redshift ranges of and , respectively.
Although the goodness of SED fitting is parameterized by , we need to check the reliability of individual LBG candidates one by one, especially for 15 objects with . We find that 399 among 401 LBG candidates with display reliable SED fittings except two candidates (UV IDs of 64312 and 75583) with their resulted of 0.883 and 0.802 respectively, showing very uncertain photometric data. A candidate of UV ID 47588 with its resulted and displays a very strange SED with a shape jump from , to ( and ). Since the error bars of its photometric data is , it is hard to find a template to fit it reliably. Moreover, a candidate with its UV ID of 54502, and shows its SED with a bump between and bands and then drops very steeply from band to m. Together with its magnitudes in m and m which are much brighter than its magnitude in m, we suggest that its SED fitting is unconvincing. For the rest 13 candidates with , we find that their SED fittings are reasonable, together with the consideration of the extrapolations of the SED fittings to m and m. Their large values are because of small photometric error bars in individual bands. In total, 4 candidates with unreliable SED fittings are discarded in the following studies.
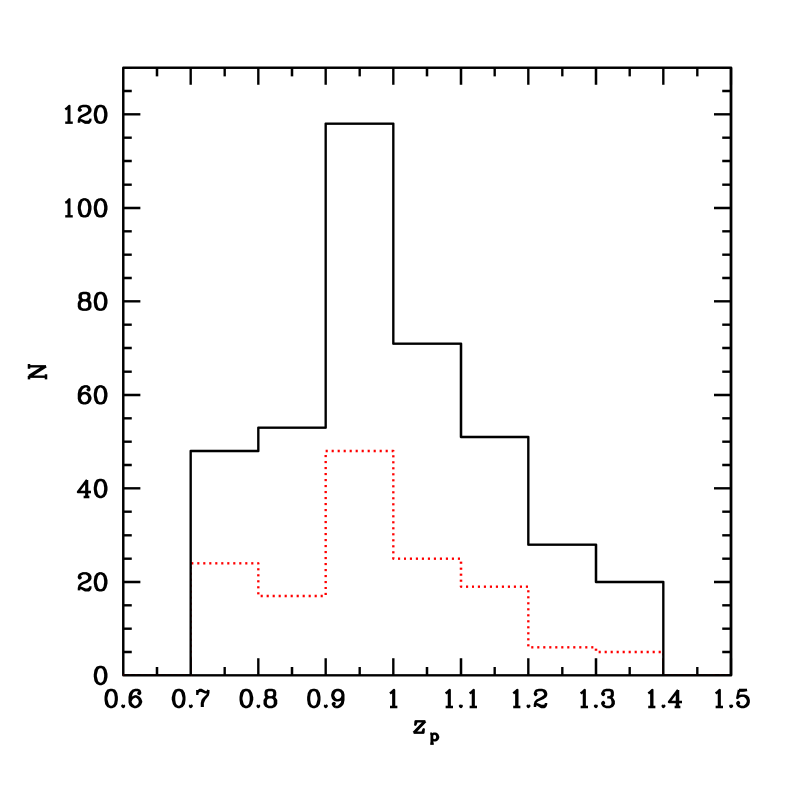
We define 383 LBG candidates with reliable SED fittings at to be our LBG sample at for the further studies below because of the following three reasons: (1) the Lyman limit, i.e., 912, moves to 1550 at redshift 0.7, just away from the effective wavelength of FUV, 1530; (2) the Lyman limit leaves from NUV if redshift larger than 1.4; and (3) the uncertainty of re-estimated photometric redshifts obtained above is about 0.1 at . To clarify and easily compare, we plot the distribution of LBGs in the field of the CDF-S in the lower panel of 1 with circles “” and squares “” denoting LBGs without and with spectral data available from the MUSYC catalog and other previous studies. Their redshift distribution as the solid histogram and the corresponding distribution of 142 LBGs for morphological studies (see Sect. 5 for details) as the dashed histogram are plotted in Fig. 9, respectively.
Note that two AGNs would be included in the LBG sample if we only consider the color selection criterion and the redshift range. Comparing with Steidel et al. (2003) and Lehmer et al. (2008), the AGN contamination () is smaller for LBGs at than LBGs at (). It may imply that the connection between star formation activities and AGNs is stronger at higher redshifts for color selected samples. Moreover, we take the same criterion of with/without 24m detections to classify Red-/Blue-LBGs as suggested by B07 in the present paper. For our LBG sample at , there are 324 (85%) and 59 (15%) Blue- and Red- LBGs, among total 383 LBGs, respectively.
3 Photometric properties of LBGs
3.1 Spectral types
To investigate the spectral type (SpT) of a galaxy through its SED fitting, we have to bear in mind that its resulted and SpT during SED fitting are degenerated with each other. To check the reliability, we consider results of the second solutions of photometric redshifts for individual LBGs. As expected, the reduced residuals of SED fittings for , named as , of individual LBGs are always larger than . More than 70% of LBGs show larger than 7.8. The median value of for LBGs is 16.7 while that of is 1.8. There are more than 80% and 70% of LBGs with smaller than 4 and 3, while about 10% and 5% of them show smaller than 4 and 3, respectively. This means that the contamination of the degeneracy between and SpT for LBGs is less than 5% in a “” level. We further check spectral types of LBGs with when the second solutions are adopted. It is found that more than half of them still display the same types as obtained for the first solutions. We conclude that spectral types of LBGs obtained through SED fittings are reliable for the further studies below.
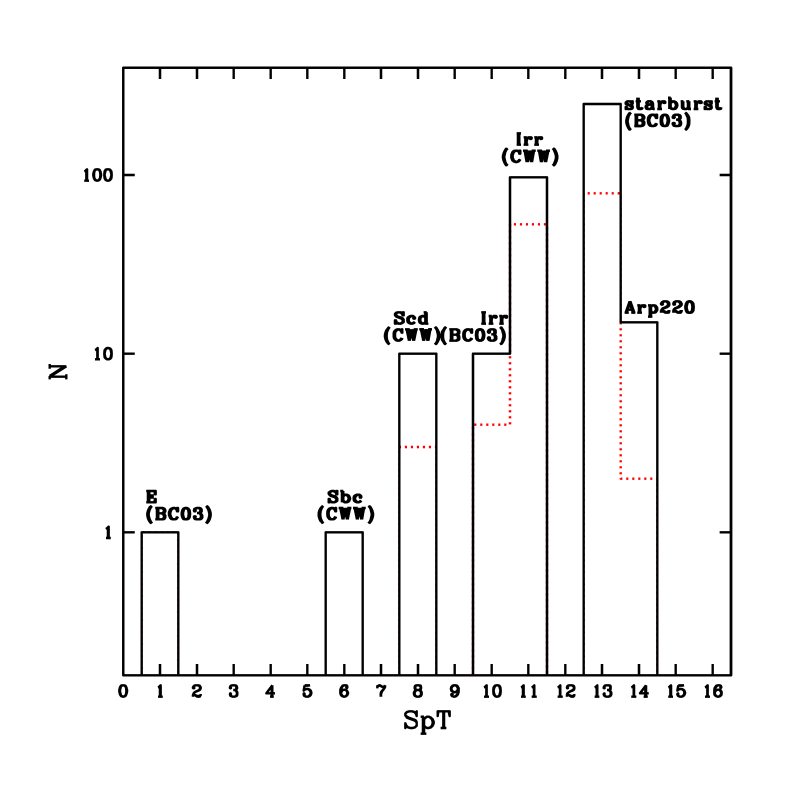
The distribution of spectral types for LBGs is shown in Fig. 10 as the solid histogram with the corresponding templates, i.e., SpT numbers, being listed in Table 2. It can be clearly found from the figure that LBGs in our sample are dominated by starburst galaxies, with 249 and 15 LBGs being classified as BC03 and Arp 220 types, respectively. There are 97 and 10 LBGs being classified as CWW and BC03 type irregulars. Moreover, 10 and 1 LBGs are classified as CWW type Scd galaxies and a CWW type Sbc galaxy respectively. The spectral type distribution is consistent with the selection of LBGs which must be star forming galaxies at . And it is also in consistence with that most of LBGs for morphological studies are late type galaxies with their indexes smaller than 2 in Sect. 5 .
Note that only one LBGs in our sample with its UV ID of 74754 is classified as a BC03 type elliptical galaxy at with the age of Gyr. The reduced of its SED fitting is 7.68, relatively larger than most LBGs but still acceptable. Its star formation rate and stellar mass are and (see below). Note that its second solution of the SED fitting is not reliable because of very large with . It is detected in both F606W and F850LP bands with its morphology being classified visually as a “bulge” LBG (see Sect. 4). Its indexes are of 0.7 and 2.2 with the similar sizes of in two bands respectively (see Sect. 5). It implies that the distribution of its star formation activity is extended while that of stars is compact. Since LBGs are selected according to their rest-frame UV luminosities (star formation activities), early type galaxies with star formation rates higher than the selection criterion can be selected as LBGs, although they are rare such as only one in our sample.
To investigate statistical properties of different spectral types in the following studies, we always divide LBGs into the “starburst” (SB) group for starburst type LBGs, the “irregular” (Irr) group for irregular type LBGs and the “S+E” (EST) group for spiral and elliptical type LBGs. Note that spectral types are later to earlier from the SB, Irr to EST groups. The numbers of LBGs are 264 (227 blue and 37 red), 107 (92 blue and 15 red) and 12 (5 blue and 7 red) for the SB, Irr and EST groups respectively. The fraction of Blue-/Red-LBGs decreases/increases from the SB, Irr to EST groups, in consistence with spectral types obtained. Since the number of LBGs in the EST group is too small to have statistical significance, we mainly focus on the SB and Irr groups for statistical discussions and take the EST group for only illustration in the following studies.
3.2 SEDs and UV luminosity function
Because of the limitation of the paper space, we do not show SED fitting results of LBGs individually. Instead, we compile figures of SED fitting results for LBGs with images detected both available in F606W and F850LP bands in Table 6, together with their IDs, morphological parameters and images (see Sect. 5 for details).
The ages of LBGs spread from several Myr to 1.5Gyr with a median value of Myr, comparable to Haberzettl et al. (2012) for LBGs at and Papovich et al. (2001) for LBGs at . Similar to Shapley et al. (2001), we find 10% of LBGs, classified as SB types, are with ages younger than 10Myr which is different from Haberzettl et al. (2012) for LBGs at . To be more specific, the median ages for LBGs in the SB and Irr groups are 30Myr and 800Myr, respectively. It is consistent with that ages of galaxies are younger generally for later types. Similar to B07, the median ages of Red- and Blue-LBGs are 400Myr and 250Myr, respectively. Moreover intrinsic reddening of individual LBGs can be simply obtained through the adopted dust extinction law of Calzetti et al. (2000). We find that the dust extinctions in their rest-frame for Blue- and Red-LBGs show narrow distributions with the median values to be 1.7 and 2.5 magnitudes respectively, which is consistent well with B07.
For easy comparison with observations, we plot the averaged SEDs in the rest-frame for Red- and Blue-LBGs, i.e., with and without 24m detection, in the SB and Irr group at in Figs. 11 and 12, respectively. The mean observed data with error bars are also shown in the figures. Same as the previous section, data of the two reddest bands by IRAC, i.e., 5.8m and 8m, are plotted to compare with the extrapolations of SEDs as dashed lines since the templates adopted do not consider the dust emission features.
It can be found from the figures that LBGs in the SB group on average are brighter in their rest-frame UV than LBGs in the Irr group. This is consistent with that starburst galaxies are on average more active in star formation than irregular galaxies. Within each group, LBGs with m detections, i.e., Red-LBGs, are on average brighter in their rest-frame NIR, i.e., on average more massive in their stellar masses, than LBGs without m detections, i.e., Blue-LBGs (see also next subsection).
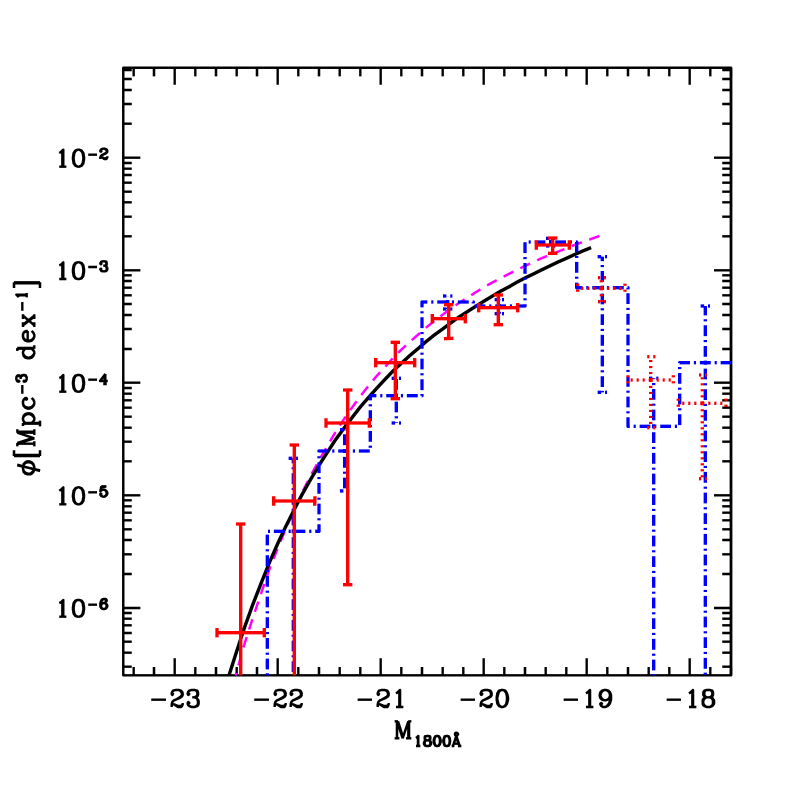
Luminosities of individual LBGs in the rest-frame FUV can be estimated through their SEDs. As pointed out by B07, the completeness of the LBG sample is 83% down to . To be more safe, we adopt as the completion of the LBG sample (see also Burgarella et al. 2008), which corresponds to the absolute magnitude at . Based on the widely adopted method suggested by Schmidt (2009) and considering uncertainties of individual luminosity bins due to uncertainties of photometric redshifts, we obtain the rest-frame FUV () luminosity function (LF) of LBGs at , which is shown as points in Fig. 13, simply taking the error bars as Poisson statistics. Note that the points with solid and dashed error bars denote the complete and incomplete parts of LBG sample respectively. Adopting the Levenberg-Marquardt method (see Zaninetti 2008), we fit the rest-frame FUV LF of LBGs by a Schechter function as the solid line in Fig. 13, without considering its incomplete part. We get , and , respectively. For easy comparison, the rest-frame FUV LF for LBG candidates in B07 and NUV selected galaxies at by Arnouts et al. (2005) are also plotted as the dash-dotted histogram with error bars and the dashed line in the figure, respectively. We find that our FUV LF agrees well with that of B07 for . It decreases faster for since the number of LBGs in our sample is 10% less and the redshift range is wider in the present paper. We also find that the rest-frame FUV LF of LBGs at the bright end well matches the LF of NUV selected galaxies at (Arnouts et al. 2005). And it is lower by a factor less than 2 even at the complete magnitude of . It implies that most of NUV selected galaxies at are selected as LBGs, in consistence with the results obtained by B07.
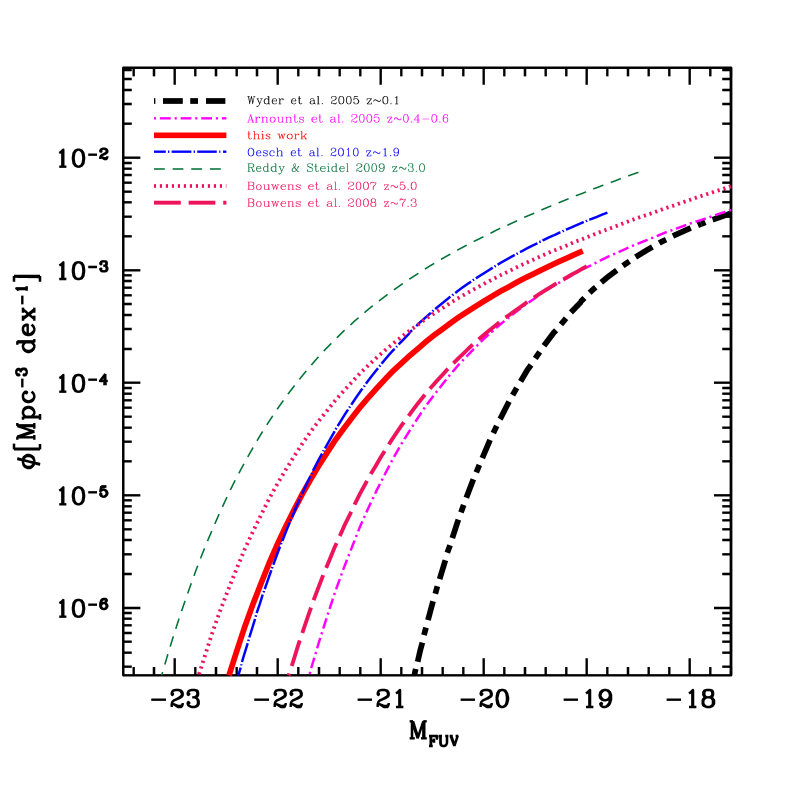
For further comparison, previous results of LFs in the rest-frame FUV () at different redshifts, together with ours, are listed in Table 4. We also plot in Fig. 14 the Schechter functions fitted to FUV LFs at different redshifts listed in Table 4 individually, except that of (Arnouts et al. 2005) shown in Fig. 13. As can be seen, our result of locates in the trend of monotonic fading of from to , in consistence with Reddy & Steidel (2009) and Oesch et al. (2010). For the faint-end slope , our result is similar to that of Arnouts et al. (2005) for NUV selected galaxies at and along the trend that increases with the decreasing of redshift (Reddy & Steidel 2009). For , our result also agrees well with Arnouts et al. (2005) within a factor less than 2 (see above). Detailed discussions on the evolution of FUV LFs can be seen in Reddy & Steidel (2009).
Same as B07, we can also estimate the contribution of luminosity density in FUV for the Blue- and Red-LBGs in our sample to be
and
respectively. Comparing with B07, the contributions of our LBG sample contains 75% FUV luminosity densities in 1800 of the total NUV-selected galaxies at .
| z | refs | |||
|---|---|---|---|---|
| 0-0.1 | 1 | |||
| 0.4-0.6 | 2 | |||
| 0.8-1.2 | 2 | |||
| 0.7-1.4 | this work | |||
| 1.7-2.1 | 3 | |||
| 2.7-3.4 | 4 | |||
| 3.8 | 5 | |||
| 5.0 | 5 | |||
| 7.3 | 6 |
3.3 SFRs and stellar masses
We can estimate the star formation rates (SFRs) of individual LBGs according to their rest-frame NUV flux as suggested by Kennicutt (1998)), i.e.,
| (1) |
which is obtained by converting the calibration of Madau et al. (1998) to a Salpeter (1955) initial mass function with the stellar mass range from 0.1 to . Dust corrections of individual LBGs are taken into account according to their SEDs and the extinction law adopted. As discussed in the previous subsection, the dust corrections are on average similar to the median values obtained by B07, respectively, for Red-/Blue-LBGs with/without 24m detections.
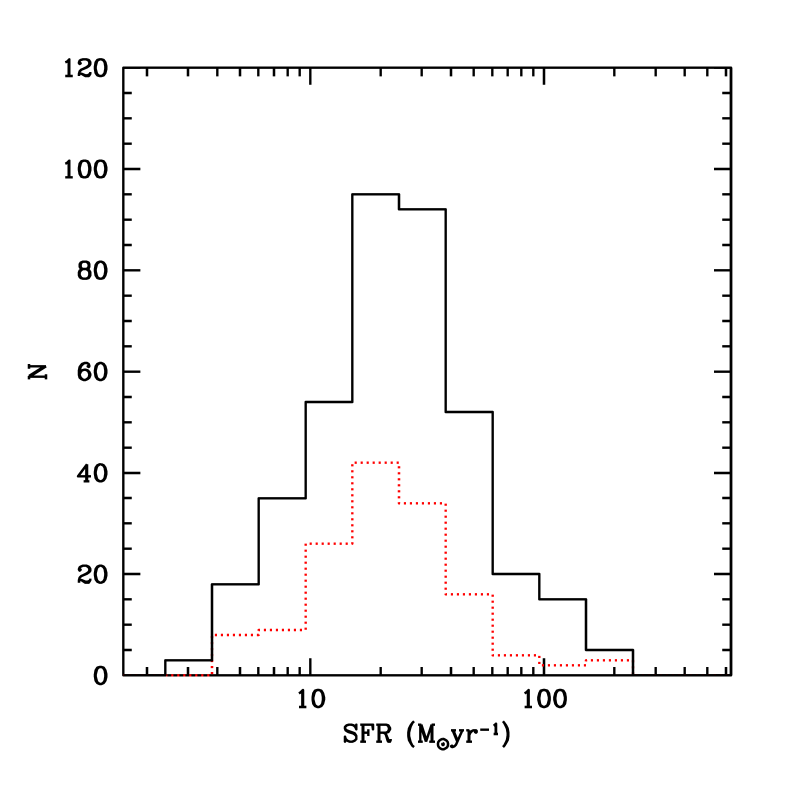
The dust-corrected SFR distribution of LBGs at is plotted in Fig. 15 as the solid histogram, with the dashed histogram denoting the SFR distribution of LBG for morphological studies in Sect. 5. It can be seen from the figure that dust-corrected SFRs of LBGs range from to with a median value of . The median SFR is similar to that of LBGs at (Shapley et al. 2001; Steidel et al. 2003), and a bit smaller than (comparable to) those of LBGs at (Verma et al. 2007) and at (Haberzettl et al. 2012). Moreover, the mean dust-corrected SFR for LBGs in the SB group is , larger than that for LBGs, , in the Irr group, as expected in the previous subsection.
Stellar masses of individual LBGs are obtained as follows. For an LBG with a given SpT type of the BC03 template, its star formation history is assumed to be exponentially decaying with a given timescale (see Sect. 2.2 and Table 2). We can calculate its mass-to-light ratio, , for any given bands as a function of its age. In the present study, of the rest-frame -band is calculated. So, stellar masses of LBGs classified as BC03 templates can be obtained through their rest-frame band luminosities according to their spectral types (star formation histories) and ages. For LBGs classified as Arp220 and CWW types, we calculate their stellar masses according to their rest-frame -band luminosities, taking the suggested by Huang et al. (2009) and a simple constant , respectively.
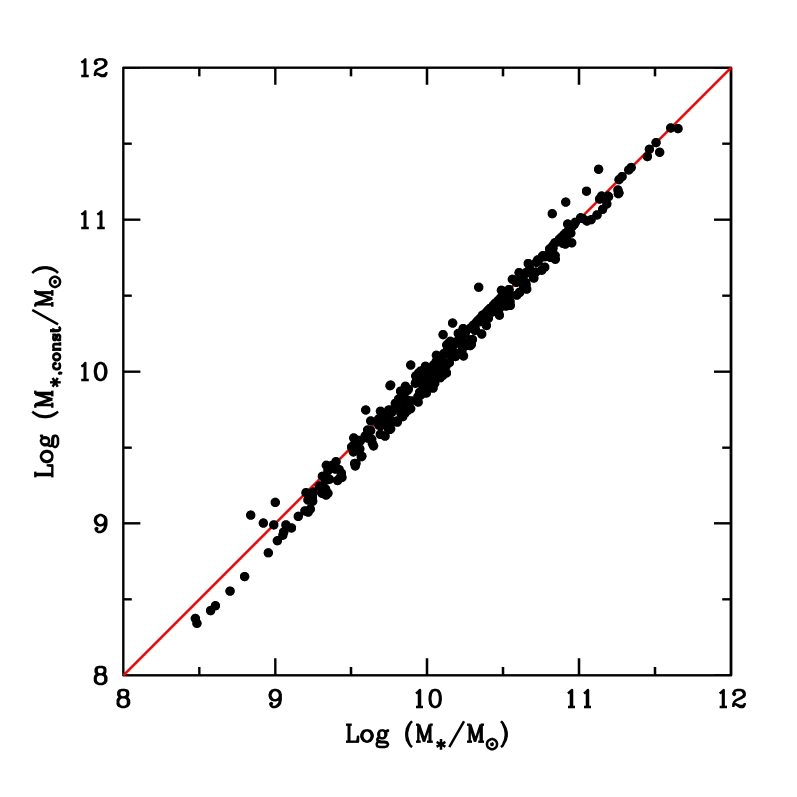
As pointed out by the previous studies (e.g., Kauffmann & Charlot 1998; Bell & De Jong 2001; Drory et al. 2004), the -band luminosity of a galaxy is insensitive to its star formation history. A simple way to estimate the stellar mass of a galaxy is to adopt a constant mass-to-light ratio in -band, e.g., (Zheng et al. 2007), since varies very slowly for young stellar populations and increases within a factor of two for stellar populations older than 3Gyr (Drory et al. 2004). Comparison between stellar masses of LBGs obtained in the present paper () and () by simply taking a constant for all LBGs is plotted in Fig. 16. It can be seen from the figure that stellar masses obtained by these two methods are in good agreement with each other within a factor of 2, since ages of LBGs in the present study are younger than 1.5Gyr. This also further confirms that rest-frame -band luminosity is a good indicator to estimate stellar mass of a galaxy, especially when its age younger than 3Gyr (Drory et al. 2004).
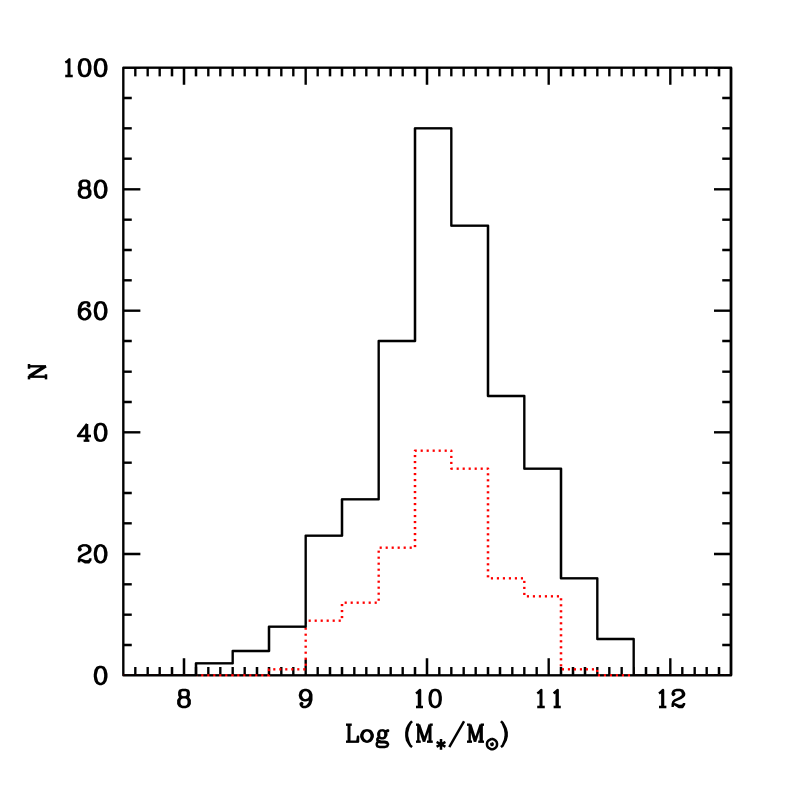
The distribution of stellar masses for LBGs at is shown in Fig. 17 as the solid histogram. Same as Fig. 15, the corresponding distribution of LBGs for morphological studies in Sect. 5 is also plotted as the dashed histogram. We can see that stellar masses of LBGs in our sample distribute from to , with a median value of which is a bit smaller than those for LBGs at (Haberzettl et al. 2012) and at (Shapley et al. 2001; Papovich et al. 2001), and about a factor of 10 bigger than that of LBGs at (Verma et al. 2007). Moreover, the mean stellar masses for Red-LBGs in the SB and Irr groups are and , larger than those of and for Blue-LBGs in the SB and Irr groups, respectively. This is consistent with the discussions in the previous subsection that Red-LBGs are on average brighter in their rest-frame NIR, i.e., more massive in stellar masses, than Blue-LBGs.
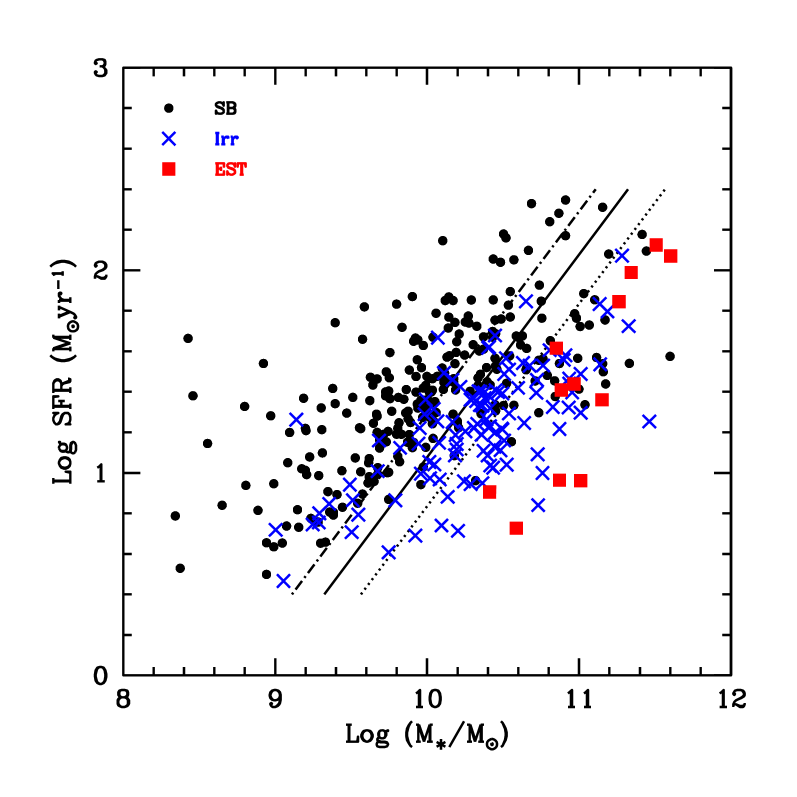
The correlation between SFRs and for LBGs in our sample is shown in Fig. 18 with dots, crosses and squares denoting LBGs in the SB, Irr and EST groups respectively. LBGs of individual groups show clear trends that SFRs increase with the increasing of . Studying IR SEDs of galaxies at in detail, Elbaz et al. (2011) established a prescription of the “main sequence” for star forming galaxies with the uncertainty of dex (i.e., a factor of 2) and defined starbursts at different redshifts. Similar result is also obtained by Sargent et al. (2012). For comparison, we plot in Fig. 18 the lower limits of the defined starbursts (Eq. (14) in Elbaz et al. 2011) at , 1, and 0.7 as dash-dotted, solid and dotted lines for illustration, respectively. For a given line in the figure (i.e., a given redshift), its upper-left part denotes the starburst region and its lower-right region within a factor of 4 in SFR (y-axile) of the line denotes the “main sequence” of star forming galaxies.


It can be seen from the figure that LBGs in the EST and Irr groups distributes along the “main sequence” of star forming galaxies suggested by Elbaz et al. (2011), with the considerations of uncertainties and the redshift range. Most of LBGs in the SB group locate in the “starburst” region, away from the “main sequence”. It is in consistence with the spectral type classifications of these LBGs during SED fittings. Distances to the “main sequence”, i.e., the inverse way of star forming timescales, increase on average for LBGs from the EST, Irr to SB groups. Farer distances to the main sequence imply more dramatic in star formation. Because two thirds of LBGs are classified in the SB group, it means that LBGs are dominated by active star forming galaxies from either a spectral type or a star forming timescale point of view.
It is interesting that median of LBGs increases very rapidly from to and then varies slowly to while median SFRs are similar for LBGs at different redshifts (see above in this section). If we simply extrapolate the prescription suggested by Elbaz et al. (2011) and Sargent et al. (2012) to , the “main sequence” of star forming galaxies changes by a factor of while the median SFR/ changes by a factor of from to . It implies that the star formation mode for LBGs at might be mainly starburst with the significance increasing with . And it might evolve to be more significant to the quenching mode after . This possible picture is in consistence with that the epoch of major mergers ends at (Conselice et al. 2003, 2011). We suggest that fraction of starburst galaxies increases with redshift for LBGs at .
3.4 The “downsizing” effect
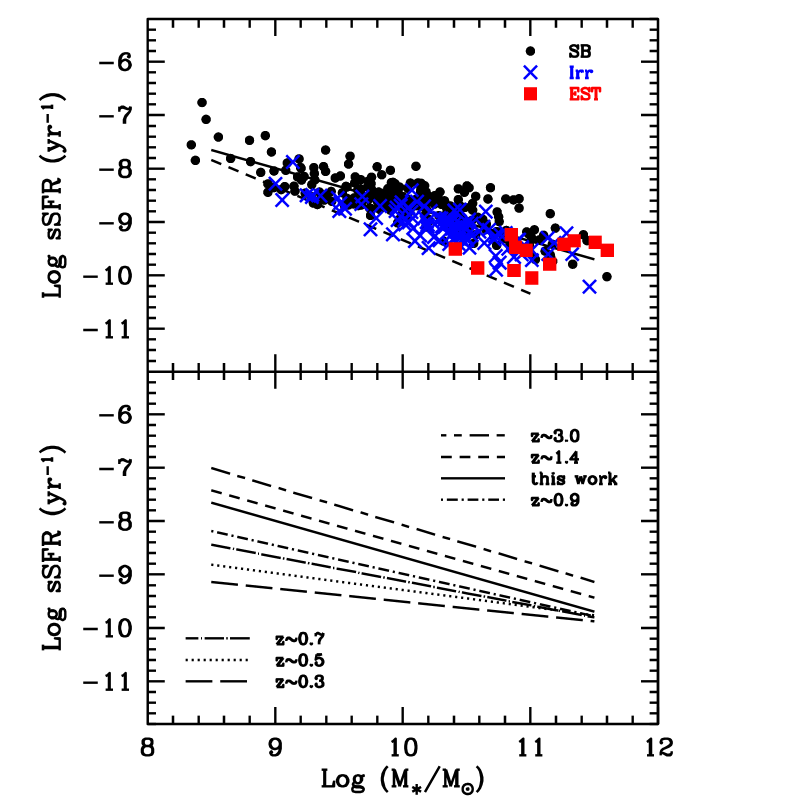
The correlation between specific star formation rates (sSFR), i.e., , and stellar masses of LBGs is plotted in the upper panel of Fig. 19 with the same notations of points as Fig. 18. Dashed and solid lines, respectively, denote the observational limit of and the simple least square fitting to the data with the slope of . A clear trend for LBGs can be seen from the figure, i.e., the “downsizing” effect, that sSFR decreases with the increasing of stellar mass , except the observational limit in . It can be found also from the figure that the significance of this “downsizing” effect decreases for LBGs from the SB, Irr to EST groups, It is in consistence with that distance to the “main sequence” decreases for LBGs from the SB, Irr to EST groups (see the previous subsection). The “downsizing” effect indicates that LBGs with less massive stellar masses build up their stellar blocks relatively faster. This effect has been already found by Zheng et al. (2007) and Buat et al. (2008) for star forming galaxies at (see also Elbaz et al. 2007), Rodighiero et al. (2010) and Gruppioni et al. (2010) for galaxies at .
Usually, the “downsizing” effect can be parameterized as , with for the extreme case of the quenching (quiescent) star formation. Together with the observed correlation between sizes - stellar masses for galaxies, the “downsizing” effect in fact has many physical implications for galaxy formation and evolution, especially closely relating to structure parameters of galaxies, such as compactness and surface densities of galaxies. More qualitatively discussions are as follows.
The observed correlation of - for galaxies can be described as . For active star formation galaxies, such as merging galaxies, at the redshift range of (Shen et al. 2003; Mosleh et al. 2011; Ichikawa et al. 2012). For quenching star formation by gas accretion such as local quiescent galaxies, mean stellar surface densities in central regions of galaxies display a small dynamic ranges, i.e., with (Shen et al. 2003, see also Chang et al. 2010).
If we simply assume that sizes of stellar and star formation distributions of a galaxy are similar (see also in Sect. 5), we obtain . In the case of LBGs dominated by star forming galaxies, with and . It implies that LBGs with larger SFRs are on average more compact for their star forming regions, which is consistent with the existence of a very weak correlation with scatters between indices/sizes in the F606W images and SFRs for LBGs in Sect. 6.2 and Elbaz et al. (2011). Furthermore, for the mean SFR surface density, i.e., the mean res-frame UV brightness, in the central regions of a galaxy, we have . For and in our case for LBGs, . It implies that mean rest-frame UV surface densities in central regions of LBGs display a small dynamic range, i.e., insensitive to their total SFRs, which is consistent with the previous studies on the surface brightness for LBGs at and star forming galaxies at (Giavalisco et al. 1996; Barden et al. 2005; Akiyama et al. 2008). So, if we simply take to be constant for LBGs, their - relation at can be directly resulted from the “downsizing” fitting with the slope . This is consistent with the slopes of for the correlations obtained in Sect. 6 between sizes in F606W and F850LP and stellar masses for LBGs, respectively (see Fig. 30).
It is interesting to compare the “downsizing” effect of our LBG sample with other previous studies on star forming galaxies at different redshifts from to , which is shown in the lower panel of Fig. 19. For simplicity, lines of least square fitting results to data are presented in the figure. From top to bottom, lines denote results of 3, 1.4, 1, 0.9, 0.7, 0.5 and 0.3 with the slopes of 0.68, 0.67, 0.68, 0.53, 0.45, 0.32 and 0.25, respectively. Data are from Zheng et al. (2007) for 0.3, 0.5, 0.7 and 0.9, from Dunne et al. (2009) for and from Magdis et al. (2010a) for , respectively.
As can be seen from the figure, the significance of the “downsizing” effect for star forming galaxies increases, i.e., slope increases, with redshift till . And it is very interesting that slope remains unchanged for . According to the analysis above, it implies that distributions of star formation for galaxies are on average less and less compact after while they show similar compactness before . Since star formation is dominated by galaxy merging at high , this also implies that galaxy mergers become rare after . Although slope decreases from 0.68 at to 0.25 at , the power index of the mean star formation activities in the central region of a galaxy . It implies that mean central rest-frame UV surface brightness of a galaxy is not sensitive to its total SFR.
3.5 Colors and stellar masses
Based on the DEEP2 (Davis et al. 2003) and the COMBO-17 surveys, Faber et al. (2007) studied in detail LFs of galaxies to . Their sample contains 39,000 galaxies in total with 15,000 beyond . They found that galaxies display clear bimodality in the plane of rest-frame color vs stellar mass, i.e., the “red” sequence and the “blue” cloud. The number and total stellar mass of blue galaxies have been substantially constant since , while the number densities of red galaxies (near ) have significantly increased. Some modes of how galaxies evolve from the “blue” cloud to the “red” sequence are suggested. Because the results of Faber et al. (2007) provide strong constraints on galaxy formation and evolution, many efforts have been done since then, together with discussions on the “green valley” between the “blue” cloud and the “red” sequence (Cattaneo et al. 2010, Cortese & Hughes 2009, Schawinski et al. 2010, Skelton, Bell & Somerville 2010, Lemaux et al. 2012).
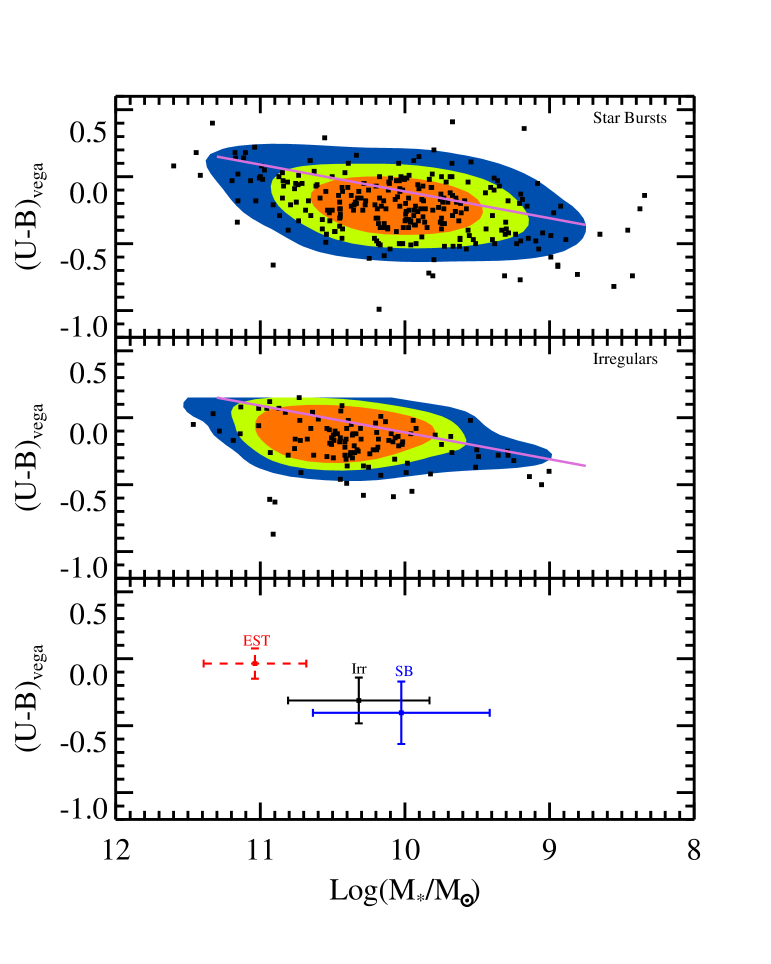
We plot in Fig. 20 the distributions and the corresponding density contours for LBGs in the SB (upper panel) and Irr (middle panel) groups, respectively, in the diagram of rest-frame color vs stellar mass . Contours from outside to inside in the figure correspond to the mean number densities of LBGs, and the over-dense contrasts of 2 and 3 times of the mean densities, respectively. The lower panel in the figure shows the mean values and the corresponding standard deviations for LBGs in the SB and Irr groups respectively. Results for LBGs in the EST groups are plotted in the lower panel as dashes just for simple illustration. For easy comparison with Faber et al. (2007), solid lines in the upper and middle panels of the figure correspond exactly the position and direction of the major axile of the “blue” cloud in Fig. 10 of Faber et al. (2007). The rest-frame color is in Vega system and the stellar mass in the x-axile decreases from left to right.
We find from the figure that LBGs in our sample locate in the “blue” cloud, in consistence with that they are star forming galaxies selected by rest-frame UV luminosities. LBGs in the SB group spread a wider range in stellar masses as also seen in Fig. 18. It is interesting that most of LBGs locate in the lower part if we divide the “blue” cloud into two parts along the major axile. It implies that LBGs on average display lower dust attenuation than star forming (blue) galaxies selected by the other methods. This is in consistence with the analysis of dust properties for star forming galaxies by Buat et al. (2005, 2012), Reddy et al. (2012), and the references therein. Although the number of LBGs in the EST group is too small to have statistical significance, there shows a clear trend that LBGs of earlier types are on average redder and more massive in stellar masses. As claimed by Conselice et al. (2003, 2011), the epoch of major mergers ends at . LBGs at , especially starburst types with low stellar masses, seem have to maintain their star formation activities for a relative long time so that they can evolve to have masses as the local galaxies at present day. We suggest that LBGs at evolve along the “blue” cloud and then arrive in the “red” sequence as red galaxies finally. Other mechanisms have been also investigated, such as the re-merging processes in particular at by Firmani et al. (2010).
3.6 Summary of the photometric properties
We list detailed photometric properties of 383 LBGs in our sample at the redshift range of in Table 5. The first to the third columns denote their corresponding IDs of individual LBGs in UV from B07, and from the COMBO 17 and MUSYC catalogs respectively. Re-estimated photometric redshifts of individual LBGs together with their corresponding error estimates in 3- are listed in Column 4. Note that are replaced by spectroscopic redshifts if available except two with bad spectroscopic observations (see Sect 2.1). SFRs and stellar masses are in Columns 5 and 6. Detections of MIPS 24m compiled by B07 are in Column 7 with number 99 indicating without detections. Goodness of SED fittings (reduced ) are in Column 8 with resulted spectral types (SpT numbers) in Column 9. Full table can be found at http://202.121.53.133/ZhuChen/. Since figures of SED fittings for individual LBGs are not easy to compile in the table, we show SEDs of those LBGs for morphological studies in Table 6 together with their images (see below).
| IDUV | IDCOMBO17 | IDMUSYC | ( | SFR () | Log () | 24m | SpT type | |
|---|---|---|---|---|---|---|---|---|
| … | … | … | … | … | … | … | … | … |
| 81517 | 63245 | 79110 | 37.1 | 11.1 | 19.74 | 7.80 | 13 | |
| 47798 | 20406 | 25420 | 124.3 | 11.4 | 99 | 3.09 | 13 | |
| 47839 | 20506 | 25134 | 18.8 | 10 | 99 | 0.51 | 13 | |
| 47853 | 20341 | 25125 | 32.2 | 9.9 | 99 | 0.76 | 13 | |
| 47897 | 20480 | – | 14.2 | 10.6 | 99 | 8.34 | 13 | |
| 49702 | 22572 | 27552 | 19.8 | 10.7 | 20.33 | 2.66 | 13 | |
| 50258 | 23164 | 28404 | 17.5 | 10.0 | 99 | 2.24 | 13 | |
| 50616 | 23587 | 29012 | (1.046) | 10.0 | 10.8 | 99 | 1.18 | 11 |
| 52269 | 25529 | 31702 | 34.6 | 10.9 | 20.40 | 2.41 | 13 | |
| … | … | … | … | … | … | … | … | … |
4 HST images for the LBG sample
4.1 Images
The Galaxy Evolution from Morphologies and SEDs (GEMS) survey (Rix et al. 2004) together with the central region from the Great Observatories Origins Deep Survey (GOODS) project (Dickinson & GOODS 2004) is centered on the CDF-S area. It is field of the present study for LBGs that is covered by the GEMS and GOODS surveys. So we can find HST optical images for LBGs with very high quality from both the GEMS and the GOODS surveys through the coordinates of their optical counterparts to study quantitatively their morphological properties. A brief introduction of the GEMS and GOODS surveys is as follows.
The GEMS is a large-area of 800 , two-color in F606W ( band) and F850LP ( band), imaging survey with the Advanced Camera for Surveys (ACS) on the HST (Rix et al. 2004). Centered on the CDF-S, it covers an area of , to a depth of and in for compact sources. In its central () field, there are 15 tiles that the GEMS incorporates ACS imagings from the GOODS project. The GOODS is a survey of approximately 300 in two fields of the HDF-N and CDF-S. It provides ACS images in four bands of F435W(B), F606W(V), F775W(i), and F850LP(z). To assure data homogeneity, the GEMS group has reduced the first epoch of GOODS-S data at the center of the overall GEMS area taking exactly the same processes as the reduction for the GEMS data, although GOODS images are a bit shallower than those of the GEMS. Details of the GEMS444http://archive.stsci.edu/prepds/gems/ and GOODS555http://www.stsci.edu/science/goods/ surveys can be found from their websites, respectively.
According to the coordinates of optical counterparts of individual LBGs through the cross-identifications in Sect 2, we find 336 LBGs in the GEMS and GOODS-S fields. The number fraction of LBGs within the fields of the GEMS and GOODS-S surveys is similar to the fraction of the sky coverage. It implies that morphological studies of these 336 LBGs can represent all LBGs of our sample. Images of F606W and F850LP from the GOODS-S and GEMS surveys can be downloaded from the GEMS website2. In the overlapped region between the GOODS-S and the GEMS which is a small fraction, images with better qualities are chosen. Note that for our LBG sample at redshift , images of F606W intense to represent star-forming regions while images of F850LP mainly reflect distributions of colder stars.


4.2 Visual classifications of morphologies
In the present subsection, an image gallery of LBGs in variety of shapes with classifications by eye is established firstly. We cut areas of individually as counter images of LBGs centered on their COMBO-17 coordinates. Since LBGs in our sample are at , images of (corresponding to at ) are large enough to study their morphologies. The widely used software SExtractor666http://www.astromatic.net/software/sextractor (Bertin & Arnouts, 1996) is performed to detect LBGs in images with the detection threshold being chosen as for F606W and F850LP respectively (see also in next section). As pointed out by Caldwell et al. (2008), the GEMS can reliably detect most of COMBO 17 galaxies with magnitudes and its detection ability decreases significantly for objects with . Since there are 59 LBGs in the GEMS and GOOD-S fields with their band magnitudes fainter than 24, images of some LBGs locating within the GEMS and GOODS surveys are missed.
Totally, there are 309 and 279 LBGs detected by SExtractor successfully in their F606W and F850LP counter images, respectively, with 277 LBGs being commonly detected in both bands. That more LBGs detected in F606W is consistent with that LBGs are bright in F606W, since they are star forming galaxies at and the depth of F606W is a bit deeper. Spatial distributions of detected/undetected LBGs in the GOOD-S and the GEMS fields are roughly the same. It implies that the slightly different observational depths between GOODS and the GEMS do not influence the following morphological studies for our LBG sample.
For easy comparison, LBGs detected in images of both bands are taken for morphological studies in the present paper. For 59 LBGs undetected or only detected in one band, they display low SFRs/stellar masses as expected. Most of them are classified as starburst type LBGs, in consistence with Fig. 18. For visual classifications of LBGs morphologies, we follow the prescriptions of Elmegreen et al. (2009). Note that two LBGs with their UV IDs of 74154 and 81517 in B07 are found to have many bad pixels in their images in both bands although they are detected by SExtractor. These two LBGs are ruled out from the following morphological studies.
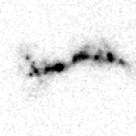
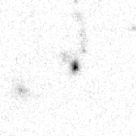
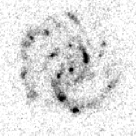
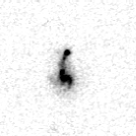
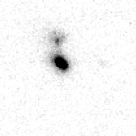
It is found by eye that 10 LBGs show anomalous morphologies, which display very chaotic shapes, chain-like structures and contain multiple bright knots. These LBGs are classified visually as “chain” LBGs in the present paper. As examples, images of three “chain” LBGs in F606W and F850LP are displayed in Fig. 21 respectively. Several bright knots of star forming regions in images for “chain” LBGs suggest that they are ongoing merging processes in a very young and active dynamical stage (Abraham et al., 1999). Their visual morphologies are consistent with their spectral types of starbursts or irregulars with relatively high star formation rates and massive stellar masses.
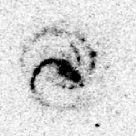
7 LBGs can be clearly seen by eye in their counter images of both bands as large spiral galaxies individually with two prominent components of disks and bright central bulges. These galaxies are classified as “spiral” LBGs with examples shown in Fig.22. It is found that all of them have high SFRs and massive stellar masses being classified in the EST group as “Sbc/Scd/E” type galaxies during their SED fittings in Sect. 2.
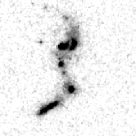
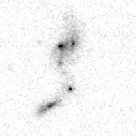
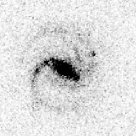
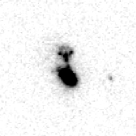
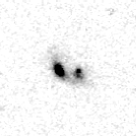
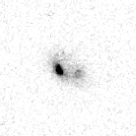
It is also easily found that 23 LBGs clearly show very close companions in their images of either F606W or F850LP band. We call these galaxies “tadpole” LBGs with three examples shown in Figs. 23. They are classified as starburst/Arp 220/irregular types, consistent with their morphological classifications by eye.
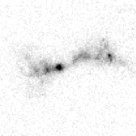
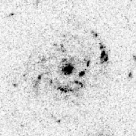
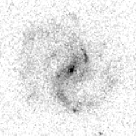
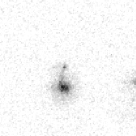
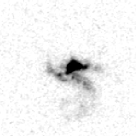
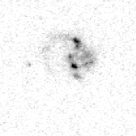
There are 132 LBGs which display very clumpy star forming regions spreading wide areas in their images. We call them “clump” LBGs with three examples shown in Fig. 24. In fact, they are marginally detected by SExtractor. All of them are classified as starburst type LBGs with relatively low SFRs and low stellar masses which are very similar to those LBGs without detections or with detections available in only one band.
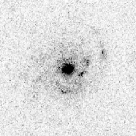
Except the above classified LBGs, the rest 103 LBGs show very regular shapes in both of their counter images which are called as “bulge” LBGs. Their examples are shown in Fig. 25. In their SED fittings, most of them are classified as starburst galaxies.
Among 277 common detected LBGs in both bands, 224 (81%) and 53 (19%) LBGs are classified as Blue- and Red-LBGs respectively. Although the fractions are similar to the whole LBG sample, Blue- and Red-LBGs display very different fractions in the visual classifications. For instance, 4 and 3 Red-LBGs are “spiral” and “chain” LBGs. 5 among 23 “tadpole” and 28 among 132 “clump” LBGs are Red-LBGs. To be concluded, Red-LBGs are always more structured visually than Blue-LBGs.
We compile the image gallery of 277 LBGs detected in both F606W and F850LP in Table 6 with their visual classifications. Quantitative studies of the morphological properties are in the next section.
5 Morphological properties of LBGs
5.1 Morphological analysis
The powerful software GALFIT with the one--component model, is adopted to analyze morphological properties of LBGs. GALFIT is a galaxy/point source fitting algorithm developed by Peng et al. (2002, 2010)777 http://users.obs.carnegiescience.edu/peng/work/galfit/galfit.html, that fits 2D parameterized axially-symmetric directly to images. We refer Peng et al. (2002, 2010) for details.
In the present paper, we focus on 277 LBGs with images detected in both F606W and F850LP (see the previous section) bands. The index and the half-light radius, the most important structure parameters of a galaxy, are obtained through performing GALFIT to its image. Simple prescriptions, instead of the details for the processes and other parameters chosen, are as follows. SExtractor (Bertin & Arnouts, 1996) is applied firstly to individual counter images of LBGs to get their initial parameters and mask files required by GALFIT, with the detection threshold being chosen as for both F606W and F850LP bands, respectively. The point spread function (PSF) adopted here is generated by the TinyTim software (Krist, 1993) which is designed to reproduce the HST modeled PSF.
Although 277 LBGs with image detected successfully by SExtractor in both F606W and F850LP can get their indices and half-light radii through GALFIT with the one--component model, results of half LBGs are not physically reliable. For instance, the 7 “spiral” LBGs classified in the previous section cannot be reliably fitted, since they display at least two components in their images. Obviously, the 10 “chain” LBGs cannot be fitted using GALFIT, since they show multiple components with different shapes. There are 87 among 132 “clump” LBGs with their residual images still having several bright knots after GALFIT performance. It implies that they display complicate structures. For another 5 among 132 “clump” LBGs, they are very faint with low surface brightness and detected marginally by SExtractor. So it is very difficult for GALFIT to get their true physical parameters subtracted from the sky background. These LBGs are also excluded in morphological studies below although their goodness of GALFIT seems acceptable. Moreover, two LBGs with their UV IDs of 74154 and 81517 in B07 must be ruled out since their images show many bad pixels in both bands. Totally, 142 LBGs, consisting of 127 Blue- and 15 Red-LBGs, have reliable results by GALFIT with their images detected in both F606W and F850LP bands.
It is important to understand if these 142 LBGs can represent morphological properties of all LBGs at without significant bias. The distributions of redshifts, spectral types, SFRs and stellar masses for these 142 LBGs with reliable GALFIT results are also plotted in Figs. 9, 10, 15 and 17 as dashed histograms, respectively, to compare with those for all LBGs. It can be seen that the distributions of these 142 LBGs are very similar to those of all LBGs. So, we take them reasonably as the morphological sample, which can represent the whole LBGs sample, to study morphological properties of LBGs below.
Details of morphological properties of 277 LBGs with images detected in both F606W and F850LP bands are summarized individually in Table 6. The table consists in two rows for each LBG. Column 1 in the first row denotes UV IDs of LBGs in B07, which is the same as the first column in Table 5. Columns 2 and 3 in the first row list indices in F606W and F850LP with their corresponding half-light radii (sizes) obtained by GALFIT in Columns 4 and 5, respectively. Columns 6 and 7 in the first row list indicator flags of GALFIT results and visual classifications of LBG images. Note: flag (0/1) denotes a reliable/unreliable result of the GALFIT fitting; type (1-5) denotes 1: tadpole; 2: chain; 3: clump; 4: bulge and 5: spiral LBGs with 6 denoting bad pixel images, respectively. In the second row, LBG images detected by SExtractor, modeled by GALFIT, and residual images with the upper and lower panels for F606W and F850LP bands are shown respectively. Figures of corresponding SED fittings are in the right-hand side of the second row. Full table can be downloaded at http://202.121.53.133/ZhuChen/.
5.2 indices and sizes
The profile is one of the most popular prescriptions to study morphologies of galaxies. The index n is often used to describe the concentration of the light profile for a galaxy. It displays a steeper inner profile and a more extended outer wing when n is larger. The effective radius describes the size of a galaxy which contains its half of the light within . Usually, galaxies with and are classified as disky types and elliptical types respectively (see Peng et al. 2002, 2010).
The distributions of indices for 142 LBGs, i.e., the morphology sample, obtained by GALFIT in the images of F606W and F850LP bands are shown in Fig. 26 as the hatched and empty histograms, respectively. It is found that about 80% of the LBGs have their indices smaller than 2 with a median values of around 1 for both bands. We conclude that most LBGs are disklike late type galaxies. It is consistent with Burgarella et al. (2006, 2008) who suggested that LBGs at are disklike after partly analyzing their counterparts from GOODS data. Haberzettl et al. (2012) found similar result that the majority of LBG sample at shows disk-like structure.
Giavalisco et al. (1996) found that star-forming galaxies (LBGs at ) in their sample are compact with sizes and scale lengths similar to the present-day bulges or intermediate-luminosity spheroids, while they are often surrounded by lower surface brightness nebulosities. However, multi-color morphologies of some of their LBGs clearly show similarly irregular. Here deeper images with higher resolution and S/N provided by the GOODS and GEMS surveys make us possible to get more reliable conclusions, especially for outskirts of LBGs which could not be detected clearly at that moment and play important roles in morphology analysis.
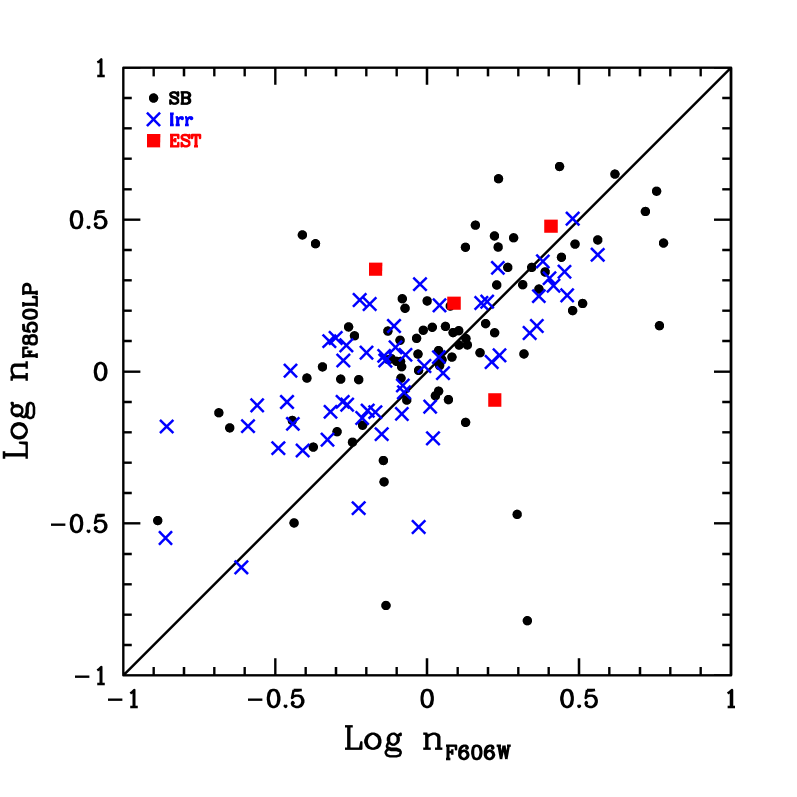
For a disk galaxy, its central concentration of stars in the space distribution always increases with age and that of star formation activity evolves in an inverse way. For interacting disk galaxies, the induced star formation activities usually occur more outskirts than their stars (Rawat, Wadadekar & De Mello 2009). Note that indices in F606W and F850LP reflect somehow central concentrations of star formation activities and stars in space distributions respectively for LBGs at . It is interesting to compare the resulted indices of 142 LBGs in F606W images with those in F850LP images, which is in Fig. 27. Same as in Fig. 18, LBGs in the SB, Irr and EST groups are labeled as different symbols for illustration.
As can be seen from the figure that LBGs in individual groups have similar distributions in the diagram. Most of the disk-like LBGs with have their indices in F850LP larger than those in F606W. It implies that their stellar distributions are more central concentrated than their star formation activities, similar to the local “old” disk galaxies or interacting disk galaxies. Furthermore, LBGs with might be very young disk galaxies according to the analysis above.
Another important physical quantity obtained by GALFIT is the effective radius (size) of an LBG, within which half of its luminosity is included. As for indices, we plot respectively the distributions of sizes in F606W and F850LP for the LBG morphology sample as the hatched and empty histograms in Fig. 28. It can be seen from the figure that the median values of sizes for LBGs are and in F606W and F850LP, respectively, larger than the median size of LBGs in UV at (Shu, Mao & Mo 2001) and similar to that of local disk galaxies (Shen et al. 2003) if the cosmic evolution is simply taken into account as . Assuming that sizes of LBGs are resulted from angular momentums of their host halos, the Gaussian-like distributions of the logarithmic sizes for two bands can be easily explained by the Gaussian distribution for the spin parameters in logarithm of halos (Cole & Lacey 1996).
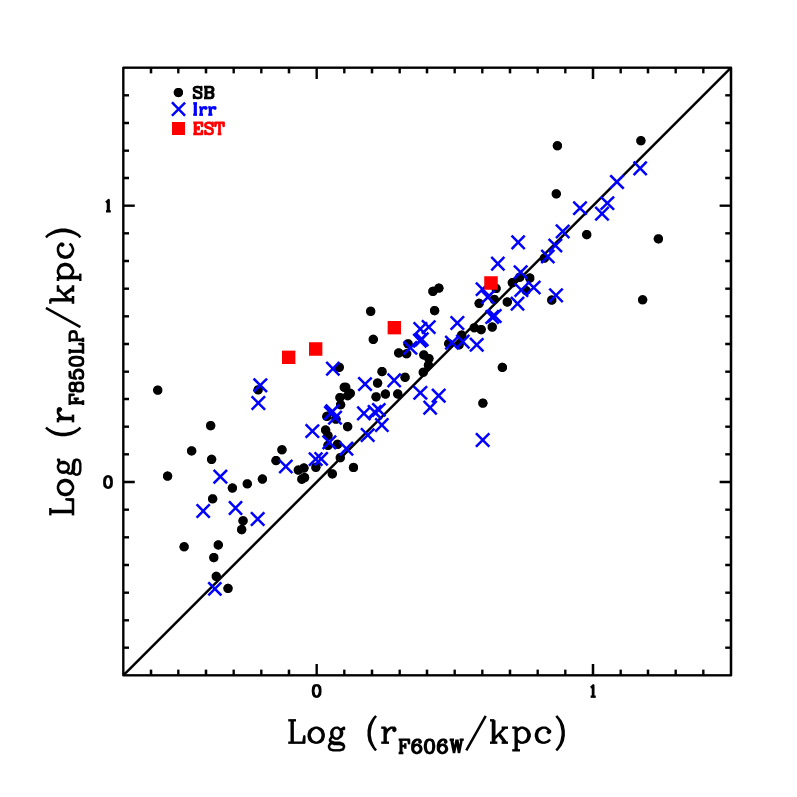
Same as Fig. 27, comparison between the sizes of LBGs obtained in F606W and F850LP is shown in Fig. 29 As can be seen from the figure that the distributions of LBGs in individual groups are similar. For LBGs with , agrees with well. For LBGs with , is often smaller than . It implies that smaller LBGs must display more compact in F606W, i.e., more compact star formation regions, so that they can have SFRs higher enough to be selected as LBGs.
6 Correlations between photometric and morphological properties
As mentioned in the previous section, 142 LBGs with reliable morphological parameters in the fields of the GOODS and GEMS can represent all LBGs at for their morphological studies. Among these 142 LBGs, 79, 59, 4 are in the SB, Irr and EST group as classified according to their spectral types during their SED fittings (see Sect. 3.1). We investigate correlations between their photometric and morphological properties in the present section. To limit the length of the pager, only figures with strong correlations are shown.
6.1 Spectral types vs indices and sizes
Since the number of LBGs in the EST group is too small to have statistical significance, we only focus the discussions on LBGs in the SB and Irr groups. The mean indices of LBGs in the SB and Irr groups are 1.30 and 1.43, 1.07 and 1.17 for the F606W and F850LP bands respectively. Moreover, the mean sizes for LBGs in the SB and Irr groups are 1.82 and 2.15, 3.09 and 3.35 for the F606W and F850LP bands respectively. It implies that LBGs in the SB group on average show more compact distributions of both star formation activities and stars than LBGs in the Irr group. This is consistent with the implications obtained from the “downsizing” effect in Sect. 3.4 and the recent study of Elbaz et al. (2011). In fact, same conclusion can be drawn from the visual classifications in Sec. 4.
6.2 SFRs vs indices and sizes
Since the number of LBGs in the morphological sample is only 142, we discuss correlations between SFRs and morphological parameters, i.e., indices and sizes, as a whole, instead of grouping LBGs into different spectral types. It is found that both indices and sizes of LBGs in the F606W band display weak correlations with scatters of increasing with SFRs. Since images of the F606W band represent distributions of star formation activities for LBGs at , this implies that more compact LBGs in F606W on average have higher SFRs. It is also in consistence with Elbaz et al. (2011) and the implication from the “downsizing” effect that LBGs with higher SFRs are on average more compact (see Sect. 3.4).
On the other hand neither indices nor sizes of LBGs in the F850LP band show any significant correlations with SFRs with large scatters. This is consistent with that images of the F850LP band represent stellar distributions of LBGs but their star formation activities.
6.3 Stellar masses vs indices and sizes
Because of large scatters, no significant correlations between indices in the F606W/F850LP bands and stellar masses for LBGs can be found. For the F606W band, this can be simply explained as its irrelevance to stellar distributions for LBGs at . Since images of the F850LP band reflect stellar distributions of LBGs, the insignificant correlation between and suggests that their stellar distributions may have similar profiles. LBGs with more massive stellar masses mainly because they have larger sizes (see below). This implies that mean stellar surface densities in central regions of LBGs are similar to have a small dynamic range as their SFR surface densities, which is consistent with implications from the “downsizing” effect in Sect. 3.4.
Finally, strong correlations between sizes / in the F606W/F850LP bands and stellar masses , i.e., the size-stellar mass relations, for LBGs are found and shown in Fig. 30, respectively. In the figure we plot the distributions of LBGs and the corresponding density contours together with the mean values and the standard deviations as error bars for different mass bins. Same as Fig. 20, contours from outside to inside correspond to the mean number densities of LBGs and the over-dense contrasts of 2 and 3 times of the mean densities, respectively.
It can be found that sizes in the both F606W and F850LP bands increase with stellar masses for LBGs significantly. Since there is no significant correlation between indices and stellar masses, LBGs with more massive stellar masses certainly have larger sizes in the F850LP band. The correlation between sizes in the F606 band and their stellar masses for LBGs can be easily obtained from their size - stellar mass relation in the F850LP band and the “downsizing’ effect in Sect. 3.4. Ignoring the contribution of the most massive bin due to few LBGs in Fig. 30, we can easily obtain the slopes of and with the same corresponding coefficients of 0.99 for the size-stellar mass relations in the F606W and F850LP bands, respectively. It is in consistence with Mosleh et al. (2011) and Ichikawa et al. (2012). Together with the least square fitting for the “downsizing” effect, it is again implies that the mean rest-frame UV surface densities, i.e., the mean SFR surface densities, of LBGs in their central regions display a small dynamic range.
7 Conclusions
Burgarella et al. (2007) defined a preliminary sample of 420 LBG candidates, with the completeness down to , at by from the deep GALEX observation in the field of the CDF-S according to their photometric redshifts from COMBO-17. Four confirmed AGNs are included. Although the global accuracies of photometric redshifts in the both COMBO 17 and MUSYC catalogs are pretty high, differences of photometric redshifts for LBG candidates between these two catalogs are significant. Together with the MUSYC BVR selected catalog, we re-estimate their photometric redshifts using broader multi-wavelength data from UV, optical to NIR by the code Hyperz. Comparisons between re-estimated photometric redshifts and spectroscopic redshifts if available show that our photometric redshift determinations are fairly good. After carefully cross-identifying LBG candidates one-to-one with their optical counterparts and considering their re-estimated photometric redshifts and SEDs, we refine a new updated sample of 383 LBGs at , with two AGNs in this redshift range being excluded. This means that the AGN contamination is about 0.5% which is smaller than that of for LBGs at (Steidel et al. 2003; Lehmer et al. 2008).
According to SED fittings, 260 and 111 LBGs are classified as starburst galaxies and irregulars with 11 being classified as Sbc/Scd types and only one as an elliptical. To be easily compared by future studies, the averaged SEDs of LBGs are presented for SB/Irr types and Blue-/Red-LBGs, respectively. The ages of LBGs spread from several Myr to 1.5Gyr with a median value of Myr, comparable to Haberzettl et al. (2012) for LBGs at and Papovich et al. (2001) for LBGs at . The median dust attenuations in the rest-frame FUV for Blue- and Red-LBGs are 1.7 and 2.5 magnitudes, respectively, in good agreement with the previous study by B07. Based on the method and considering uncertainties of individual luminosity bins due to uncertainties of photometric redshifts, we obtain the rest-frame FUV luminosity function (LF) of LBGs with the completion down to . By adopting the Levenberg-Marquardt method with the consideration of the two dimensional error bars, a Schechter parametrization is applied to the LF and we get the best-fit parameters of , and , respectively. According to Arnouts et al. (2005), it implies that more than half of the NUV selected galaxies at are selected as LBGs. Simple comparisons with previous studies on FUV LFs at different redshifts and brief discussions are presented.
Dust-corrected star formation rates (SFRs) of LBGs are from to , with a median value of which is similar to that for LBGs at (Shapley et al. 2001; Steidel et al. 2003) and a bit smaller than those for LBGs at (Haberzettl et al. 2012) and (Verma et al. 2007). Stellar masses of individual LBGs are obtained according to their rest-frame -band luminosities and the calculated mass-to-light ratios in band through their SED fittings. Results are similar to those if simply taking a constant mass-to-light ratio in band of . Stellar masses of LBGs distribute from to , with a median value of which is comparable to those of LBGs at (Haberzettl et al. 2012) and (Shapley et al. 2001; Papovich et al. 2001) and about 10 times bigger than that of LBGs at (Verma et al. 2007). As expected, the mean SFR of LBGs in the SB group is larger than that of LBGs in the Irr group. The mean stellar mass of Red-LBGs is larger than that of Blue-LBGs.
It is found that LBGs in the Irr and EST groups distribute in the SFR- diagram along the “main sequence” of star forming galaxies suggested by Elbaz et al. (2011) with the considerations of uncertainties and the redshift range. Most of LBGs in the SB group locate in the starburst region, away from the “main sequence”. Distances to the “main sequence”, i.e., the inverse way of star forming timescales, increase from earlier to later spectral types for LBGs on average. Since median of LBGs increases very rapid from to and then varies slowly to together with that median SFRs are similar for LBGs at different redshifts, it suggests that the star formation mode for LBGs at is mainly starburst with the significance increasing with , and it evolves to be more significant to the quenching mode after . This is in consistence with that the epoch of major mergers ends at (Conselice et al. 2003, 2011). We predict that fraction of starburst galaxies increases with redshift for LBGs at .
Taking the observational limit of into account, the “downsizing” effect is clearly found for LBGs at and the significance of the effect decreases for LBGs from the SB, Irr to EST groups. Detailed discussions on the implications of the “downsizing” effect for galaxy formation and evolution, especially for the structure parameters such as compactness and surface densities of galaxies, are presented. Taking the observed size-stellar mass relation into account, we suggest that LBGs with larger SFRs are on average more compact. Mean rest-frame UV surface densities in central regions of LBGs are suggested to be insensitive to their SFRs, in consistence with Giavalisco et al. (1996), Barden et al. (2005) and Akiyama et al. (2008). The size-stellar mass relation can be directly resulted from the “downsizing” effect. Comparisons with previous studies on the “downsizing” effect at different redshifts are presented. It is found that the “downsizing” effect is more significant with the increasing of till .
In the rest-frame color - diagram, LBGs at distribute in the blue cloud. It is interesting that most of LBGs locate in the lower part of the blue cloud. It suggests that LBGs display lower dust attenuation on average than star forming galaxies selected by the other methods. This is consistent with Buat et al. (2005, 2012), Reddy & Steidel (2009) and the references therein. Considering LBGs of starburst types with low stellar masses, we suggest that LBGs may evolve along the blue cloud and finally arrive in the red sequence.
Since the GEMS and GOODS-S surveys by HST covers of the field of our LBG sample, high quality images in F606W (V band) and F850LP (z band) are downloaded from The Multimission Archive at STScI for morphological studies of LBGs. The number fraction of LBGs within the field of the GEMS and GOODS-S surveys is similar to the fraction of the sky coverage. The counter images of LBGs are analyzed using SExtractor. There are 309 and 279 LBGs successfully detected in the images of F606W and F850LP respectively, with 277 being commonly detected in both bands. We establish an image gallery of these 277 LBGs by visually classifying their images individually as types of “chain”, “spiral”, “tadpole”, “bulge” and “clump”, respectively. It is concluded that Red-LBGs are more structured than Blue-LBGs.
The powerful software GALFIT of the one-component model is applied to LBG images availably detected in both F606W and F850LP bands. A morphological sample of 142 LBGs with reliable GALFIT results is established to represent all LBGs. We find more than LBGs in the morphological sample with their indices smaller than 2 in both bands. It is concluded that LBGs at are dominated by disklike galaxies, consistent with Burgarella et al. (2006, 2008). Similar result is obtained by Haberzettl et al. (2012) for LBGs at . The distributions of half-light radii (sizes) in F606W and F850LP are similar, with their median values of and respectively. If the cosmic evolution factor is simply taken as , the median sizes of LBGs are comparable to the local disk galaxies.
Correlations between photometric and morphological properties of LBGs are investigated. Note that LBGs display strong correlations between their half-light radii and , i.e., the size-stellar mass relation, in both bands. Similar slopes of in two bands, in consistence with Mosleh et al. (2011) and Ichikawa et al. (2012), are obtained with their linear fitting coefficients all to be 0.99. For indices, a weak correlations between and SFRs suggests that more compact LBGs have higher SFRs. Insignificant correlation between and implies that stellar distributions of LBGs may have similar profiles. It should be pointed out that correlations between photometric and morphological properties for LBGs can be explained through the implications of the “downsizing” effect.
Acknowledgments
We would like to thank thorough reviewing and valuable comments from the anonymous referee. ZC is very grateful to the financial support by DB and the LAM for the visit to LAM and is also grateful to DB and VB for hospitalities during the stay in Marseille. This work is partly supported by the Chinese National Nature Science foundation Nos. 10878003, 10833005 & 10778725, Shanghai Science Foundations and Leading Academic Discipline Project of Shanghai Normal University (DZL805). Some/all of the data presented in this paper were obtained from the Multimission Archive at the Space Telescope Science Institute (MAST). STScI is operated by the Association of Universities for Research in Astronomy, Inc., under NASA contract NAS5-26555. Support for MAST for non-HST data is provided by the NASA Office of Space Science via grant NNX09AF08G and by other grants and contracts.
| continue | |||||||||
| flag | type | ||||||||
| 47839 | 99 | 99 | 99 | 99 | 1 | 3 | |||
![[Uncaptioned image]](/html/1302.3938/assets/x56.png) |
![[Uncaptioned image]](/html/1302.3938/assets/x57.png) |
![[Uncaptioned image]](/html/1302.3938/assets/x58.png) |
![[Uncaptioned image]](/html/1302.3938/assets/x59.png) |
||||||
![[Uncaptioned image]](/html/1302.3938/assets/x60.png) |
![[Uncaptioned image]](/html/1302.3938/assets/x61.png) |
![[Uncaptioned image]](/html/1302.3938/assets/x62.png) |
|||||||
| flag | type | ||||||||
| 47897 | 5.69 | 3.92 | 7.10 | 4.56 | 0 | 4 | |||
![[Uncaptioned image]](/html/1302.3938/assets/x63.png) |
![[Uncaptioned image]](/html/1302.3938/assets/x64.png) |
![[Uncaptioned image]](/html/1302.3938/assets/x65.png) |
![[Uncaptioned image]](/html/1302.3938/assets/x66.png) |
||||||
![[Uncaptioned image]](/html/1302.3938/assets/x67.png) |
![[Uncaptioned image]](/html/1302.3938/assets/x68.png) |
![[Uncaptioned image]](/html/1302.3938/assets/x69.png) |
|||||||
| flag | type | ||||||||
| 49702 | 99 | 99 | 99 | 99 | 1 | 3 | |||
![[Uncaptioned image]](/html/1302.3938/assets/x70.png) |
![[Uncaptioned image]](/html/1302.3938/assets/x71.png) |
![[Uncaptioned image]](/html/1302.3938/assets/x72.png) |
![[Uncaptioned image]](/html/1302.3938/assets/x73.png) |
||||||
![[Uncaptioned image]](/html/1302.3938/assets/x74.png) |
![[Uncaptioned image]](/html/1302.3938/assets/x75.png) |
![[Uncaptioned image]](/html/1302.3938/assets/x76.png) |
|||||||
| continued on next page | |||||||||
| continue | |||||||||
| flag | type | ||||||||
| 50258 | 0.55 | 1.40 | 4.70 | 2.60 | 0 | 3 | |||
![[Uncaptioned image]](/html/1302.3938/assets/x77.png) |
![[Uncaptioned image]](/html/1302.3938/assets/x78.png) |
![[Uncaptioned image]](/html/1302.3938/assets/x79.png) |
![[Uncaptioned image]](/html/1302.3938/assets/x80.png) |
||||||
![[Uncaptioned image]](/html/1302.3938/assets/x81.png) |
![[Uncaptioned image]](/html/1302.3938/assets/x82.png) |
![[Uncaptioned image]](/html/1302.3938/assets/x83.png) |
|||||||
| flag | type | ||||||||
| 50616 | 99 | 99 | 99 | 99 | 1 | 3 | |||
![[Uncaptioned image]](/html/1302.3938/assets/x84.png) |
![[Uncaptioned image]](/html/1302.3938/assets/x85.png) |
![[Uncaptioned image]](/html/1302.3938/assets/x86.png) |
![[Uncaptioned image]](/html/1302.3938/assets/x87.png) |
||||||
![[Uncaptioned image]](/html/1302.3938/assets/x88.png) |
![[Uncaptioned image]](/html/1302.3938/assets/x89.png) |
![[Uncaptioned image]](/html/1302.3938/assets/x90.png) |
|||||||
| flag | type | ||||||||
| 52269 | 99 | 99 | 99 | 99 | 1 | 3 | |||
![[Uncaptioned image]](/html/1302.3938/assets/x91.png) |
![[Uncaptioned image]](/html/1302.3938/assets/x92.png) |
![[Uncaptioned image]](/html/1302.3938/assets/x93.png) |
![[Uncaptioned image]](/html/1302.3938/assets/x94.png) |
||||||
![[Uncaptioned image]](/html/1302.3938/assets/x95.png) |
![[Uncaptioned image]](/html/1302.3938/assets/x96.png) |
![[Uncaptioned image]](/html/1302.3938/assets/x97.png) |
|||||||
| continued on next page | |||||||||
References
- Abazajian et al. (2009) Abazajian K. N., Adelman-McCarthy J. K., Ageros M. A., et al., 2009, ApJS, 182, 543
- Abraham et al. (1999) Abraham R. G., Ellis R. S., Fabian A. C., Tanvir N. R., Glazebrook K., 1999, MNRAS, 303, 641
- Adelberger et al. (1998) Adelberger K. L., Steidel C. C., Giavalisco M., et al., 1998, ApJ, 505, 18
- Adelberger et al. (2005) Adelberger K. L., Steidel C. C., Pettini M., et al., 2005, ApJ, 619, 697
- Akiyama et al. (2008) Akiyama M., Minowa Y., Kobayashi N., Ohta K., Ando M., Iwata I., 2008, ApJS, 175, 1
- Arnouts et al. (2005) Arnouts S., Schiminovich D., Ilbert O., Tresse L., Milliard B., Treyer M., Bardelli S., et al, 205 ApJ, 619, L43
- Barden et al. (2005) Barden M., Rix H.-W., Somerville R. S. et al, 2005, ApJ, 635, 959
- Basu-Zych et al. (2011) Basu-Zych A., Lehmer B., Hornschemeier A., Bouwens R., Brandt N., Oesch P., 2011, ApJ, 739, 98
- Bell & De Jong (2001) Bell E. F., de Jong R. S., 2001, ApJ, 550, 212
- Bell et al. (2004) Bell E. F., Wolf C., Meisenheimer K., Rix H.-W., Borch A., Dye S., Kleinheinrich M., et al, 2004, ApJ, 608, 752
- Bell et al. (2006) Bell E. F., Phleps S., Somerville R. S., et al, 2006, ApJ, 652, 270
- Bell et al. (2010) Bell E. F., Xue X. X., Rix H.-W., Ruhland C., Hogg D. W., 2010, AJ, 140, 1850
- Bertin & Arnouts (1996) Bertin E., Arnouts S., 1996, A&AS, 117, 393
- Blain (1999) Blain A. W., 1999, MNRAS, 309, 955
- Blanton (2006) Blanton M. R., 2006, ApJ, 648, 268
- Blanton et al. (2005) Blanton M. R., Eisenstein D., Hogg D. W., Schlegel D. J., Brinkmann J., 2005, ApJ, 629, 143
- Blanton et al. (2003) Blanton M. R., Hogg D. W., Bahcall N. A., et al, 2003, ApJ, 592, 819
- Boissier (2010) Boissier S., Buat V., Ilbert O., 2010, A&A, 522, 18
- Bolzonella et al. (2000) Bolzonella, M., Miralles, J.-M., Pell, R., 2000, A&A, 363, 476
- Bongiovanni et al. (2010) Bongiovanni A., Oteo I., Cepa J., et al 2010, A&A, 519, L4
- Borch et al. (2006) Borch A., Meisenheimer K., Bell E. F., et al, 2006, A&A, 453, 869
- Bouwens et al. (2007) Bouwens R. J., Illingworth G. D., Franx M., Ford H., 2007, ApJ, 670, 928
- Bouwens et al. (2008) Bouwens R. J., Illingworth G. D., Franx M., Ford H., 2008, ApJ, 686, 230
- Bruzual & Charlot (2003) Bruzual G. & Charlot S., 2003, MNRAS, 344, 1000
- Buat et al. (2005) Buat V., Iglesias-Pramo J., Seibert M., Burgarella D., Charlot S., Martin D. C., Xu C. K., et al, 2005, ApJ, 619, L51
- Buat et al. (2012) Buat V., Noll S., Burgarella D., Giovannoli E., Charmandaris V., Pannella M., Hwang H. S., et al, 2012, A&A, 545, 141
- Buat et al. (2008) Buat V., Boissier S., Burgarella D., et al., 2008, A&A, 483, 107
- Burgarella et al. (2001) Burgarella D., Buat V., Donas J., Milliard B., Chapelon S., 2001, A&A, 369, 421
- Burgarella et al. (2006) Burgarella D., Prez-Gonzlez P. G., Tyler K. D., Rieke G. H., Buat V., Takeuchi T. T., Lauger S., et al, 2006, A&A, 450, 69
- Burgarella et al. (2007) Burgarella D., Le Floc’h E., Takeuchi T. T., Huang J. S., Buat V., Rieke G. H., Tyler K. D., et al., 2007, MNRAS, 380, 986 (B07)
- Burgarella et al. (2008) Burgarella D., Prez-Gonzlez P. G., Tyler, K. D., et al , 2008, ASPC, 381, 203
- Burgarella et al. (2011) Burgarella D., Heinis S., Magdis G., Auld R., Blain A., Bock J., Brisbin D., et al., 2011, ApJ, in press
- Caldwell et al. (2008) Caldwell J. A. R., McIntosh D. H., Rix H.-W., Barden M., Beckwith S. V. W., Bell E. F., Borch A., et al, 2008, ApJS, 174, 136
- Calzetti et al. (2000) Calzetti D., Armus L., Bohlin R. C., et al., 2000, ApJ, 533, 682
- Cardamone et al. (2010) Cardamone C. N., van Dokkum P. G., Urry C. M., Taniguchi Y., Gawiser E., Brammer G., Taylor E., et al., 2010, ApJS, 189, 270
- Cattaneo et al. (2010) Cattaneo A., Dekel A., Faber S. M., Guiderdoni B., 2008, MNRAS, 389, 567
- Chang et al. (2006) Chang R. X., Shen S. Y., Hou J. L., Shu C. G., Shao Z. Y., 2006, MNRAS, 372, 199
- Chang et al. (2010) Chang R. X., Hou J. L., Shen S. Y., Shu C. G., 2010, ApJ, 722, 380
- Cole & Lacey (1996) Cole S. & Lacey C., 1996, MNRAS, 281, 716
- Cole et al. (2000) Cole S., Lacey C.G., Baugh C. M., Frenk C. S., 2000, MNRAS, 319, 168
- Coleman, Wu & Weedman (1980) Coleman G. D., Wu C. C. & Weedman D. W., 1980, ApJS, 43, 393 (CWW)
- Colless et al. (2001) Colless M., Dalton G., Maddox S., et al., 2001, MNRAS, 328, 1093
- Conselice et al. (2003) Conselice C. J., Bershady M. A., Dickinson M., Papovich C., 2003, AJ, 126, 1183
- Conselice et al. (2011) Conselice C. J., Bluck A. F. L., Buitrago F., et al, 2011, MNRAS, 413, 80
- Conroy et al. (2007) Conroy C., Prada F., Newman J. A., et al, 2007, ApJ, 654, 153
- Cooper et al. (2011) Cooper M. C. Aird J. A., Coil A. L., et al, 2011, astro-ph/1101.4018
- Coppa et al. (2010) Coppa G., Mignoli M., Zamorani G., et al, 2010, preprint(astro-ph/1009.0723)
- Cortese & Hughes (2009) Cortese L. & Hughes T. M., 2009, MNRAS, 400, 1225
- Croft et al. (2009) Croft R. A. C., Di Matteo T., Springel V., Hernquist, Lars, 2009, MNRAS, 400, 43
- Cucciati et al. (2010) Cucciati O., Iovino A., Kova K., et al, 2010, A&A, 524, 2
- Daddi et al. (2004) Daddi E., Cimatti A., Renzini A., et al., 2004, ApJ, 617, 746
- Damen et al. (2011) Damen M., Labb I., van Dokkum P. G., Franx M., Taylor E. N., Brandt W. N., Dickinson, M., et al, 2011, ApJ, 727, 1
- Davis et al. (2003) Davis M., Faber S. M., Newman J., Phillips A. C.; Ellis R. S., Steidel C. C., Conselice C., et al, 2003, Proc. SPIE., 4834, 161
- de la Fuente Marcos & de la Fuente Marcos (2009) de la Fuente Marcos R. & de la Fuente Marcos C., 2009, ApJ, 700, 436
- Delgado-Serrano et al. (2010) Delgado-Serrano R., Hammer F., Yang Y. B., Puech M., Flores H., Rodrigues M., 2010, A&A, 509, 78
- Dickinson & GOODS (2004) Dickinson M., GOODS, 2004, AAS, 36, 1614
- Douglas et al. (2009) Douglas L. S., Bremer M. N., Stanway E. R., et al., 2009, MNRAS, 400, 561
- Drory et al. (2004) Drory N., Bender R., Feulner G., Hopp U., Maraston C., Snigula J., Hill G. J., 2004, ApJ, 608, 742
- Dunne et al. (2009) Dunne L., Ivison R. J., Maddox S., Cirasuolo M., Mortier A. M., Foucaud S., Ibar E., Almaini O., Simpson C., McLure R., 2009, MNRAS, 394, 3
- Efstathiou (2000) Efstathiou G., 2000, MNRAS, 317, 697
- Elbaz et al. (2007) Elbaz D., Daddi E., Le Borgne D., et al, 2007, A&A, 468, 33
- Elbaz et al. (2011) Elbaz D., Dickinson M., Hwang H. S., Daz-Santos T., Magdis G., Magnelli B., Le Borgne D., et al, 2011, A&A, 533, 119
- Elmegreen et al. (2009) Elmegreen B. G., Elmegreen D. M., Fernandez M. X., Lemonias, J. J., 2009, ApJ, 692, 12
- Faber et al. (2007) Faber S. M., Willmer C. N. A., Wolf C., et al., 2007, ApJ, 665, 265
- Firmani et al. (2010) Firmani C., Avila-Reese V., Rodrguez-Puebla A., 2010, MNRAS, 404, 1100
- Franx et al. (2003) Franx M., Labb I., Rudnick G., et al. 2003, ApJ, 587, L79
- Gawiser et al. (2006) Gawiser R., van Dokkum P.G., Herrera D., et al., 2006, ApJS, 162, 1
- Gehrels et al. (2004) Gehrels N., Chincarini G., Giommi P., Mason K. O., Nousek J. A., Wells A. A., White N. E., et al., 2004, ApJ, 611, 1005
- Genzel et al. (2011) Genzel R., Newman S., Jones T., et al 2011, ApJ, 733, 101
- Genzel et al. (2010) Genzel R., Tacconi L. J., Gracia-Carpio J., et al. 2010, MNRAS, 407, 2091
- Genzel et al. (2008) Genzel R., Burkert A., Bouch N., et al, 2008, ApJ, 687, 59
- Genzel et al. (2006) Genzel R., Tacconi L. J., Eisenhauer F., et al, 2006, Nature, 442, 786
- Gerke et al. (2007) Gerke B. F., Newman J. A., Faber S. M., et al, 2007, MNRAS, 376, 1425
- Giavalisco et al. (1996) Giavalisco M., Steidel C. C., 1996, ApJ, 470, 189
- Giavalisco (2002) Giavalisco M., 2002, ARA&A, 40. 579
- Gruppioni et al. (2010) Gruppioni C., Pozzi F., Andreani P., Rodighiero G., Cimatti A., Altieri B., Aussel H., et al, 2010, A&A, 518, L27
- Governato et al. (2007) Governato F., Willman B., Mayer L., Brooks A., Stinson G., Valenzuela O., Wadsley J., Quinn T., 2007, MNRAS, 374, 1479
- Haberzettl et al. (2009) Haberzettl L., Williger G. M., Lauroesch J. T., et al., 2009, ApJ, 702, 506
- Haberzettl et al. (2012) Haberzettl L., Williger G., Lehnert M. D., Nesvadba N., Davies L., 2012, ApJ, 745, 96
- Heckman et al. (2005) Heckman T. M., Hoopes C.G., Seibert M., et al., 2005, ApJ, 619, L35
- Hildebrandt et al. (2006) Hildebrandt H., Erben T., Dietrich J. P., et al., 2006, A&A, 452,1121
- Hoopes et al. (2007) Hoopes C. G., Heckman T. M., Salim S., et al., 2007, ApJS, 173, 441
- Huang et al. (2009) Huang J.-S., Faber S. M., Daddi E., et al, 2009, ApJ, 700, 183
- Ichikawa et al. (2012) Ichikawa T., Kajisawa M., Akhlaghi M., 2012, MNRAS, 422, 1014
- Jahnke et al. (2009) Jahnke K., Bongiorno A., Brusa M., et al, 2009, ApJ, 706, L215
- Kauffmann et al. (2008) Kauffmann G., Heckman T. M., Best P. N., 2008, MNRAS, 384, 953
- Kauffmann et al. (2003a) Kauffmann G., Heckman T. M., White, S. D. M., et al, 2003a, MNRAS, 341, 54
- Kauffmann et al. (2003b) Kauffmann G., Heckman T. M., White, S. D. M., et al, 2003b, MNRAS, 341, 33
- Kauffmann & Charlot (1998) Kauffmann G., Charlot S., 1998, MNRAS, 297, L23
- Kennicutt (1998) Kennicutt R., 1998, ARA&A, 36, 189
- Kova et al. (2010) Kova K., Lilly S. J., Knobel C., et al, 2010, ApJ, 718, 86
- Krist (1993) Krist J., 1993, ASPC, 52, 536
- Lehmer et al. (2008) Lehmer B. D., Brandt W. N., Alexander D. M., Bell E. F., Hornschemeier A. E., McIntosh D. H., Bauer F. E., et al, 2008, ApJ, 681, 1163
- Lemaux et al. (2012) Lemaux B. C., Gal R. R., Lubin L. M., Kocevski D. D., Fassnacht C. D., McGrath E. J., Squires G. K., et al, 2012, ApJ, 745, L106
- Li & White (2009) Li C., & White S. D. M., 2009, MNRAS, 398, 2177
- Li et al. (2008) Li C., Kauffmann G., Heckman T. M., Jing Y. P., White S. D. M., 2008, MNRAS, 385, 1903
- Longair (2006) Longair M. S., 2006, The Cosmic Century: A History of Astrophysics and Cosmology, Cambridge University Press, Cambridge
- Luo et al. (2010) Luo B., Brandt W. N., Xue Y. Q., Brusa M., Alexander D. M., Bauer F. E., Comastri A., et al, 2010, ApJS, 187, 560
- Luo et al. (2008) Luo B., Bauer F. E., Brandt W. N., Alexander D. M., Lehmer B. D., Schneider D. P., Brusa M., et al, 2008, ApJS, 179, 19
- Madau et al. (1998) Madau P., Pozzetti L., Dickinson M., 1998, ApJ, 498, 106
- Magdis et al. (2010a) Magdis G. E., Rigopoulou D., Huang J.-S., Fazio G., 2010a, MNRAS, 401, 1521
- Magdis et al. (2010b) Magdis G. E., Elbaz D., Hwang H. S., et al, 2010b, MNRAS, 409, 22
- Madgwick et al. (2003) Madgwick D. S., Coil A. L., Conselice C. J., et al, 2003, ApJ, 599, 997
- Maier et al. (2009) Maier C., Lilly S. J., Zamorani G., et al, 2009, ApJ, 694, 1099
- Martin et al. (2005) Martin D. C., Fanson J., Schiminovich D., et al., 2005, ApJ, 619, L1
- Mo et al. (1998) Mo H. J., Mao Shude, White Simon D. M, 1998 MNRAS, 295, 319
- Mosleh et al. (2011) Mosleh M. Williams R. J., Franx M., Kriek, M., 2011, ApJ, 727, 5
- Moy et al. (2003) Moy E., Barmby P., Rigopoulou D., Huang J.-S., Willner S. P., Fazio G. G., 2003, A&A, 403,493
- Nilsson et al. (2011a) Nilsson K. K., Mller-Nilsson O., Rosati P., Lombardi M., Kmmel M., Kuntschner H., Walsh J. R., Fosbury R. A. E., 2011a, A&A, 526, 10
- Nilsson et al. (2011b) Nilsson K. K., stlin G., Mller P., Mller-Nilsson O., Tapken C., Freudling W., Fynbo J. P. U. 2011b, A&A, 529, 9
- Noeske et al. (2007) Noeske K. G., Faber S. M., Weiner B. J., et al., 2007, ApJ, 660, L43
- Nordon et al. (2010) Nordon R., Lutz D., Shao L., Magnelli B., Berta S., Altieri B., Andreani P., et al., 2010, A&A, 518, L24
- Oesch et al. (2010) Oesch P. A., Bouwens R. J., Carollo C. M., Illingworth G. D., Magee D., Trenti M., Stiavelli M., et al, 2010, ApJ, 725, L150
- Oke & Gunn (1983) Oke J. B. & Gunn J. E., 1983, ApJ, 266, 713
- Oteo et al. (2012) Oteo I., Bongiovanni A., Prez Garca A. M., Cepa J., Ederoclite A., Snchez-Portal M., Pintos-Castro I., et al, 2012, A&A, 541, 65
- Ouchi et al. (2004) Ouchi M., Shimasaku K., Okamura S., et al. 2004, ApJ, 611, 660
- Papovich et al. (2001) Papovich C., Dickinson M., & Ferguson H. C., 2001, ApJ, 559, 620
- Peng et al. (2002) Peng C. Y., Ho L. C., Impey C. D. & Rix Hans-Walter, 2002, AJ, 124, 266
- Peng et al. (2010) Peng C. Y., Ho L. C., Impey C. D. & Rix Hans-Walter, 2010, AJ, 139, 2097
- Pettini et al. (2000) Pettini M., Steidel C. C., Adelberger K. L., Dickinson M. Giavalisco, M., et al., 2000, ApJ, 528, 96
- Pilbratt et al. (2010) Pilbratt G. L., Riedinger J. R., Passvogel T., Crone G., Doyle D., Gageur U., Heras A. M., et al, 2010, A&A, 518, L1
- Poglitsch et al. (2010) Poglitsch A., Waelkens C., Geis N., Feuchtgruber H., Vandenbussche B., Rodriguez L., Krause O., et al, 2010, A&A, 518, L2
- Rawat, Wadadekar & De Mello (2009) Rawat A., Wadadekar Y., De Mello D., 2009, ApJ, 695, 1315
- Reddy & Steidel (2009) Reddy N. A., & Steidel C. C., 2009, ApJ, 692, 778
- Reddy et al. (2012) Reddy N., Dickinson M., Elbaz D., Morrison G., Giavalisco M., Ivison R., Papovich C., et al, 2012, ApJ, 744, 154
- Rix et al. (2004) Rix H.-W., Barden M., Beckwith S. V. W., et al., 2004, ApJS, 152, 163
- Rodighiero et al. (2010) Rodighiero G., Cimatti A., Gruppioni C., Popesso P., Andreani P., Altieri B., Aussel H., et al, 2010, A&A, 518, L25
- Salim et al. (2007) Salim Samir, Rich R. M., Charlot S., et al., 2007, ApJS, 173, 267
- Salim et al. (2009) Salim S., Dickinson M., Michael R. R., et al, 2009, ApJ, 700, 161
- Salpeter (1955) Salpter E. E., 1955, ApJ, 121, 161
- Sargent et al. (2012) Sargent M. T., Bthermin M., Daddi E., Elbaz D., 2012, ApJ,747, L31
- Scarpa et al. (2007) Scarpa R., Falomo R., Lerner E., 2007, ApJ, 668, 74
- Scannapieco et al. (2009) Scannapieco C., White S. D. M., Springel V., Tissera P. B., 2009, MNRAS, 396, 696
- Schawinski et al. (2010) Schawinski K., Dowlin N., Thomas D., Urry C. M., Edmondson E., 2010, ApJ, 714, 108
- Schmidt (2009) Schmidt M., 1968, ApJ, 151, 393
- Scoville et al. (2007) Scoville N., Aussel H., Brusa M., et al., 2007a, ApJS, 172, 1
- Shao et al. (2007) Shao Z., Xiao Q., Shen S., et al., 2007, ApJ, 659, 1159
- Shapley et al. (2001) Shapley A. E., Steidel C. C., Adelberger K. L., Dickinson M., Giavalisco M., Pettini M., 2001, ApJ, 562, 95
- Shen et al. (2003) Shen S. Y., Mo H. J., White S. D. M. et al 2003, MNRAS, 343, 978
- Shu, Mao & Mo (2001) Shu C. G., Mao S., Mo H. J., 2001, MNRAS, 327, 895
- Silk & Mamon (2012) Silk J. & Mamon G. A., 2012, RAA, 12, 917
- Silverman et al. (2010) Silverman J. D., Mainieri V., Salvato M., Hasinger G., Bergeron J., Capak P., Szokoly G., et al. 2010, ApJS, 191, 124
- Skelton, Bell & Somerville (2010) Skelton R. E., Bell E. F., Somerville R. S., 2012, ApJ, 753, 44
- Smail et al. (2004) Smail I., Chapman S. C., Blain A. W., Ivison R. J., 2004, ApJ, 616, 71
- Somerville et al. (2001) Somerville R.S., Primack J.R., Faber S. M., 2001, MNRAS, 320, 504
- Steidel & Hamilton (1993) Steidel C. C., Hamilton D., 1993, AJ, 105, 2017
- Steidel et al. (1995) Steidel C. C., Pettini M., Hamilton D., 1995, AJ, 110. 2519
- Steidel et al. (1996) Steidel C. C., Giavalisco M., Pettini M., Dickinson M., Adelberger K. L., 1996, ApJ, 462, L17
- Steidel et al. (2003) Steidel C. C., Adelberger K. L., Shapley A. E., et al., 2003, ApJ, 592, 728
- Steidel et al. (2004) Steidel C. C., Shapley A. E., Pettini M. et al., 2004, ApJ, 604, 534
- Steinmetz & Navarro (2002) Steinmetz M, Navarro J. F., 2002, New Astronomy, 7, 155
- Taylor et al. (2009) Taylor E. N., Franx M., van Dokkum P. G., et al., 2009, ApJS, 183,295
- Tempel et al. (2011) Tempel E., Tuvikene T., Tamm A., & Tenjes P., 2011, A&A, 526, 155
- Teplitz et al. (2000) Teplitz H. I., Malkan M. A., Steidel C. C., et al., 2000, ApJ, 542, 18
- Tremonti et al. (2004) Tremonti C. A., Heckman T. M., Kauffmann G., et al, 2004, ApJ, 613, 898
- van Dokkum & Conroy (2010) van Dokkum P. G. & Conroy C., 2010, Nature, 468, 940
- van den Bergh et al. (2000) van den Bergh S., Cohen J. G., Hogg D. W., Blandford R., 2000, AJ, 120, 2190
- Verma et al. (2007) Verma A., Lehnert M. D., Frster S., Natascha M., Bremer M. N., Douglas, L., 2007, MNRAS, 377, 1024
- Wilkins et al. (2010) Wilkins S. M., Bunker A. J., Ellis R. S., et al. 2010, MNRAS, 403, 938
- White & Frenk (1991) White S. D. M., Frenk C. S., 1991, ApJ, 379, 52
- Wolf et al. (2004) Wolf C., Meisenheimer K., Kleinheinrich M., et al., 2004, A&A, 421, 913
- Wolf et al. (2008) Wolf C., Hildebrandt H., Taylor E. N., Meisenheimer K., 2008, A&A, 492, 933
- Wyder et al. (2005) Wyder T. K., Treyer M. A., Milliard B., Schiminovich D., Arnouts S., Budavri T., Barlow T. A., et al, 2005, ApJ, 619, L15
- Yan et al. (2009) Yan R., Newman J. A., Faber S. M., et al, 2009, MNRAS, 398, 735
- York et al. (2000) York D. G., Adelman J., Anderson J. E. Jr., et al, 2000, AJ, 120, 1579
- Zaninetti (2008) Zaninetti L., 2008, AJ, 135, 1264
- Zheng et al. (2007) Zheng X. Z., Bell E. F., Papovich C., et al 2007, ApJ, 661, L41