A Spectral Atlas of HII Galaxies in the Near-Infrared
Abstract
Recent models show that TP-AGB stars should dominate the NIR spectra of populations 0.3 to 2 Gyr old, leaving unique signatures that can be used to detect young/intermediate stellar population in galaxies. However, no homogeneous database of star-forming galaxies is available in the NIR to fully explore and apply these results. With this in mind, we study the NIR spectra of a sample of 23 H ii and starburst galaxies, aimed at characterizing the most prominent spectral features (emission and absorption) and continuum shape in the 0.8-2.4 m region of these objects. Five normal galaxies are also observed as a control sample. Spectral indices are derived for the relevant absorption lines/bands and a comparison with optical indices of the same sample of galaxies available in the literature is made. We found no correlation between the optical and the NIR indexes. This is probably due to the differences in aperture between these two sets of data. That result is further supported by the absence or weakness of emission lines in the NIR for a subsample galaxies, while in the optical the emission lines are strong and clear, which means that the ionisation source in many of these galaxies is not nuclear, but circumnuclear or located in hot spots outside the nucleus. We detected important signatures predicted for a stellar population dominated by the TP-AGBs, like CN 1.1 m and CO 2.3m. In at least one galaxy (NGC 4102) the CN band at 1.4 m was detected for the first time. We also detect TiO and ZrO bands in the region 0.8-1 m that have never been reported before in extragalactic sources. The shape of the continuum emission is found to be strongly correlated to the presence/lack of emission lines. An observational template for the star-forming galaxies is derived to be used as a benchmark of stellar population(s) in starburst galaxies against which to compare near-IR spectroscopy of different types of galaxies, especially those with AGN activity and/or those at high-redshift.
keywords:
Stars: AGB and post-AGB, Galaxies: starburst, Infrared: galaxies1 Introduction
The study of star-formation systems is of extreme importance to our understanding of galaxy formation and evolution. Age-dating the stellar populations of galaxies provides us with a cosmic timescale that is independent of cosmological models as well as with a mean of reconstructing their star-formation history. It also allows to investigate on issues such as the propagation of the star formation, how it is triggered and the relationship between starbursts and nuclear activity.
In this context, H ii/star-forming galaxies are excellent and the closest laboratories available for studying the above phenomena in extragalactic sources. Because of the proximity of many of them, high-angular resolution can be obtained at almost all wavelengths. Moreover, they can be seen as “scaled-down” versions of the starbursts seen at high redshifts (Bernard-Salas et al., 2009).
Therefore, the study of local H ii/star-forming galaxies is a need, as these objects were much more numerous in the past (Blain et al., 2002; Elbaz & Cesarsky, 2003), and are believed to give rise to the bulk of the cosmic infrared background radiation (Bernard-Salas et al., 2009).
Starburst features in the optical region are nowadays considerably well known and studied, and have been a fundamental tool to identify star-formation in galaxies (eg. Kennicutt, 1988, 1992; Worthey & Ottaviani, 1997; Balogh et al., 1997; Gu et al., 2006). However, in many cases, the use of this knowledge is not always possible due either to severe dust obscuration, or the strength of an active galactic nucleus (AGN) in the optical region. In this case, the near-infrared region (NIR, hereafter) might be of unprecedented value. At NIR wavelengths stellar photospheres usually remain the dominant sources of light, and galaxy spectra are shaped by red supergiants (RSG) shortly after starbursts, and then by giants of the first and of the asymptotic giant branches (AGB). Indeed, evolved intermediate-mass (2 10 M⊙) stars have been shown to contribute significantly to integrated NIR fluxes, even when they represent a negligible contribution to the stellar mass (Persson et al., 1983; Frogel et al., 1990; Melbourne et al., 2012; Lyubenova et al., 2012).
The use of the NIR to study stellar populations is not new. Rieke et al. (1980) studied the stellar population of NGC 253 and M 82 using spectroscopy at this wavelength range. They detected a strong 2.2 CO band, suggesting the presence of a dominant population of red giants and supergiants in the nuclear region of these sources. Many other authors have been using the NIR wavelength region to study stellar populations in galaxies, mostly based on the 2.2 CO band (eg Origlia et al., 1993; Oliva et al., 1995; Engelbracht et al., 1998; Lançon et al., 2001; Riffel et al., 2008, 2009; Melbourne et al., 2010). Photometric methods in this region have also been used (eg. Moorwood & Glass, 1982; Hunt et al., 2003; Micheva et al., 2012).
It was Heisler & De Robertis (1999) who presented the first systematic study of H ii/starburts galaxies in the NIR, covering the interval 1-2.4. Their sample, composed of 13 of such galaxies, was characterised by a peak of the continuum emission at 60. They attribute the relatively warm colours of these objects to the fact that they are undergoing their first major episode of massive star formation. Based on the colours found from a sample of AGNs, they proposed an evolutionary scenario in which the starburst represents the early stages that eventually evolves into Seyfert when the starburst has faded and collapsed to form and/or fuel an AGN. Since then, many works were devoted to the study of samples composed of H ii/star-forming and normal galaxies as well as AGNs (Goldader et al., 1997; Coziol et al., 2001; Reunanen et al., 2002, 2003; Alonso-Herrero et al., 2000; Cesetti et al., 2009; Bendo & Joseph, 2004; Riffel et al., 2008, 2009; Martins et al., 2010; Kotilainen et al., 2012, to name a few). Up to our knowledge, no homogeneous sample of local H ii/star-forming galaxy spectra (0.02) has been published in the literature in the NIR, deterring efforts to gather a clearer view of these sources. The discussion becomes highly relevant in the light of recent results obtained by Melbourne et al. (2012), which shows that TP-AGB sequences can account for as much as 17% of the 1.6m flux for local galaxies and for a much larger fraction at higher redshifts. Indeed, these authors show that at high-, the summation of all IR luminous sources can be expected to be as high as 70%, most of which comes from TP-AGB and red helium burning stars (RHeBs). Other approaches (Zibetti et al., 2012) claim that the two main signatures of the presence of TP-AGB stars predicted by the Maraston (2005)’s models, CN at 1.41m and C2 at 1.77m, are not detected in a sample of 16 post-starburst galaxies.
With all this in mind, we obtained NIR spectra of a sample of galaxies known to have young stellar populations from optical observations, suitable for studying their most important spectral features and that can be used as proxies for stellar population studies. We also include “normal” galaxies in our sample as a control sample. This study aims to complement efforts made by other authors in the optical Ho et al. (1995) and in the mid-infrared (Bernard-Salas et al., 2009) to characterised these sources. In §2 we present the details of our observations and reduction process; in §3 we show the measurement of NIR indexes; in §4 we present the measurement of the emission lines; in §5 we discuss and correlate the results from the previous sections, in §6 we analyse the continuum shape and in §7 we present our conclusions.
2 Observations and Reduction
The galaxies studied here are a subset of those presented in the magnitude-limited optical spectroscopic survey of nearby bright galaxies of Ho et al. (1995, hereafter HO95). They observed over 486 galaxies having 12.5 mag and . Sources falling into category (2) defined by Ho et al. (1997, hereafter HO97) as those composed of “nuclei dominated by emission lines from regions of active star formation (H ii or starburst nuclei)” were prone to observation. In addition, five galaxies classified as “normal” in the optical, dominated by old-stellar populations and with no detected emission lines, were included as a control sample. It is important to mention that Kotilainen et al. (2012) observed a sample of ”normal” spiral galaxies at NIR wavelengths. They were not used here as a comparison because of the the difference in slit sizes and because they only have H and K bands. Although our initial list of objects was composed of nearly 100 galaxies, only a small fraction of them could be observed during our available observing time. In this sense, our sample is not complete as the targets were selected according to their availability in the sky. However, they are representative of their class as all of them were extracted from a magnitude-limited catalogue, and have the same distribution of morphology, redshifts and H flux as the original sample.
All spectra were obtained at the NASA 3m Infrared Telescope Facility (IRTF) in two observing runs. The first one during the period of October 31 November 2, 2007, and the second one on the nights of April 23-25, 2008. Table 1 shows the log of observations for all galaxies. The SpeX spectrograph (Rayner et al., 2003) was used in the short cross-dispersed mode (SXD, 0.8-2.4 m). The detector consists of a 1024x1024 ALADDIN 3 InSb array with a spatial scale of 0.15”/ pixel. A 0.8”x 15” slit oriented in the north-south direction was used, providing a spectral resolution, on average, of 320 km s-1. This value was determined both from the arc lamp and the sky line spectra and was found to vary very little with wavelength along the observed spectra. The seeing varied from night to night but on average, most objects were observed under 1 seeing conditions.
Observations were done nodding in an object-sky-sky-object pattern. The sky position was usually several arcminutes from the galaxy nucleus free of extended emission or background stars. After each galaxy a telluric star, close in airmass to the former, was observed to remove telluric features and to perform the flux calibration. The spectral reduction, extraction and wavelength calibration procedures were performed using SPEXTOOL, the in-house software developed and provided by the SpeX team for the IRTF community (Cushing et al., 2004). Telluric features removal and flux calibration were done using XTELLCOR, another software available by the SpeX team. The different orders were merged into a single 1D spectrum from 0.8m to 2.4m using the XMERGEORDERS routine. After this procedure, the IDL routine ”Xlightloss”, also written by the SpeX team, was employed. It corrects an input spectrum for slit losses relative to the standard star used for flux calibration. This program is useful if either the object or the standard were not observed with the slit at the parallactic angle. Differential refraction is, indeed, the main source of uncertainty in flux calibration and it was minimised following the above procedure. Finally, the spectra were corrected for Galactic extinction using the Cardelli et al. (1989) law and the extinction maps of Schlafly & Finkbeiner (2011).
Table 1 shows the final sample, composed of 28 galaxies, 23 of them classified as H ii/star-forming galaxies. The remaining objects are classified as non-starforming galaxies for comparison. In addition to the nuclear spectrum, a different number of off-nuclear apertures were extracted for each galaxy, depending on the size of the extended emission across the slit. Informations for each object are also presented in Table 1.
| Galaxy | z | Morphology | Exp. Time (s) | Seeing(″) | Apertures | Class | Opt | W(G band)a | log F(Hα)a | Reference |
|---|---|---|---|---|---|---|---|---|---|---|
| (b) | (c) | (d) | (e) | (f) | ||||||
| NGC 0221 | -0.0007 | cE2 | 10x150 | 1.4 | nuc + 3 | N | yes | 4.54 | - | 1 |
| NGC 0278 | 0.0021 | SAB(rs)b | 12x150 | 0.8 | nuc + 3 | H | yes | 0.50 | -13.45 | 1 |
| NGC 0514 | 0.0082 | SAB(rs)c | 12x180 | 0.8 | nuc + 2 | H | yes | 3.86 | -14.64 | 1 |
| NGC 0674 | 0.0104 | SAB(r)c | 12x180 | 1.7 | nuc + 2 | H | yes | 4.38 | -14.31 | 1 |
| NGC 0783 | 0.0173 | SBc | 10x180 | 0.8 | nuc + 2 | H | yes | 1.98 | -13.54 | 1 |
| NGC 0864 | 0.0052 | SAB(rs)c | 10x180 | 0.9 | nuc + 2 | H | yes | 1.03 | -12.88 | 1 |
| NGC 1174 | 0.0091 | SB(r)bc | 10x180 | 0.9 | nuc + 2 | H | yes | 3.04 | -13.07 | 1 |
| NGC 1232 | 0.0053 | SAB(rs)c | 8x180 | 1.3 | nuc | N | no | - | - | 2 |
| NGC 1482 | 0.0064 | SA0+ pec | 4x180 | 1.3 | nuc +2 | H | no | - | - | 3 |
| NGC 2339 | 0.0074 | SAB(rs)bc | 6x180 | 1.1 | nuc + 2 | H | yes | 0.00 | -13.07 | 1 |
| NGC 2342 | 0.0176 | S pec | 7x180 | 1.0 | nuc | H | yes | 0.67 | -12.83 | 1 |
| NGC 2903 | 0.0019 | SAB(rs)bc | 12x180 | 0.6 | nuc + 7 | H | yes | 0.57 | -12.63 | 1 |
| NGC 2950 | 0.0045 | (R)SB(r)0 | 10x180 | 1.1 | nuc + 4 | N | yes | 4.98 | - | 1 |
| NGC 2964 | 0.0044 | SAB(r)bc | 12x180 | 1.0 | nuc + 2 | H | yes | 1.03 | -12.75 | 1 |
| NGC 3184 | 0.0020 | SAB(rs)cd | 12x180 | 0.6 | nuc + 2 | H | yes | 1.37 | -13.12 | 1 |
| NGC 4102 | 0.0028 | SAB(s)b | 10x180 | 0.8 | nuc + 2 | H | yes | 1.94 | -12.52 | 1 |
| NGC 4179 | 0.0042 | S0 | 8x180 | 1.3 | nuc + 2 | N | yes | 4.89 | -14.30 | 1 |
| NGC 4303 | 0.0052 | SAB(rs)bc | 10x180 | 0.9 | nuc + 6 | H | yes | 3.60 | -12.84 | 1 |
| NGC 4461 | 0.0064 | SB(s)0+ | 16x180 | 1.0 | nuc + 2 | N | yes | 4.67 | - | 1 |
| NGC 4845 | 0.0041 | SA(s)ab | 10x180 | 0.8 | nuc + 6 | H | yes | 4.18 | -13.61 | 1 |
| NGC 5457 | 0.0008 | SAB(rs)cd | 10x180 | 2.0 | nuc + 2 | H | yes | 1.03 | -13.33 | 1 |
| NGC 5905 | 0.0113 | SB(r)b | 10x180 | 0.8 | nuc + 2 | H | yes | 2.15 | -13.13 | 1 |
| NGC 6181 | 0.0079 | SA(rs)c | 9x180 | 0.7 | nuc + 2 | H | yes | 4.43 | -13.57 | 1 |
| NGC 6946 | 0.0195 | SAB(rs)cd | 16x180 | 1.1 | nuc | H | yes | 0.32 | -13.01 | 1 |
| NGC 7080 | 0.0161 | SB(r)b | 10x150 | 0.8 | nuc + 2 | H | yes | - | -13.49 | 1 |
| NGC 7448 | 0.0073 | SA(rs)bc | 12x180 | 1.1 | nuc + 2 | H | yes | 0.42 | -14.01 | 1 |
| NGC 7798 | 0.0080 | SBc | 8x180 | 1.0 | nuc + 2 | H | yes | 0.04 | -13.16 | 1 |
| NGC 7817 | 0.0077 | SAbc | 12x180 | 1.1 | nuc + 2 | H | yes | 3.57 | -13.25 | 1 |
References:
(1) Ho et al. (1995)
(2) Kennicutt (1988)
(3) Coziol et al. (1998)
(a)Adopted from Ho et al. (1997).
(b) Number of apertures extracted from each galaxy. (c) H means HII galaxy and
N means normal galaxy. (d) Does it have observations in the optical?
(e) Measured G band. (f) Measured H flux.
3 Near-Infrared Spectral Indexes
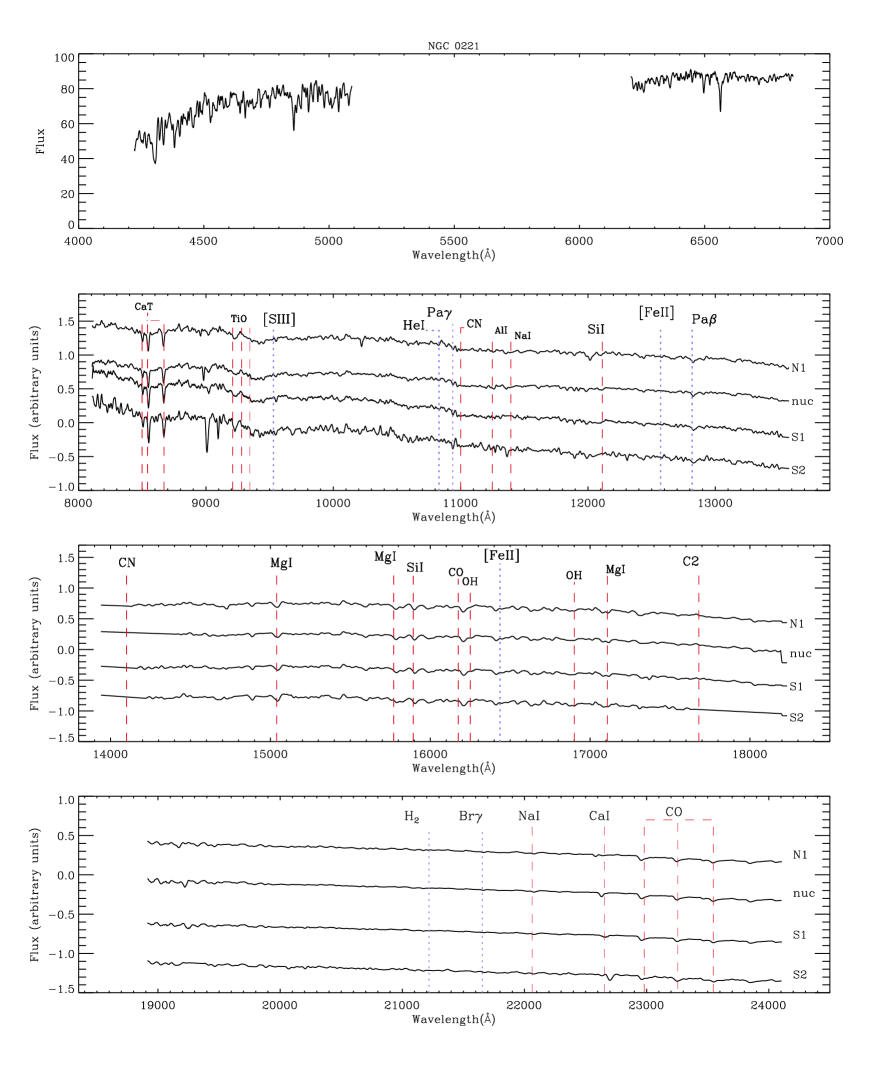
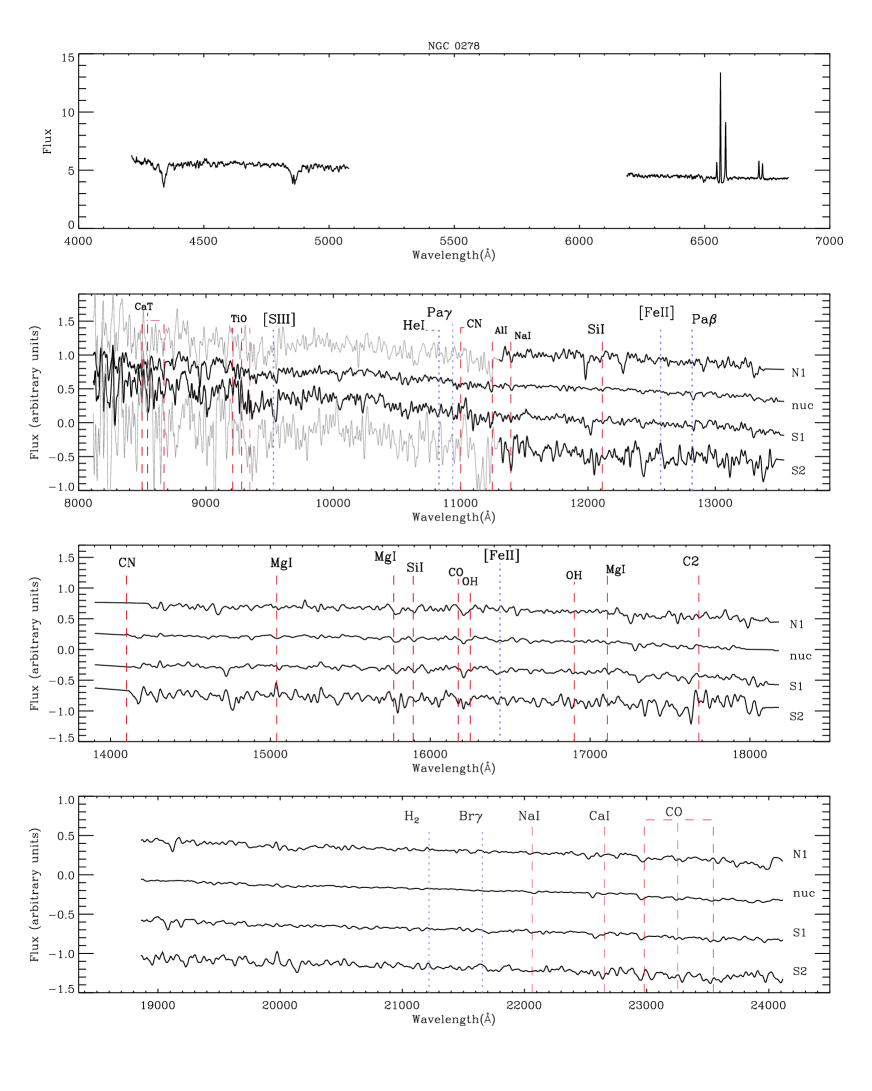
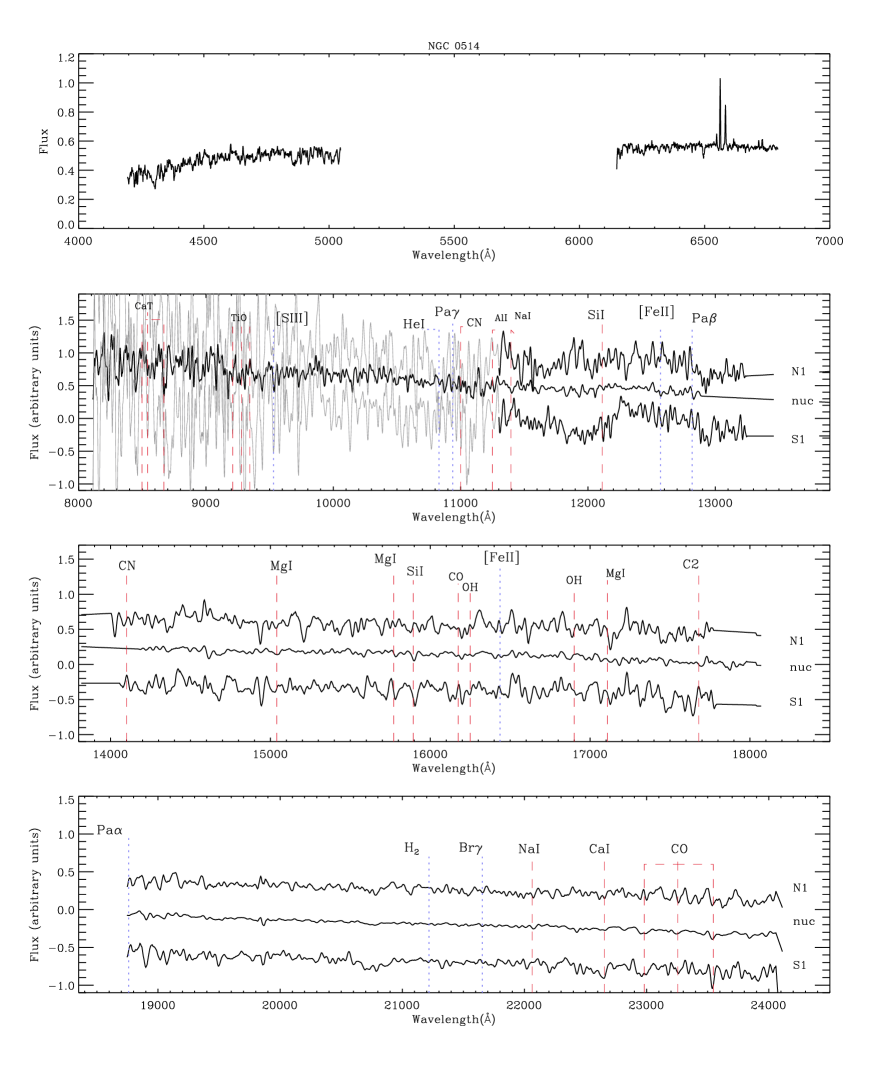
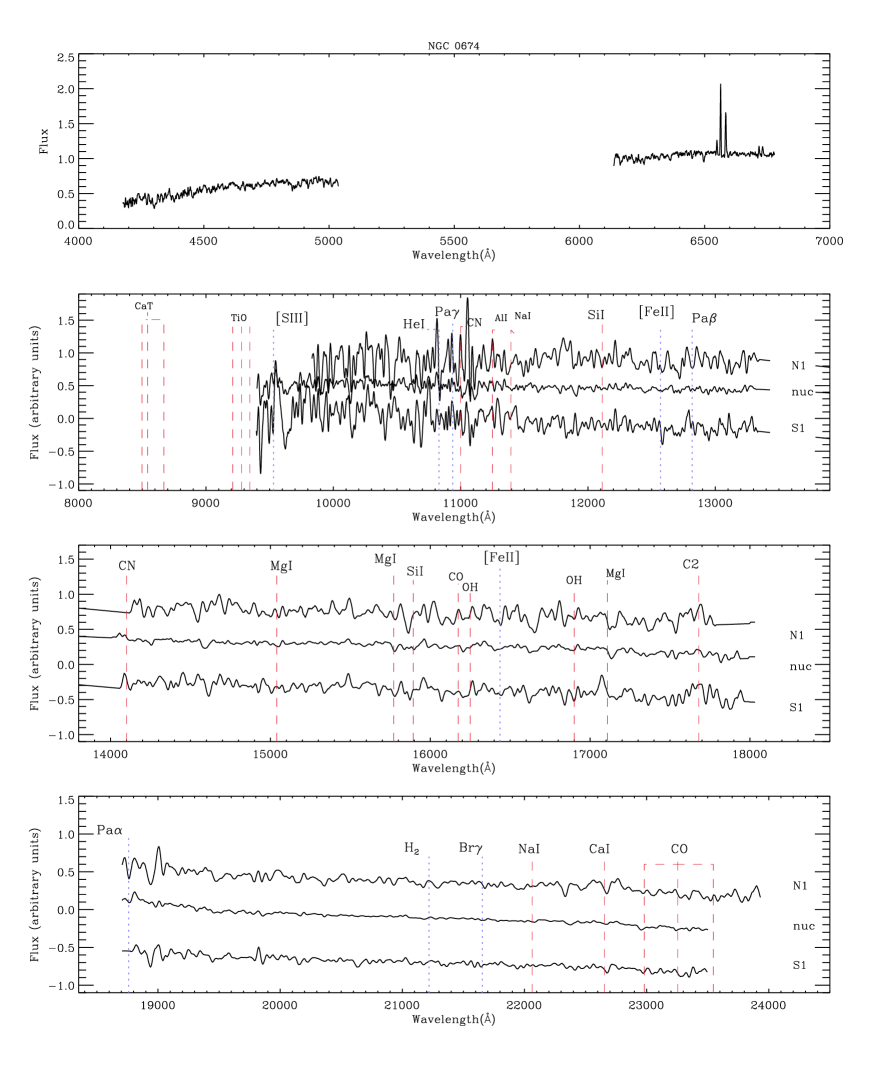
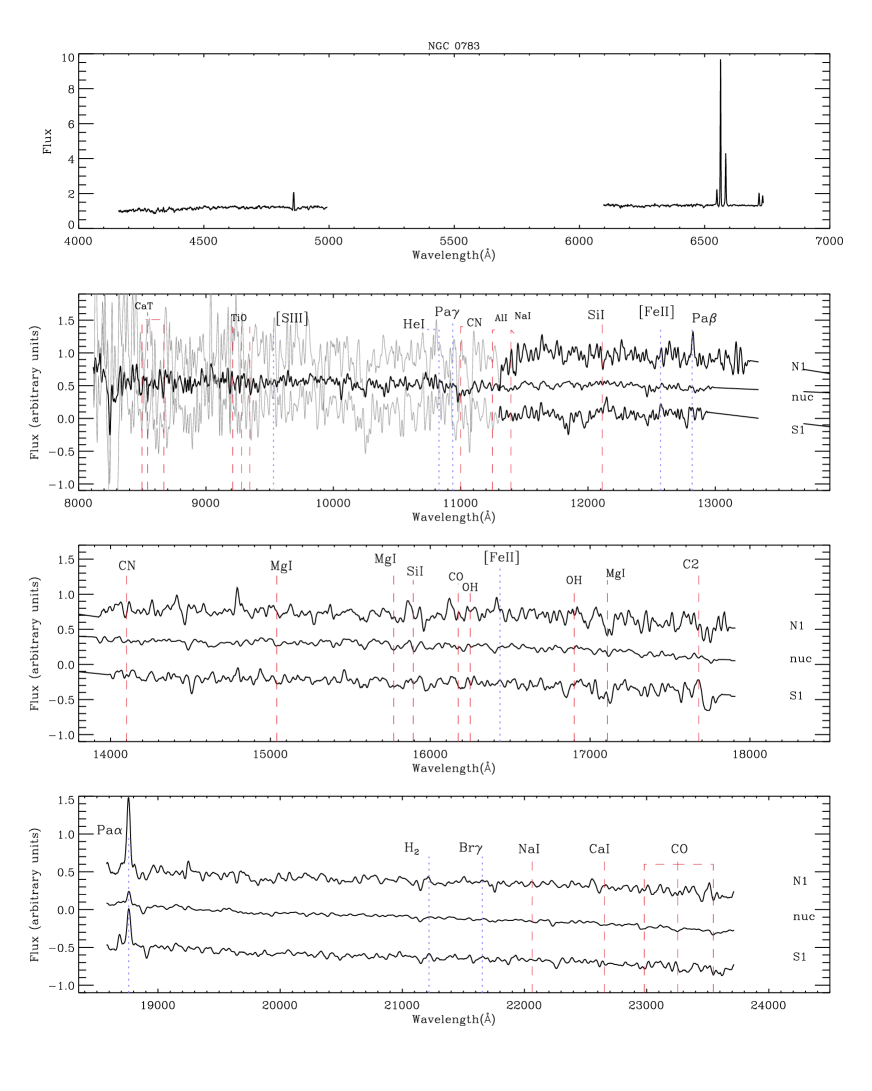
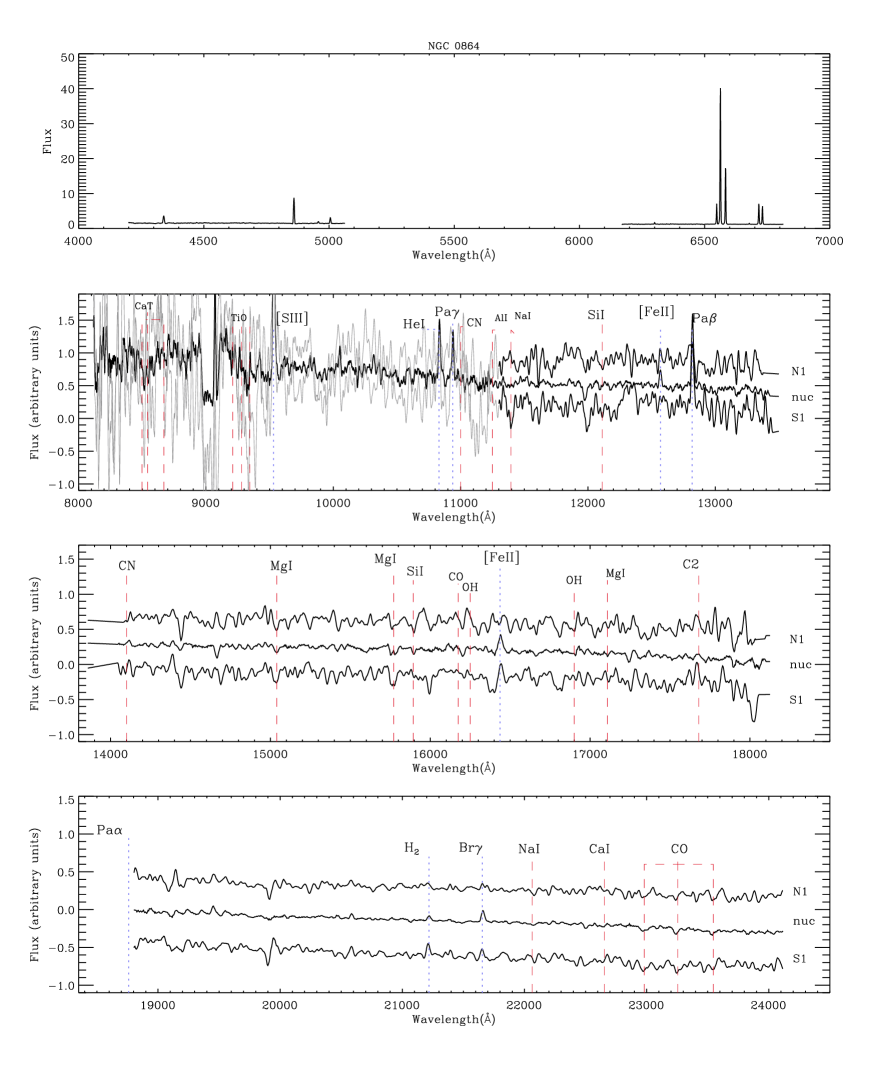
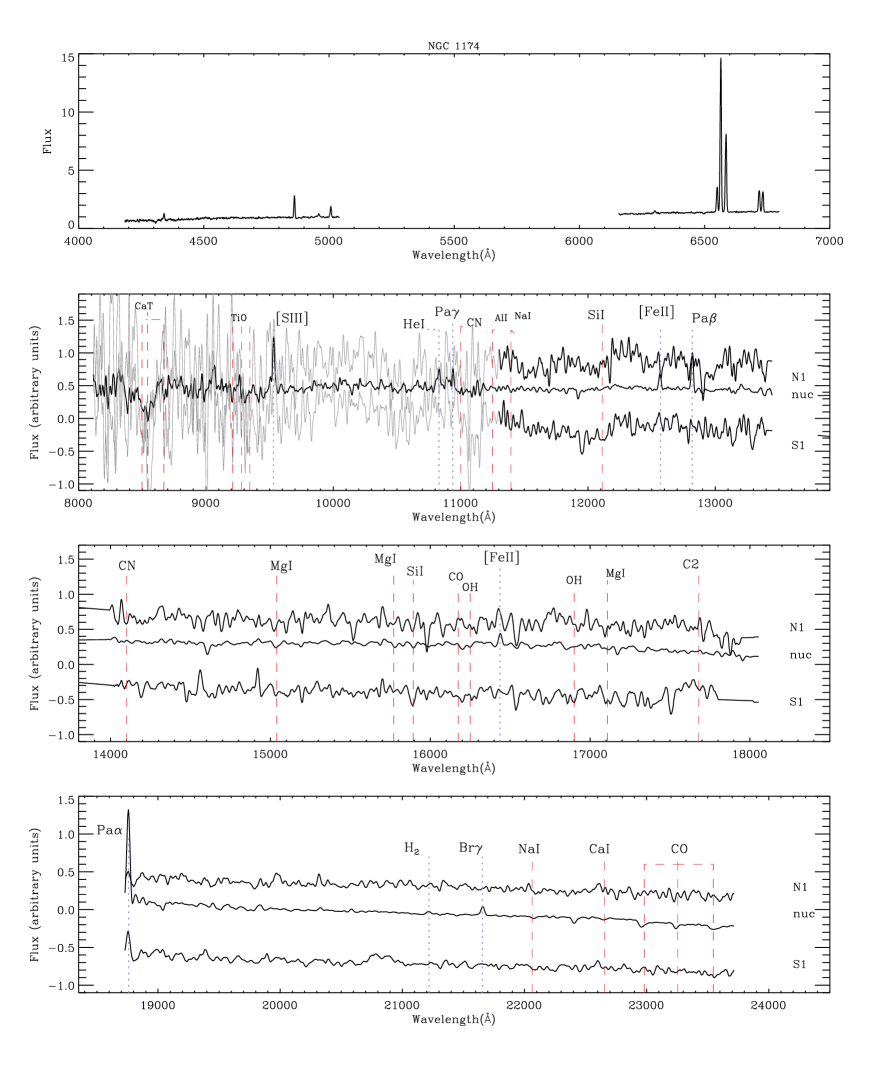
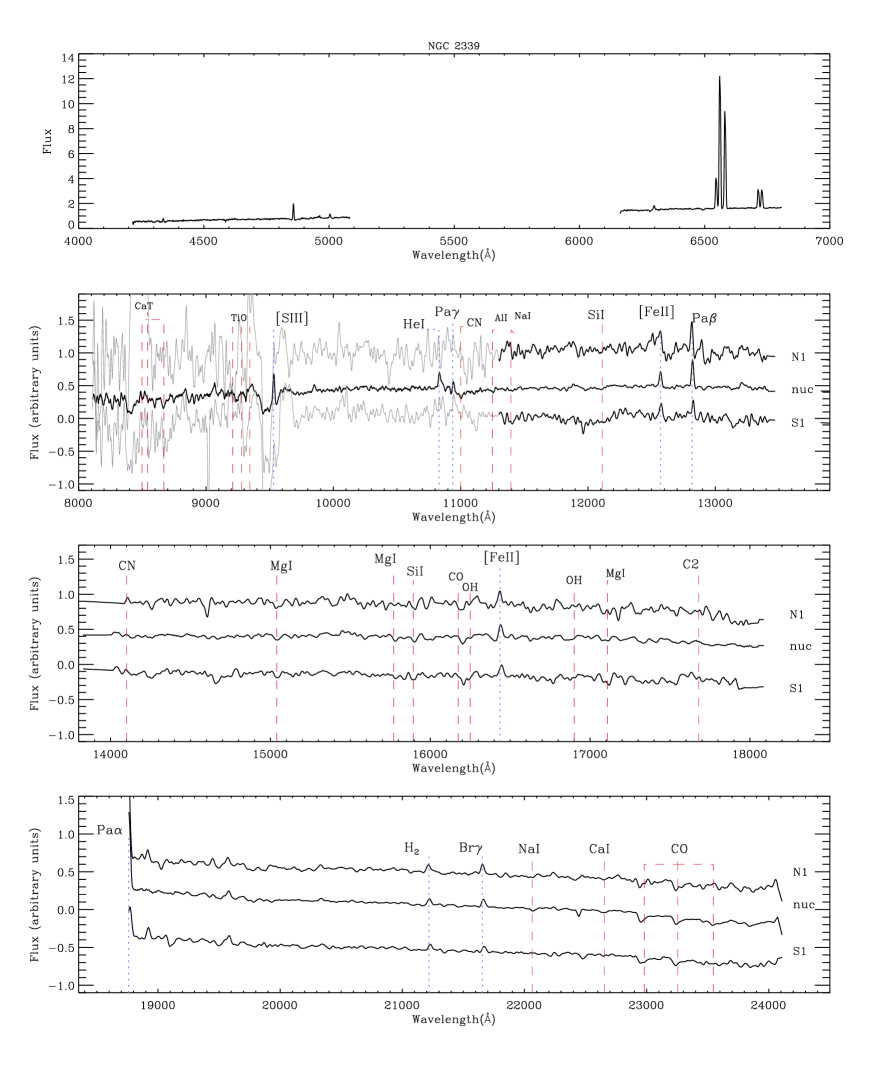
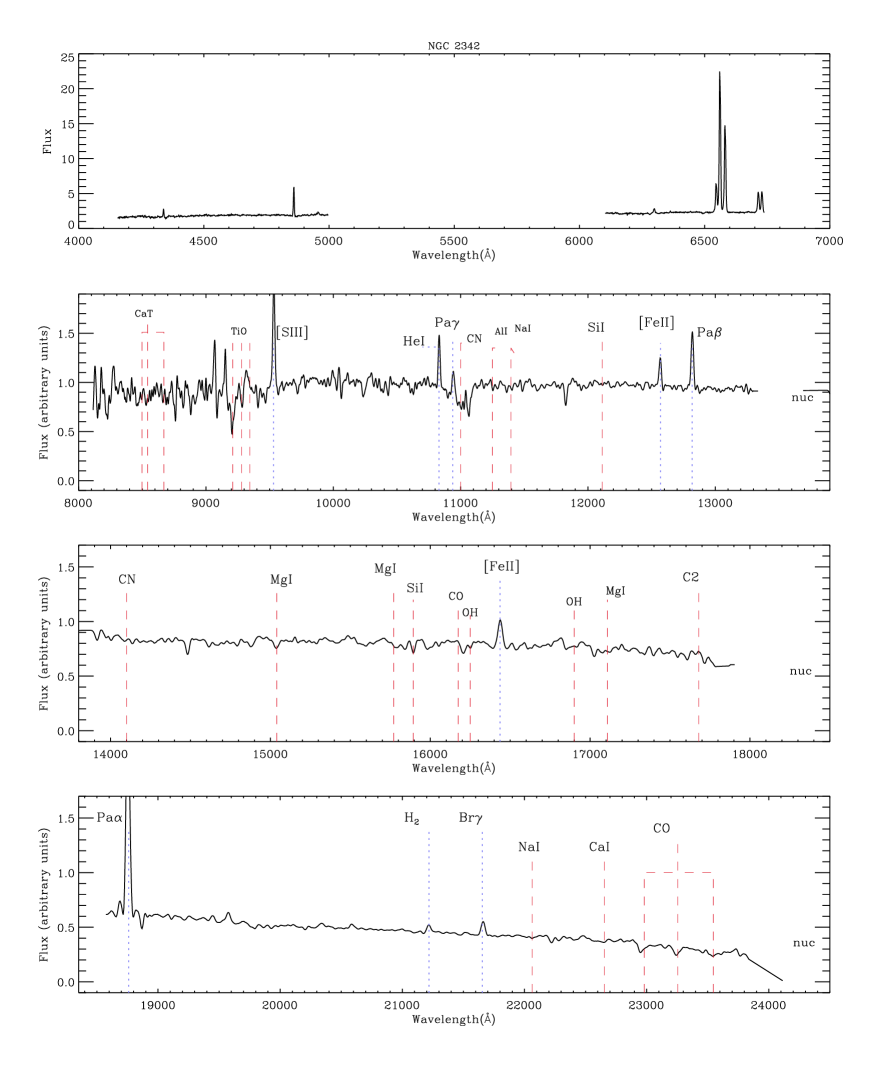
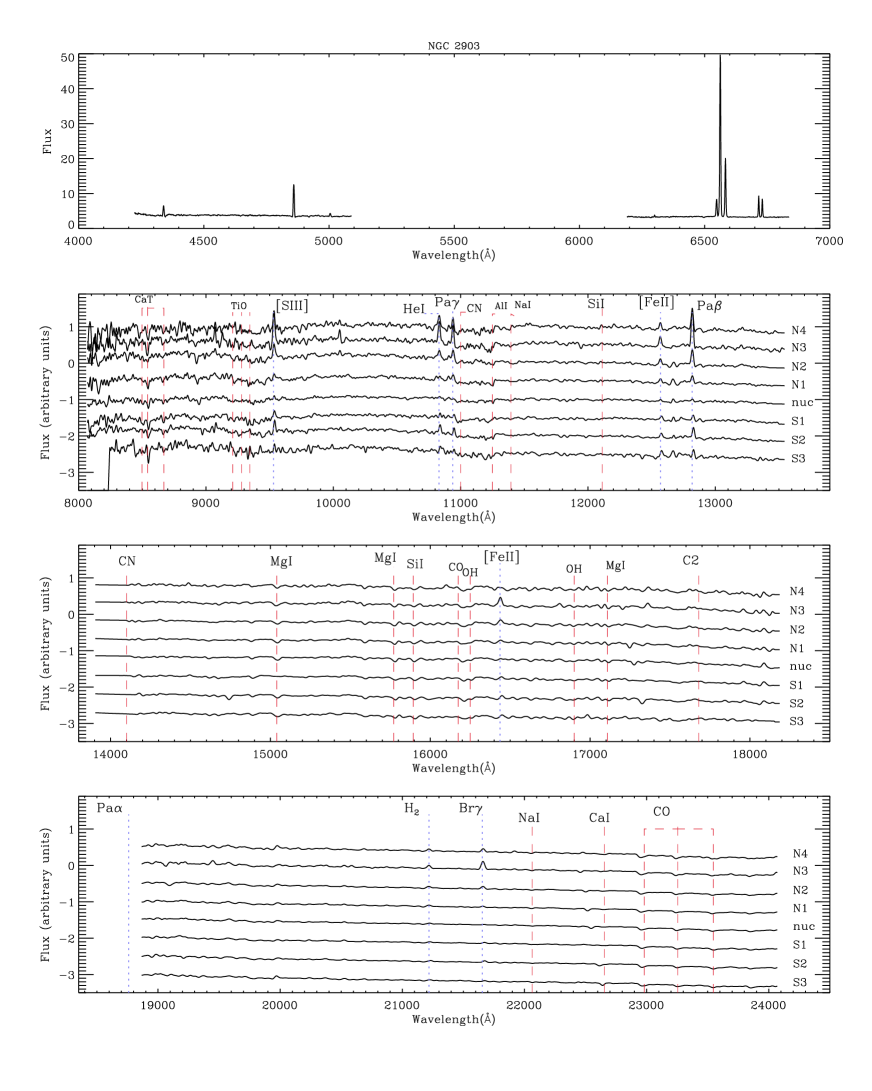
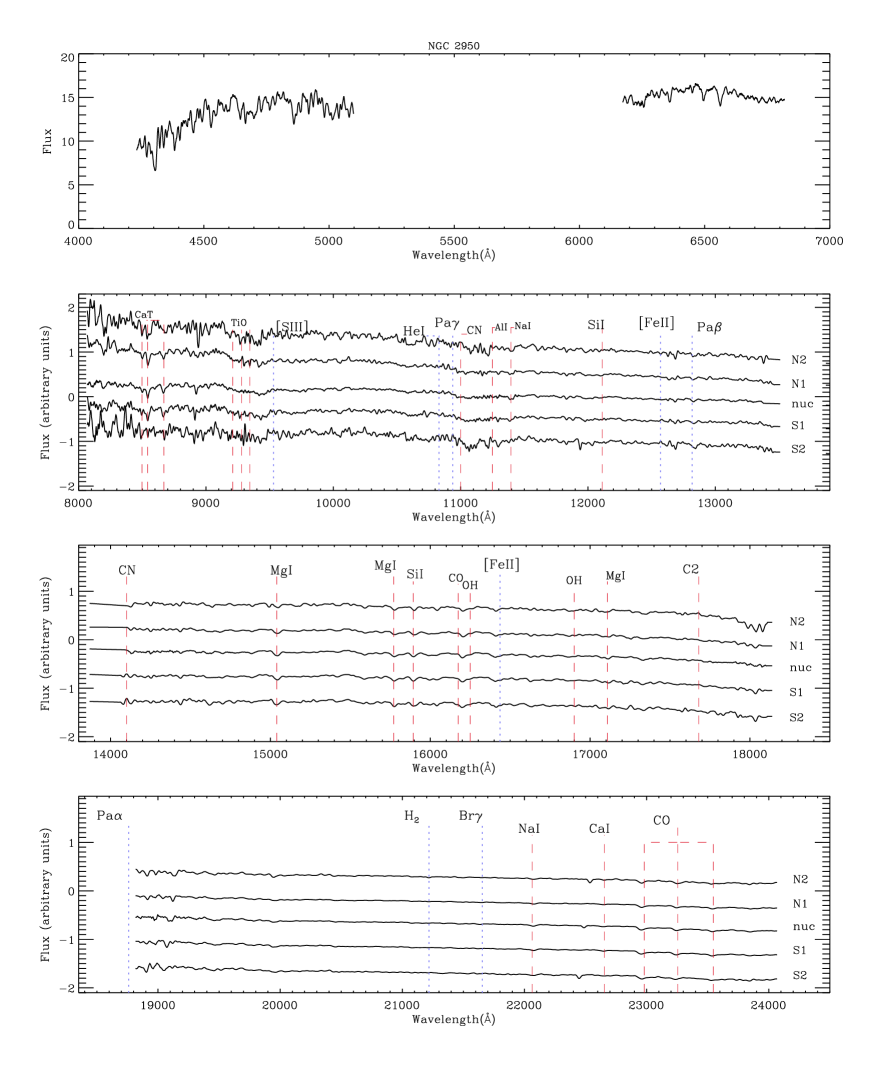
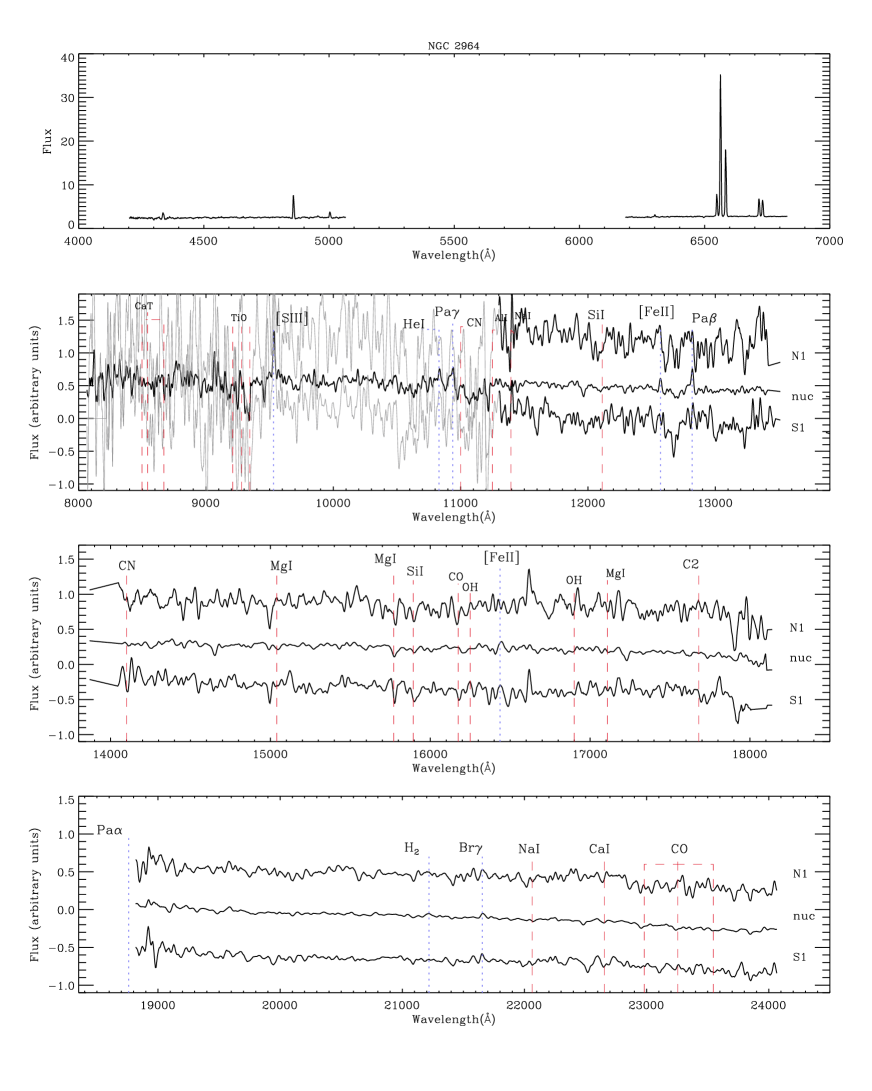
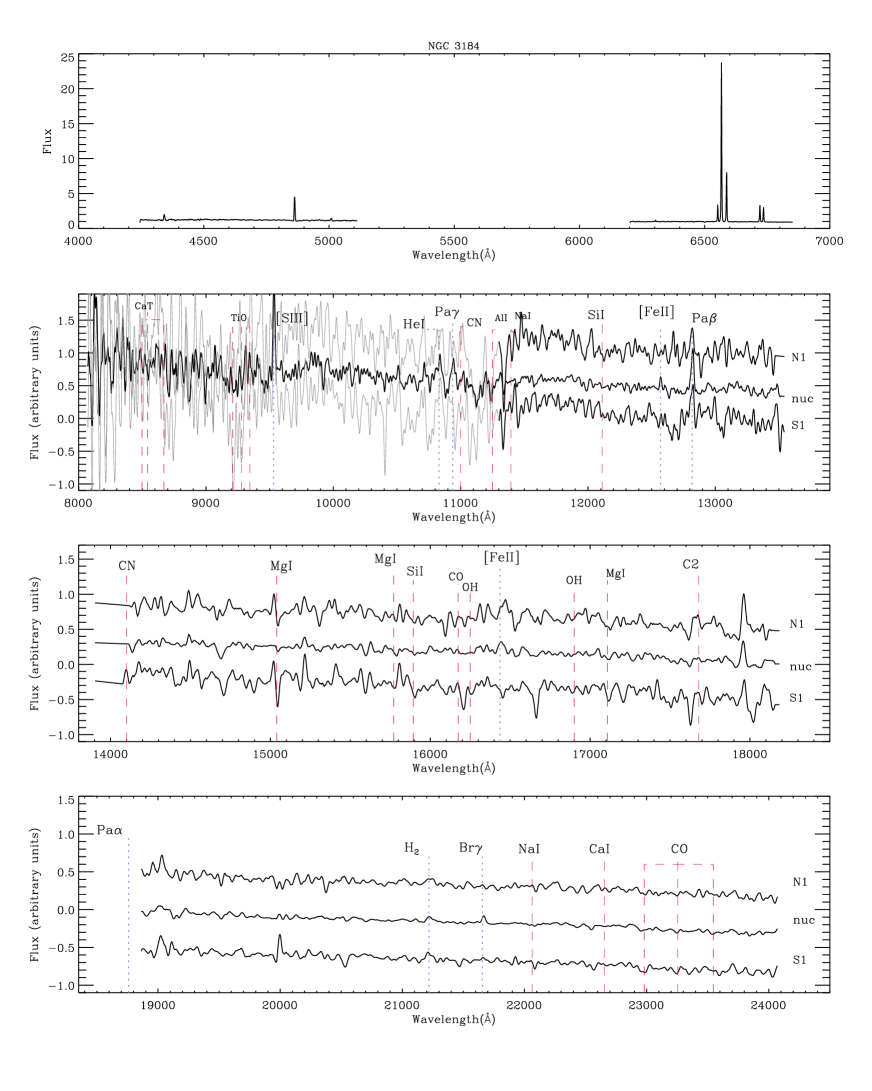
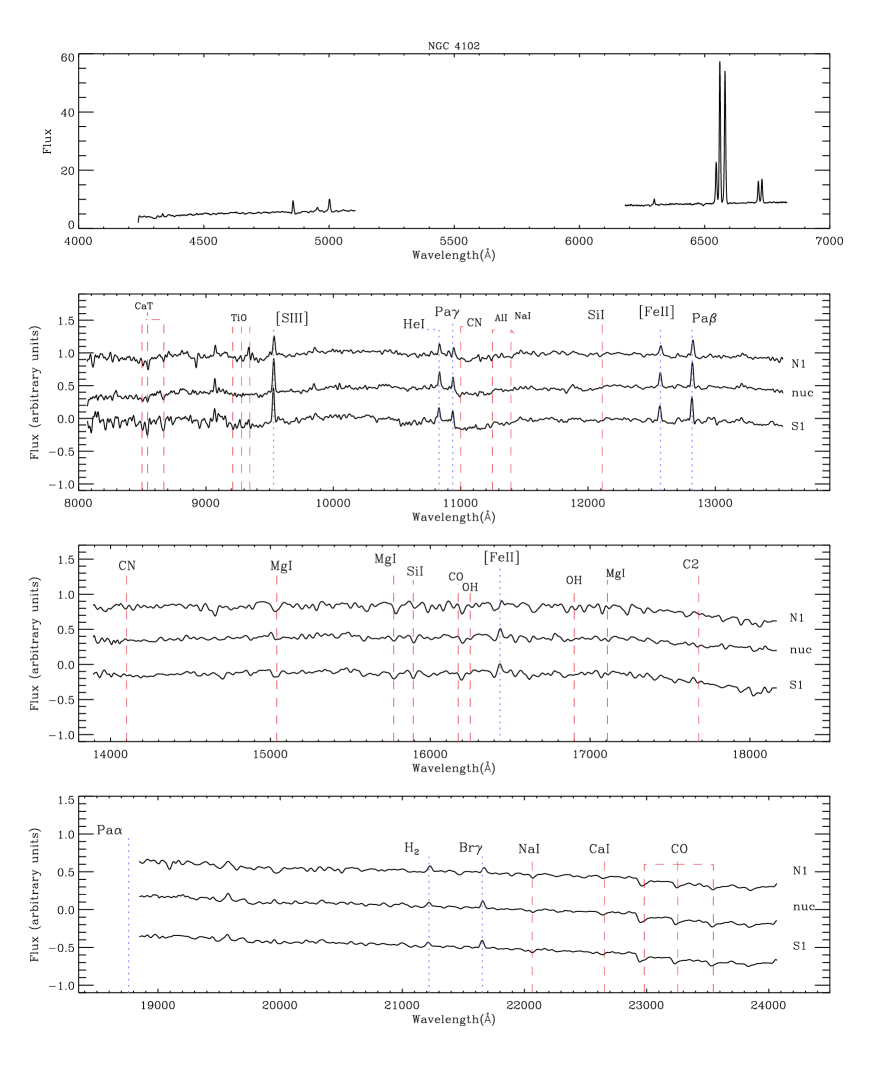
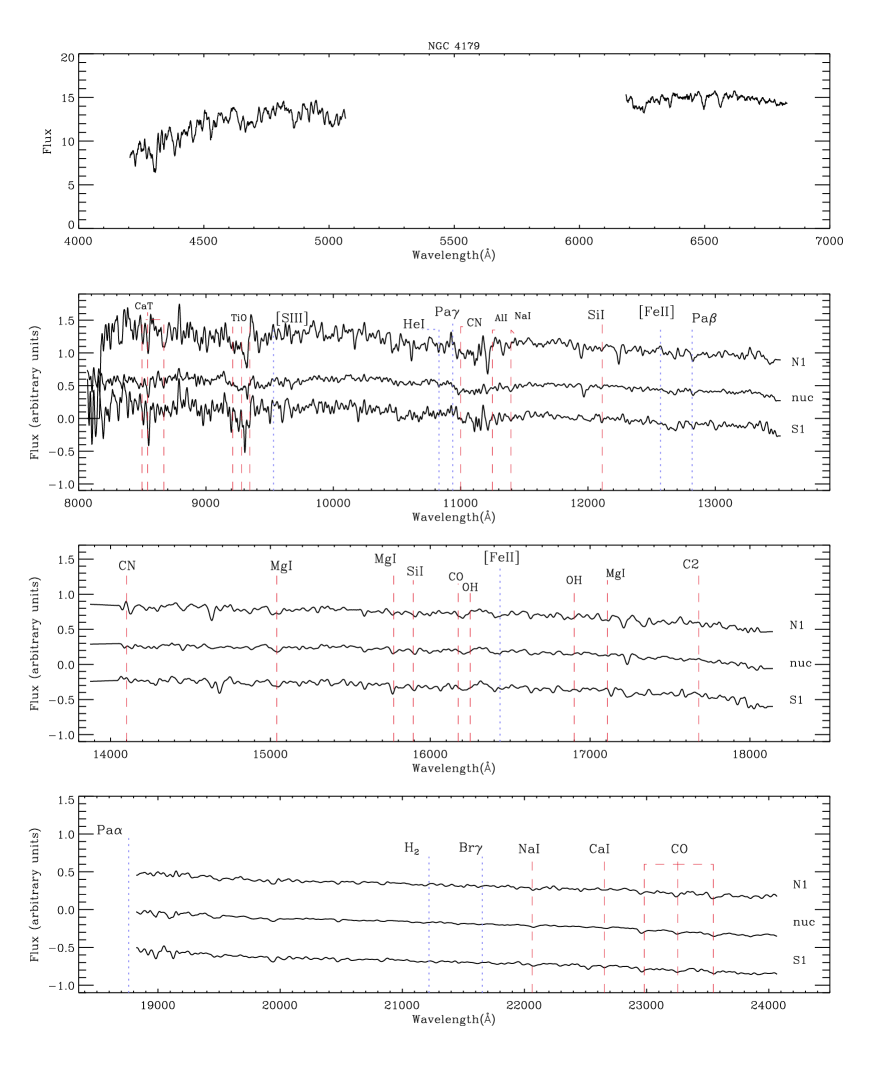
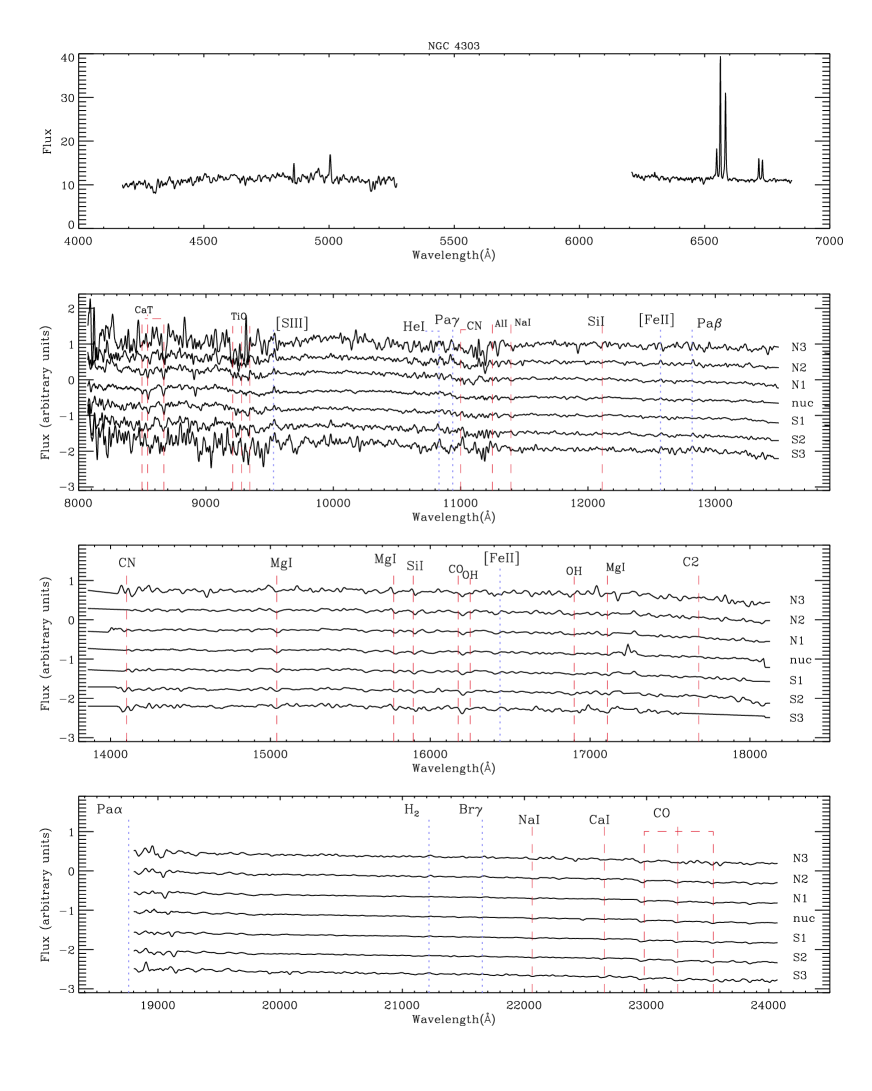
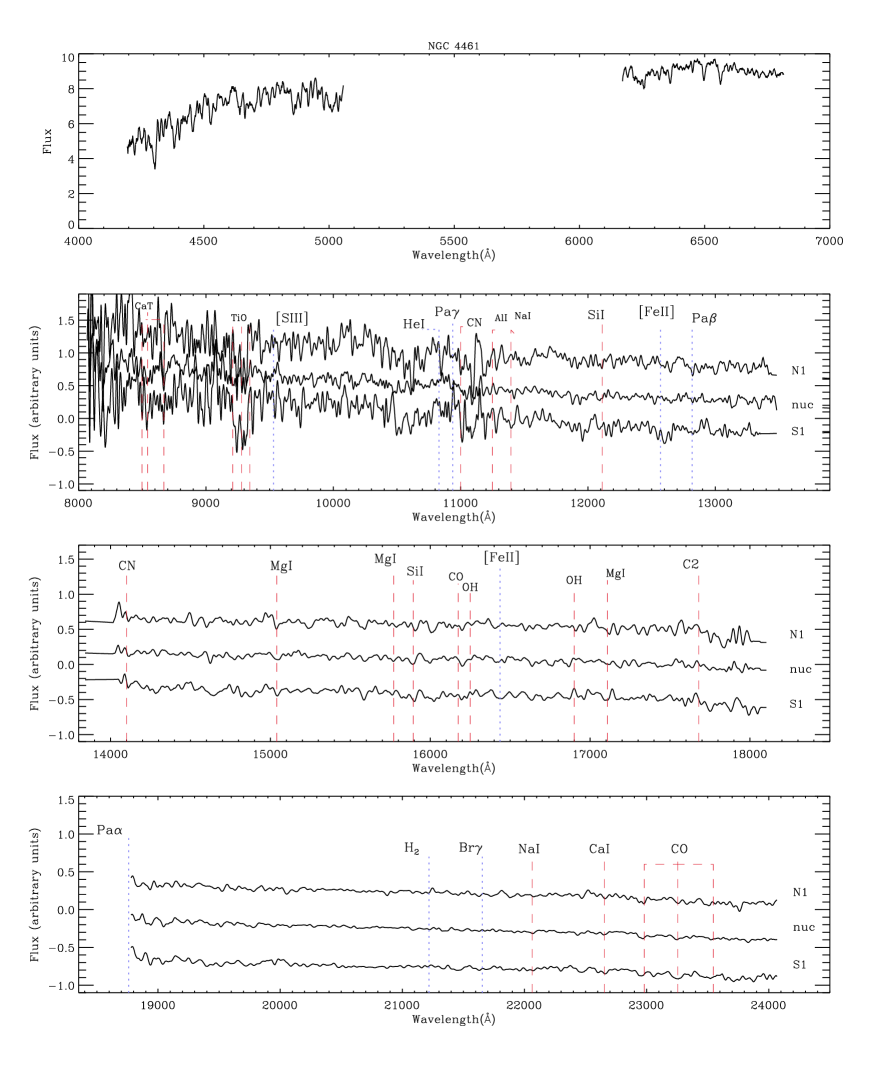
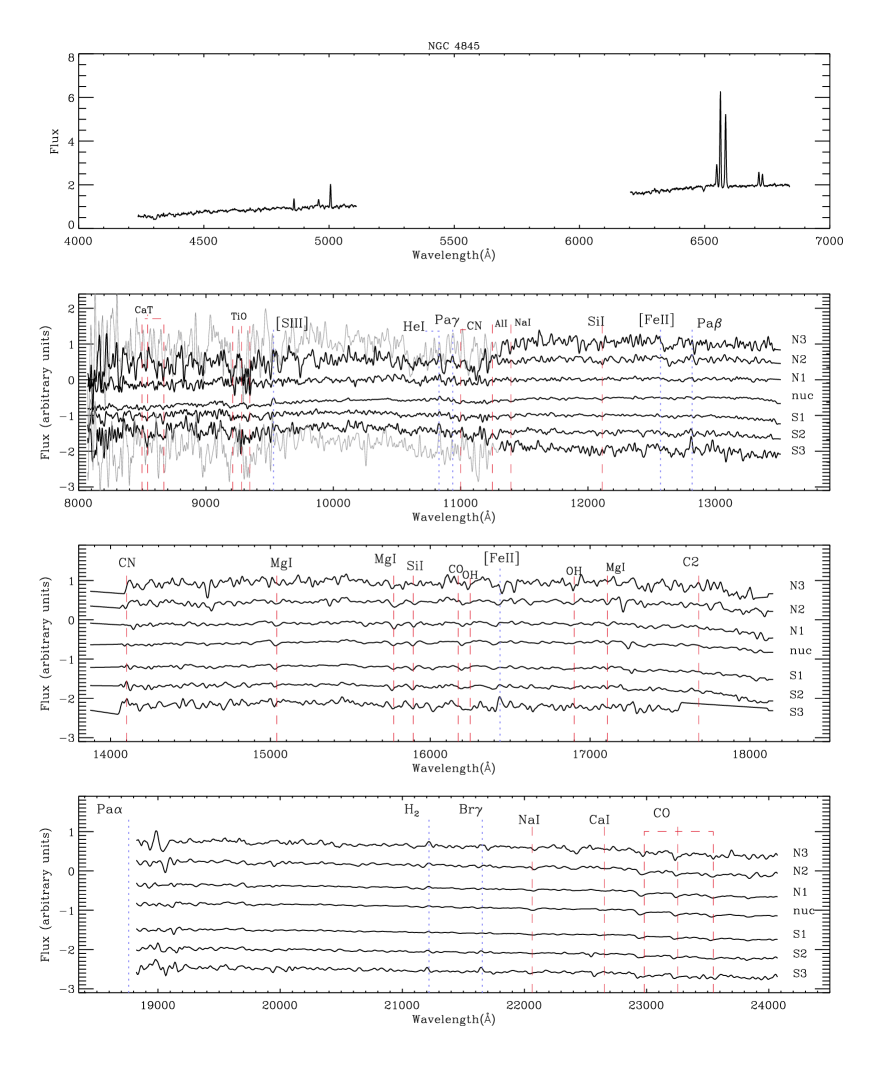
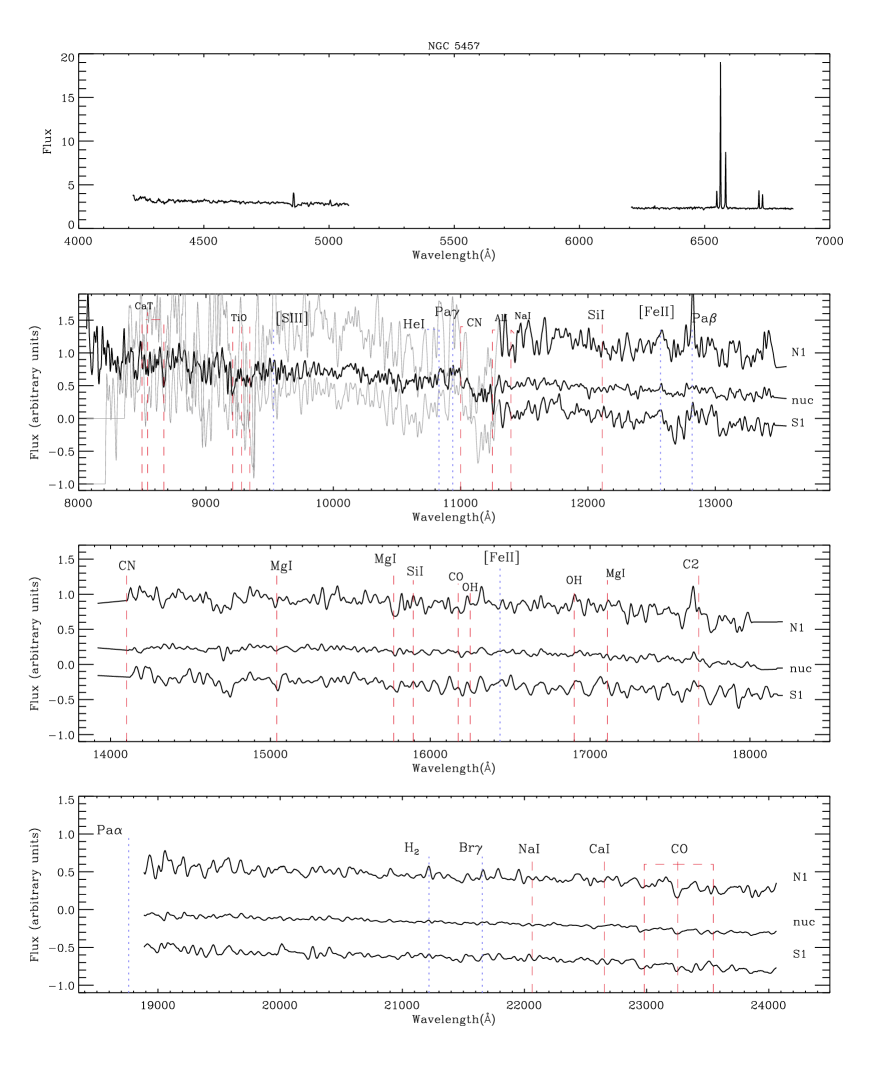
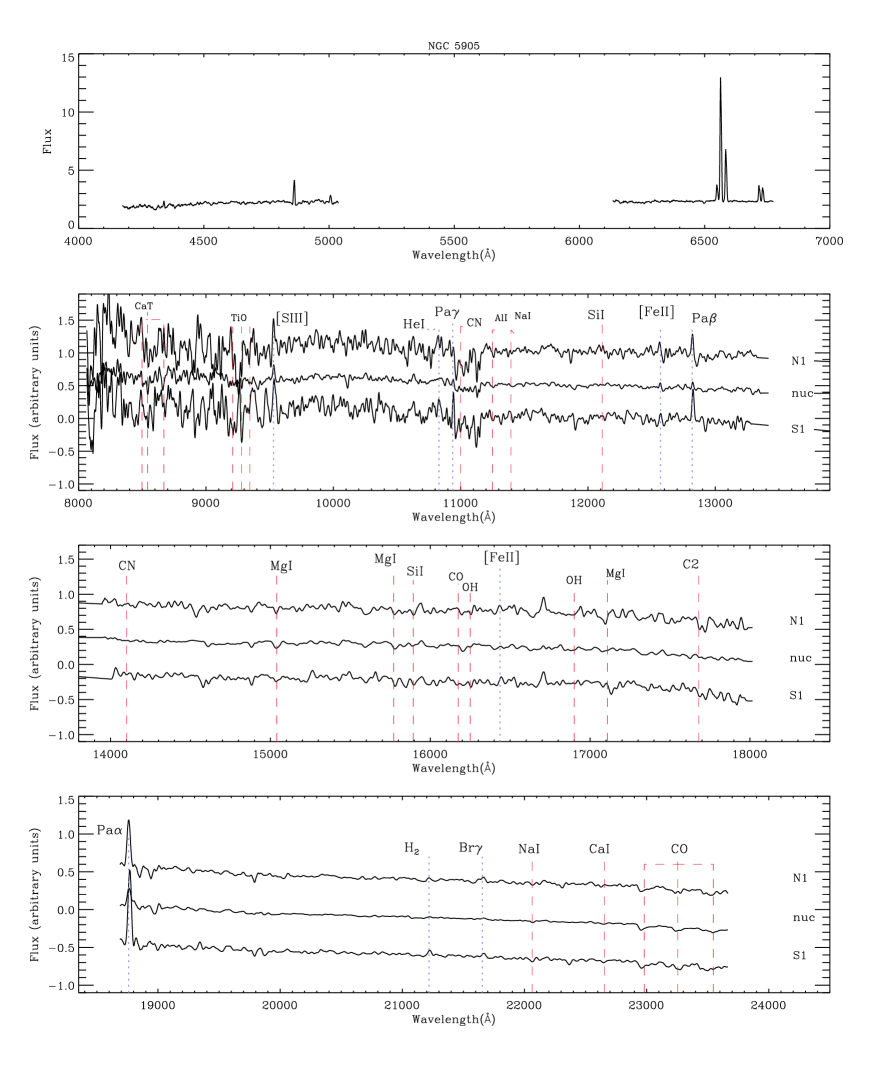
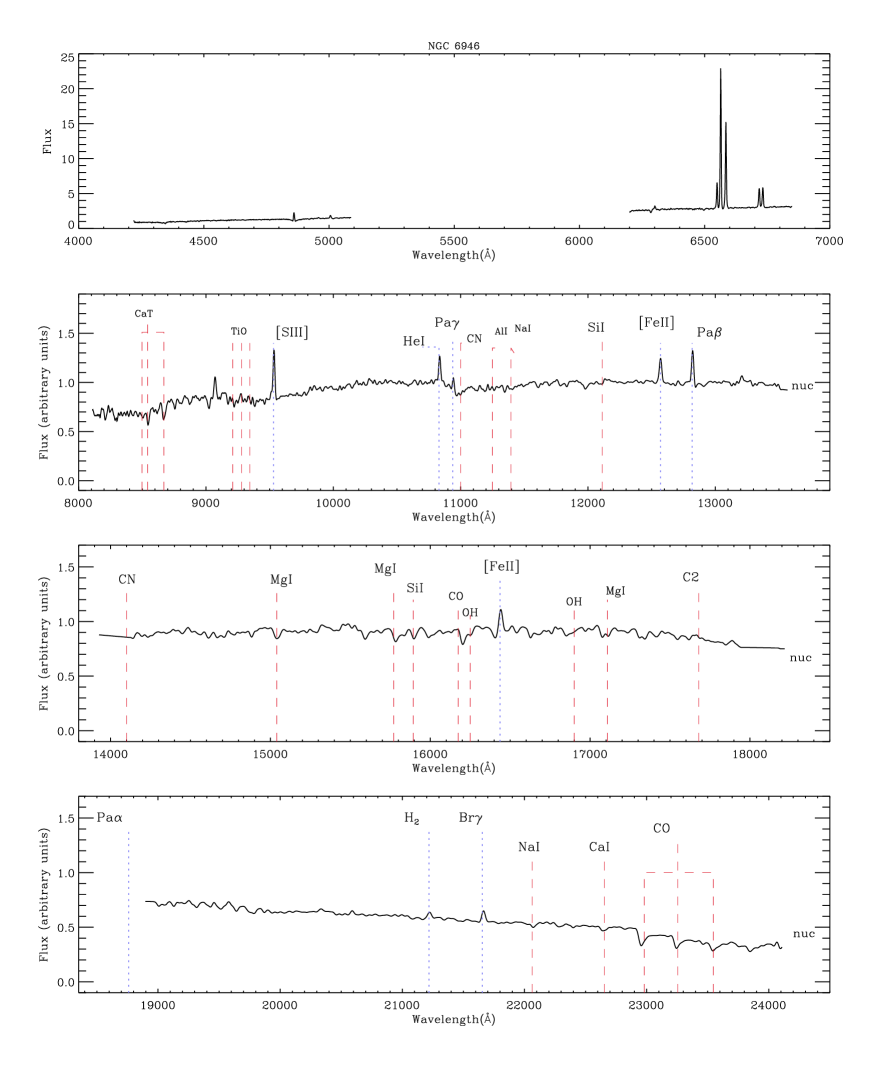
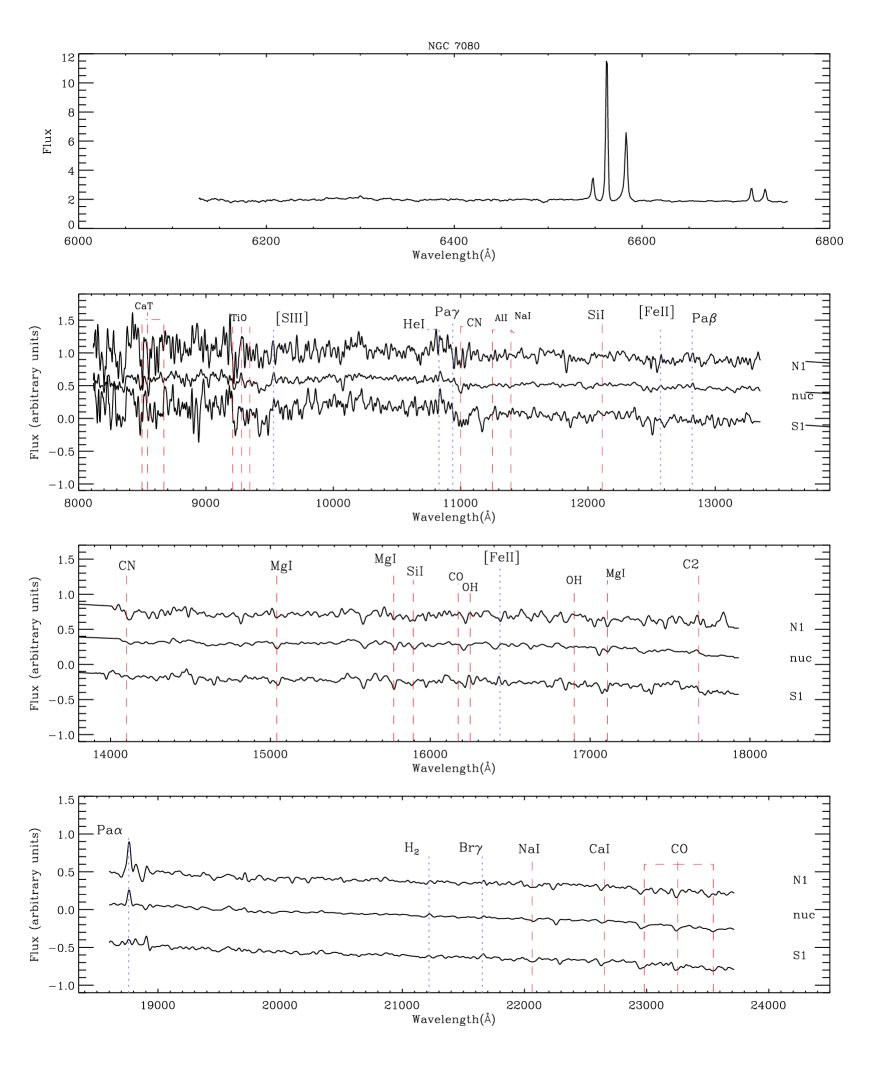
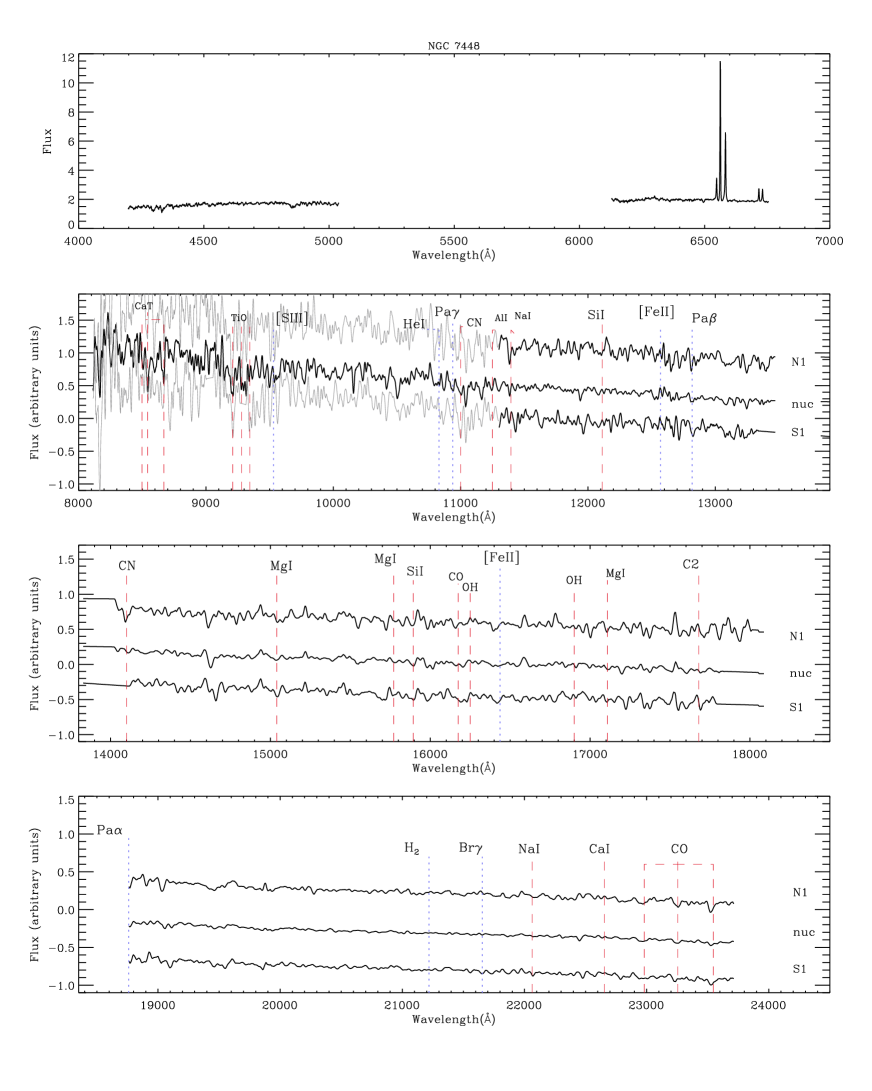
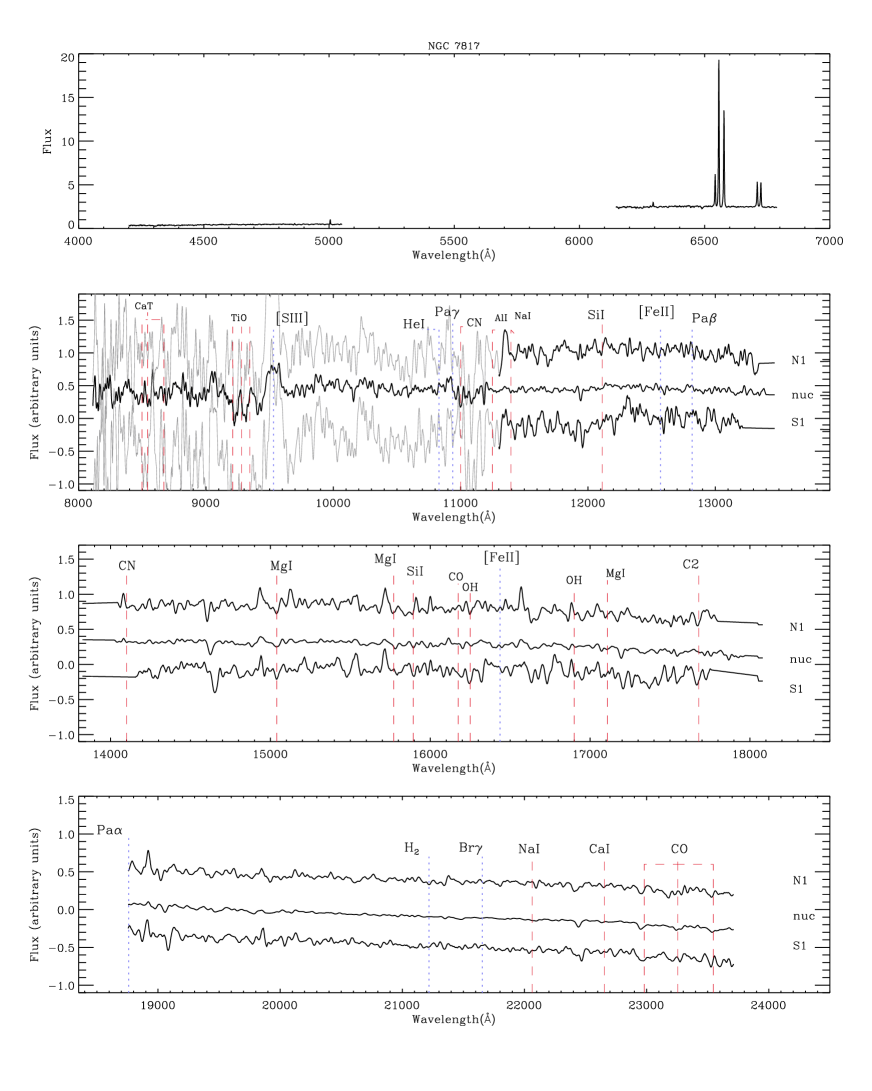
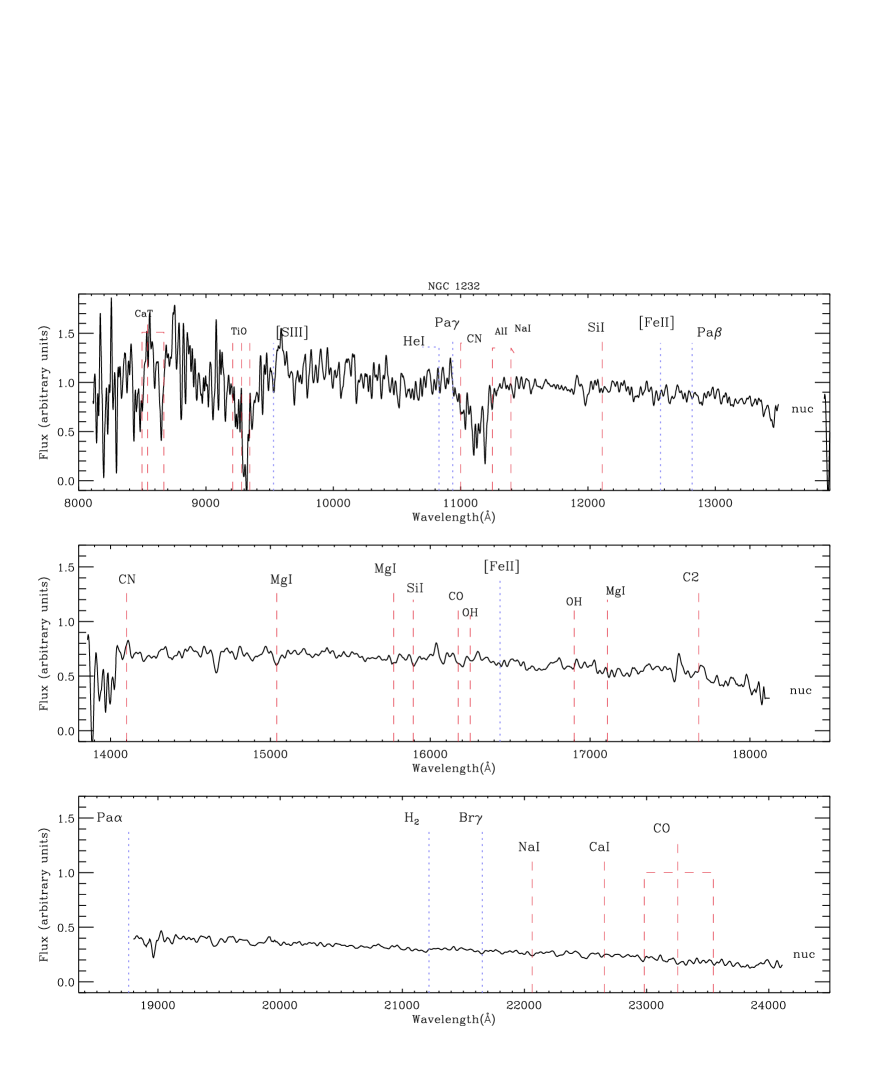
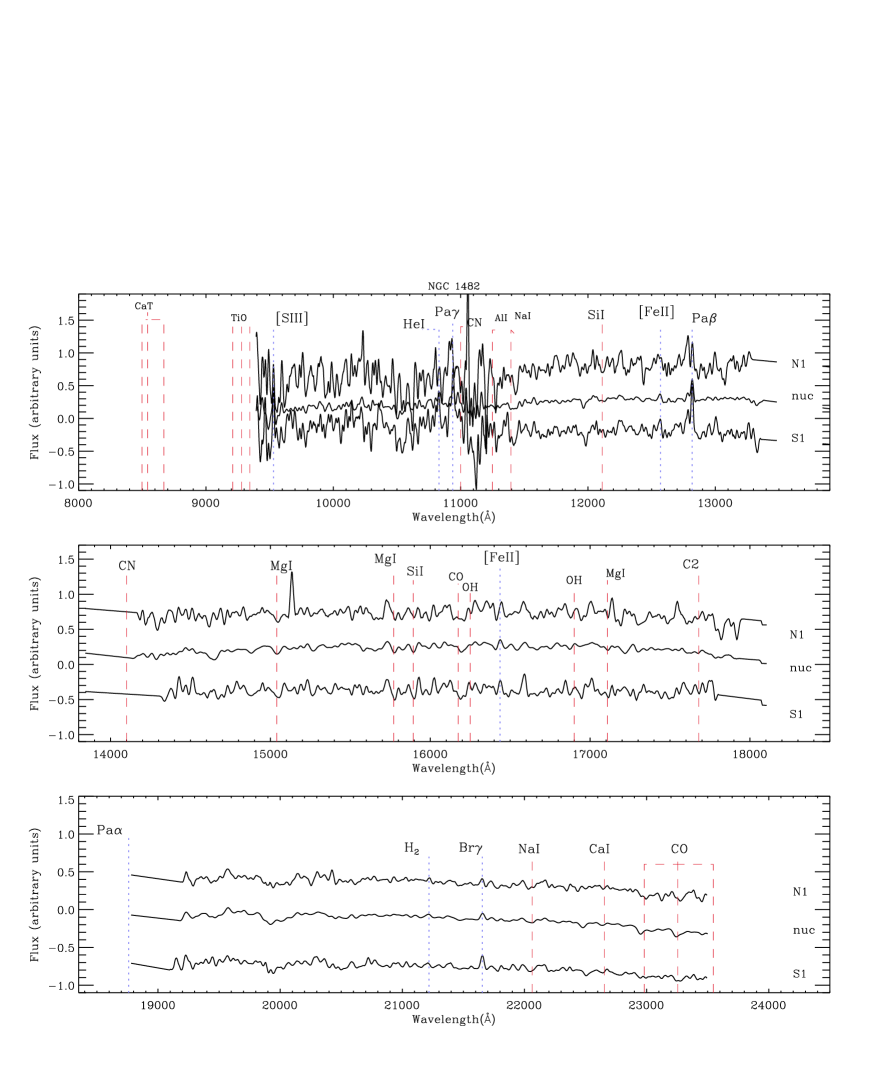
The final reduced NIR spectra for all the galaxies are presented in the appendix, together with the optical spectra observed by HO95 for comparison. Note that for some extractions, the region between 0.8–1m is not shown. This is because of the very small S/N blueward of 1m. Sometimes, if the S/N was small but it was still possible to detect the shape of the continuum emission, the region blueward of 1m was painted in light colour to ease the visualisation of the spectra. In these figures the apertures are marked on the right side of each spectra. Apertures denoted by ”N” are extracted to the north of the nucleus and the ones marked with ”S” are to the south of the nucleus. The numbers following the letters ”N” or ”S” increase with the distance to the centre.
A simple visual inspection of the NIR galaxy spectra reveals a large diversity in terms of both continuum shapes and strength of the emission and absorption lines/bands. Conspicuous emission features that appear most frequently in the objects are [S iii] 0.953, He i 1.083, Pa, [Fe ii] 1.257, Pa, H2 2.121m and Br. Pa was not measured for many galaxies because it falls partially or totally in the gap between the - and -bands. Note also that some H ii/starburst spectra lack of emission lines. This diversity strongly contrasts to what is seen in the optical region: all H ii/star-forming galaxies in the HO95’s catalogue show a similar continuum shape and strong to moderate emission lines (see discussion in section 5).
It is easy to see that all galaxy spectra are dominated by stellar absorption lines/bands, from the very blue to the red end of the observed spectral region. CaT at 0.85 and CN at 1.1, very prominent in most sources, as well as Si i, Mg i, Na i, Ca i and CO, are the most common features observed. All of them are marked in the plots. Note that these absorption lines are also detected in normal galaxies but their strength seems to differ between the later and the former. We also found evidence of absorption features/bands not previously reported in extragalactic sources. An analysis of all the spectral characteristics is made in Sections 3 and 6.
The observed continuum emission is also found to vary considerably from source to source. It can be seen, for instance, that there are objects dominated by a very steep continuum (NGC 7448, for example), with the flux continuously increasing with decreasing wavelength. Other galaxies display a continuum emission that rises steeply with increasing wavelength up to , then the continuum gets flatter in the -band, and finally, it decreases steeply with wavelength in the -band. NGC 6946 in an example of that category. This issue will be explored in more detail in Sect. 6.
Some of the most important signatures predicted for a stellar population dominated by TP-AGBs (Maraston, 2005) are the CN 1.1 and the CO 2.3. These features can be clearly seen in most of our spectra by a simple visual inspection (for example, for NGC 2339, NGC 2903, NGC 4102 or NGC 6946). CN 1.4 and C2 1.768 , also expected to be strong in TP-AGBs, although more difficult to observe. The former falls in a region of very poor atmospheric transmission, between the and the bands and rarely any information falling in this region can be recovered after division by the telluric star. In only one galaxy of our sample (NGC 4102), we have secure evidence of its detection. This can be seen in Figure 14, at the appendix, where all the bands are marked. This is the first detection of CN 1.4m in an extragalactic object.
Observations of C2 1.768 are possible provided the redshift is small enough. This is because of a gap between the and bands in SpeX, which in laboratory wavelength starts at 1.80m and extends up to 1.88m. C2 have been detected only in NGC 5102 (Miner et al., 2011). In our sample, evidence of C2 1.768 is found in NGC 1232, NGC 1482, NGC 2339, NGC 2950, NGC 4179, NGC 4303, NGC 4845 and NGC 6946 (see Figures in the Appendix). Note, however, that the region around that feature is noisy and with the present data it is not possible to fully warrant its presence.
Another spectral region of interest is the one located between 0.8 and 1. It contains at least four absorption bands in addition to the well-studied CaT system at 0.850, 0.854 and 0.866 m (Garcia-Rissmann et al., 2005; Vega et al., 2009). A visual inspection of the spectra reveals the presence of broad absorption features at 0.82, 0.88, 0.92, and in some objects. These absorptions are rather complex, varying in shape and strength from source to source. No information have been published in the literature on identified bands on that spectral region in galaxies.
Based on the spectral library of cool stars published recently by Rayner et al. (2009, hereafter R09), we identified the absorptions at 0.82, 0.88 and 0.92m as due to TiO. This molecule displays numerous absorption systems in the spectra of late-type stars over the 0.8 1.5 m wavelength range (see, for instance, Figures 7-9, 12, 28-30 of R09). Several TiO band heads starting at 0.82m are listed in their Table 10, which coincides in position to the ones observed in our sample. It also easy to see that these features dramatically change with the spectral type of the star. In addition to TiO, other absorption features attributed to CN and ZrO are also identified by R09 in the spectra of M giant stars and carbon stars. A cross-correlation of some of R09’s stars with our data allow us to confirm that all these features (TiO, CN and ZrO) are indeed present in the galaxy spectra. Figure 1 shows a zoom around the 0.81 m region for the objects where the above features are clearly detected. For comparison, we also include the stellar spectrum that closely matches the observed galaxy continuum in the 0.8-1.12 m region. Note that the agreement is excellent, with most stellar absorptions reproduced by our data.
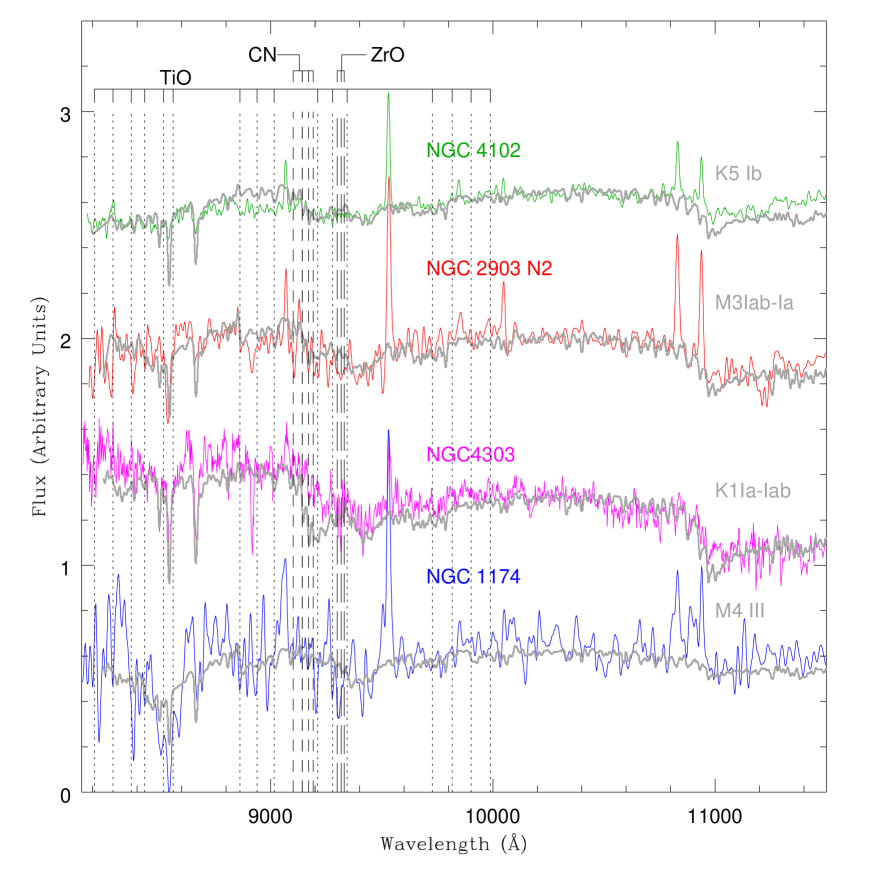
The identification of TiO and ZrO has never been reported before in extragalactic sources. CN 1.1m has been reported (Riffel et al., 2008) but not CN 0.92m. At this point, it is important to note that the stellar spectra reproduced in Figure 1 is only for illustrative purposes and by no means represents the galaxy continua. A stellar population synthesis is necessary in order to carefully model the observed continuum. This is out of the scope of this paper, but will be presented in a following paper (Martins et al. 2013, in preparation). However, it calls the attention that the spectral type of the stars plotted in Figure 1 correspond to giant and super giants of K and M classes. The latter ones, during the AGB evolution, give origin to the CN features and are crucial to model the stellar population in the NIR.
In order to quantify the above characteristics we followed Riffel et al. (2009) and compute the absorption features’ equivalent widths, W, measured according to the definitions of Riffel et al. (2008). This process involves the definition of a central bandpass covering the spectral feature of interest, and two other bandpasses at the red and blue sides which are used to trace a local continuum level through a linear fit to the mean values in both bands. The corresponding value of each equivalent width with the relative errors for all galaxies of the sample (nuclear and off-nuclear apertures) are presented in Table 3. The dashes in the table are due to the fact that for a few objects we were not able to measure one or more values because of the absence of the absorption/emission lines or a low signal-to-noise ratio. Only one of these galaxies was found in previous studies of the same wavelength region, NGC 4179 in Kotilainen et al. (2012), which is one of the normal galaxies of our sample. Our index measurements are in general agreement with theirs (our bandpasses are a little bigger, so our indexes are a little larger).
We found no correlation between these indexes and the W(Gband) measured from the optical. This is an indication that we might be looking at different stellar populations in the optical and in the infrared. We also tried other optical indicators (namely, LHα, WHβ, NII/) but again found no correlation. We also have tried diagrams involving the NIR absorption lines (or bands) but only weak correlations were found. The same result was found by Riffel et al. (2009) for Seyfert galaxies.
| CN | AlI | NaI | SiI | MgI | SiI | CO | ||
|---|---|---|---|---|---|---|---|---|
| Galaxy | Ap | 1.100 | 1.1250 | 1.1395 | 1.2112 | 1.5771 | 1.5894 | 1.6175 |
| NGC 0221 | nuc | 14.610.36 | —— | 1.140.04 | 2.680.08 | 4.160.14 | 2.800.03 | 4.230.45 |
| S1 | 16.210.44 | —— | —— | 2.940.14 | 4.140.18 | 2.460.09 | 4.740.45 | |
| S2 | 11.650.75 | —— | 2.180.10 | 2.810.11 | 4.100.23 | 2.080.09 | 5.290.52 | |
| N1 | 12.960.59 | —— | —— | 3.550.06 | 4.610.13 | 2.450.04 | 5.350.55 | |
| NGC 0278 | nuc | 12.410.43 | —— | —— | 1.580.07 | 5.300.28 | 2.870.13 | 5.360.14 |
| S1 | —— | 2.480.51 | —— | —— | 5.320.36 | 4.450.06 | 8.080.28 | |
| S2 | —— | —— | 1.460.68 | 6.020.32 | 4.840.56 | 2.490.07 | 16.060.25 | |
| N1 | —— | —— | 6.080.68 | 1.720.13 | 8.100.71 | 4.910.06 | 6.150.23 | |
| NGC 0514 | nuc | 3.790.56 | 3.860.37 | 3.340.28 | 3.100.14 | 1.040.34 | 2.930.16 | 5.560.30 |
| S1 | —— | 7.680.44 | —— | 22.290.35 | —— | 12.150.34 | —— 1 | |
| N1 | —— | —— | 9.522.04 | 12.310.23 | —— | —— | 13.622.14 | |
| NGC 0674 | nuc | 23.722.59 | 1.140.18 | 2.030.24 | 4.810.03 | 6.960.45 | 5.390.65 | 2.180.44 |
| N1 | —— | 10.501.26 | —— | 11.480.30 | 9.540.82 | 9.201.10 | 5.080.67 | |
| S1 | —— | —— | —— | 14.620.22 | 1.610.87 | 6.130.57 | —— | |
| NGC 0783 | nuc | 31.280.47 | —— | 2.370.03 | —— | 7.280.34 | 3.530.05 | 4.780.56 |
| S1 | 10.093.72 | 1.230.15 | —— | —— | 13.330.15 | 2.220.10 | 4.971.45 | |
| N1 | —— | —— | 2.930.84 | 1.860.22 | 9.620.90 | —— | 16.410.39 | |
| NGC 0864 | nuc | 13.581.51 | —— | 5.670.34 | —— | 4.970.24 | 1.800.02 | 6.650.05 |
| S1 | —— | —— | 17.020.93 | —— | 5.060.56 | —— | —— | |
| N1 | —— | —— | —— | —— | 13.240.69 | 14.760.92 | —— 1 | |
| NGC 1174 | nuc | —— | —— | 2.060.14 | 5.160.12 | 4.830.53 | 1.890.06 | 7.400.58 |
| S1 | —— | —— | 5.950.93 | 23.250.19 | 6.860.56 | 9.110.22 | 8.690.47 | |
| N1 | —— | —— | —— | 29.570.30 | 17.851.00 | 3.921.46 | —— | |
| NGC 1232 | nuc | 62.143.22 | 2.910.79 | 6.310.48 | 4.190.09 | —— | 1.650.02 | 8.090.56 |
| NGC 1482 | nuc | 18.581.50 | —— | 5.730.30 | 1.150.06 | 3.870.71 | 2.860.06 | 5.490.21 |
| S1 | 11.782.87 | —— | 15.231.22 | —— | 7.131.33 | 4.690.84 | 13.420.18 | |
| N1 | —— | —— | 16.041.50 | 3.660.51 | —— | —— | 16.461.10 | |
| NGC 2339 | nuc | 18.440.48 | 1.440.11 | 1.290.13 | 3.600.13 | 2.790.07 | 3.140.01 | 4.890.34 |
| S1 | —— | 1.380.24 | 1.360.35 | 12.370.11 | 3.370.26 | 3.300.06 | 6.690.52 | |
| N1 | —— | —— | —— | —— | 2.700.61 | 4.430.05 | 6.230.19 | |
| NGC 2342 | nuc | 39.161.03 | —— | 2.760.10 | —— | 6.360.11 | 3.440.01 | 5.690.43 |
| NGC 2903 | nuc | 17.760.25 | 2.490.28 | —— | 2.740.04 | 3.350.10 | 3.090.02 | 5.940.50 |
| S1 | 13.801.00 | —— | —— | 3.480.02 | 3.130.15 | 2.840.14 | 5.230.70 | |
| S2 | 17.280.42 | 3.070.59 | 1.170.12 | 1.720.11 | 3.250.16 | 2.310.02 | 6.190.63 | |
| S3 | 16.150.91 | 1.330.52 | —— | —— | —— | 2.640.03 | 4.270.65 | |
| N1 | 12.200.27 | 3.080.48 | 1.340.07 | 1.630.04 | 4.670.02 | 2.980.01 | 6.100.53 | |
| N2 | 18.920.25 | 1.920.29 | 3.320.05 | 2.450.06 | 3.490.06 | 3.300.02 | 8.620.61 | |
| N3 | 29.850.38 | 4.201.09 | —— | 1.280.14 | 2.600.10 | 1.770.08 | 6.560.81 | |
| N4 | 19.661.71 | 4.360.62 | —— | 5.330.10 | 5.160.20 | 2.720.09 | 10.311.30 | |
| NGC 2950 | nuc | 18.630.69 | —— | 2.810.10 | 3.010.05 | 4.820.18 | 2.900.02 | 6.810.39 |
| S1 | 17.380.42 | —— | 3.360.22 | 4.000.08 | 2.880.26 | 2.540.07 | 8.280.32 | |
| S2 | 8.401.71 | —— | 2.820.29 | 2.080.04 | 3.720.20 | 1.890.02 | 6.650.47 | |
| N1 | 22.271.18 | —— | 2.670.21 | 2.710.05 | 4.680.31 | 2.640.03 | 6.430.18 | |
| N2 | 10.091.66 | —— | 4.630.64 | 6.000.09 | 4.130.20 | 2.620.02 | 8.340.19 | |
| NGC 2964 | nuc | 29.672.23 | 4.351.01 | —— | 5.960.05 | 7.680.05 | 2.950.02 | 3.470.38 |
| S1 | —— | 16.101.93 | —— | 3.900.29 | —— | 7.501.11 | 5.941.51 | |
| N1 | —— | —— | —— | 22.060.22 | 3.060.24 | 8.280.12 | 9.671.78 | |
| NGC 3184 | nuc | —— | 7.250.54 | —— | 4.590.26 | —— | —— | 7.560.93 |
| S1 | —— | 9.670.97 | —— | 8.810.66 | —— | 3.820.39 | 12.001.45 | |
| N1 | —— | 24.555.12 | —— | 7.540.46 | —— | —— | 6.260.71 | |
| NGC 4102 | nuc | 23.200.90 | —— | —— | 2.580.14 | 1.050.14 | 2.320.03 | 5.980.54 |
| S1 | 21.650.47 | —— | 1.050.44 | 2.310.03 | 5.270.08 | 2.500.05 | 4.970.33 | |
| N1 | 15.760.96 | —— | 2.130.30 | 2.510.08 | 6.920.09 | 1.610.07 | 7.460.20 | |
| NGC 4179 | nuc | 28.840.94 | —— | 2.080.15 | 3.290.14 | 3.970.32 | 2.630.03 | 5.290.25 |
| S1 | 8.201.00 | —— | 2.480.30 | —— | 6.030.21 | 1.840.10 | 7.740.70 | |
| N1 | 42.991.03 | 4.581.48 | —— | 2.330.14 | 1.640.45 | 1.610.04 | 6.170.03 | |
| NGC 4303 | nuc | 11.780.95 | —— | 2.740.08 | 1.680.06 | 4.400.29 | 3.020.03 | 6.360.19 |
| S1 | 10.740.54 | —— | 3.160.22 | 2.240.09 | 1.680.15 | 3.340.04 | 6.020.55 | |
| S2 | 9.710.30 | —— | 3.640.40 | 2.970.21 | —— | 1.950.03 | 6.380.51 | |
| S3 | —— | —— | 3.930.61 | 2.060.09 | —— | 2.740.44 | 9.540.77 | |
| N1 | 18.880.51 | —— | 3.510.25 | —— | 3.000.22 | 3.820.07 | 5.370.29 | |
| N2 | 19.671.85 | —— | 3.530.35 | 4.930.13 | —— | 3.490.04 | 9.870.35 | |
| N3 | —— | —— | 13.051.38 | 7.080.40 | —— | —— | 11.470.89 | |
| NGC 4461 | nuc | 7.851.78 | —— | 2.410.14 | —— | 6.790.58 | 6.430.05 | 4.070.02 |
| N1 | —— | —— | 9.280.53 | —— | 3.620.28 | 5.760.03 | 4.110.11 | |
| S1 | —— | —— | 1.930.72 | 7.930.67 | 5.910.46 | 6.340.50 | 2.080.55 | |
| NGC 4845 | nuc | 16.401.10 | —— | 2.870.21 | 4.800.08 | 6.160.26 | 3.380.02 | 5.050.16 |
| S1 | 12.840.97 | —— | 5.080.39 | 4.730.17 | 4.830.28 | 3.020.29 | 4.550.37 | |
| S2 | —— | —— | 7.000.85 | 3.080.43 | 3.790.27 | 2.240.24 | 7.080.24 | |
| S3 | —— | —— | 5.730.82 | —— | —— | —— | 12.880.45 | |
| N1 | 17.651.53 | 1.330.39 | —— | 1.530.03 | 6.620.25 | 2.660.02 | 5.830.29 | |
| N2 | —— | —— | 1.430.21 | 8.770.07 | 6.070.39 | 1.860.18 | 8.950.40 | |
| N3 | —— | —— | 13.801.26 | 9.720.47 | 6.070.96 | —— | 12.311.10 | |
| NGC 5457 | nuc | —— | 12.521.13 | —— | 8.290.14 | 2.330.06 | 2.370.06 | 4.150.02 |
| S1 | —— | 18.982.52 | —— | 1.970.91 | 6.130.84 | —— | 11.960.02 | |
| N1 | —— | 28.411.48 | 14.970.14 | —— | 9.370.40 | —— | 5.520.76 | |
| NGC 5905 | nuc | —— | —— | 1.650.03 | —— | 6.500.16 | 2.680.02 | 5.650.22 |
| S1 | —— | 1.390.19 | —— | 1.670.09 | 6.150.31 | 3.640.03 | 8.030.43 | |
| N1 | —— | 1.330.25 | 1.480.08 | 2.840.27 | 7.470.30 | 4.900.03 | 3.000.32 | |
| NGC 6181 | nuc | 30.231.24 | 1.730.16 | 2.030.19 | 1.240.14 | 5.690.18 | 3.210.02 | 4.550.32 |
| S1 | 23.570.91 | —— | 1.370.17 | 7.670.32 | 2.700.05 | 4.760.06 | 5.990.61 | |
| N1 | 18.843.00 | 2.600.43 | 5.330.75 | —— | —— | 5.020.04 | 4.720.48 | |
| NGC 6946 | nuc | 19.350.41 | 1.090.11 | —— | 1.020.04 | 5.150.26 | 3.100.03 | 4.990.55 |
| NGC 7080 | nuc | 13.230.51 | —— | —— | —— | 3.560.20 | 2.680.02 | 6.760.24 |
| S1 | 16.332.34 | —— | —— | —— | 6.190.48 | 2.500.07 | 9.130.68 | |
| N1 | 10.382.66 | —— | 3.780.23 | —— | 7.160.09 | 4.350.02 | 6.380.25 | |
| NGC 7448 | nuc | 50.531.89 | —— | 4.940.47 | 4.210.21 | 2.830.30 | 4.570.03 | 3.210.22 |
| S1 | —— | —— | 5.110.65 | 5.620.17 | —— | 3.440.40 | 12.820.52 | |
| N1 | —— | —— | 11.270.89 | —— | —— | 3.210.93 | 5.180.37 | |
| NGC 7798 | nuc | 17.710.37 | —— | —— | 2.200.01 | 3.970.05 | 4.490.02 | 5.500.33 |
| S1 | —— | —— | 3.330.76 | —— | 3.720.11 | 1.300.16 | 5.130.19 | |
| N1 | —— | —— | —— | 12.610.30 | —— | 1.930.13 | 7.780.68 | |
| NGC 7817 | nuc | 21.320.67 | —— | 4.650.49 | —— | 5.610.31 | 1.760.03 | 5.690.32 |
| S1 | —— | —— | 15.091.62 | —— | 14.021.21 | 3.310.23 | 4.870.11 | |
| N1 | —— | —— | 16.031.74 | —— | 12.911.66 | —— | —— |
| NaI | CaI | CO1 | CO2 | CO3 | ||
|---|---|---|---|---|---|---|
| Galaxy | Ap | 2.2063 | 2.2655 | 2.2980 | 2.3255 | 2.3545 |
| NGC 0221 | nuc | 4.550.14 | 7.430.01 | 14.700.20 | 9.580.28 | 17.230.22 |
| S1 | 5.430.28 | 6.180.19 | 14.560.32 | 9.490.44 | 16.600.26 | |
| S2 | 6.630.41 | 11.282.18 | 13.491.07 | 12.720.33 | 19.380.18 | |
| N1 | 6.150.26 | 5.600.28 | 13.940.21 | 8.950.31 | 17.980.19 | |
| NGC 0278 | nuc | 6.020.02 | —— | 19.520.53 | 3.040.37 | 13.810.66 |
| S1 | —— | 7.561.61 | 18.921.78 | 6.881.48 | 24.161.16 | |
| S2 | 16.370.15 | 3.954.38 | 32.125.13 | —— | 43.841.60 | |
| N1 | —— | —— | 41.930.47 | 17.980.46 | 8.450.88 | |
| NGC 0514 | nuc | 8.340.38 | 9.110.48 | 15.951.42 | —— | 29.091.65 |
| S1 | —— | 26.531.70 | 18.827.64 | —— | —— | |
| N1 | 13.140.11 | 18.230.47 | —— | —— | 20.798.60 | |
| NGC 0674 | nuc | 4.800.29 | 7.450.50 | 11.440.57 | 14.130.53 | 24.690.30 |
| N1 | —— | 16.932.28 | 6.881.29 | 25.742.12 | 12.864.84 | |
| S1 | —— | 17.980.71 | —— | 29.960.61 | 63.330.14 | |
| NGC 0783 | nuc | 6.830.12 | 2.840.49 | 18.130.26 | 10.430.34 | 25.250.26 |
| S1 | 4.470.92 | 1.050.66 | —— | 36.430.14 | 51.630.04 | |
| N1 | 11.880.75 | —— | 5.442.45 | 16.513.17 | 15.926.41 | |
| NGC 0864 | nuc | 8.050.19 | 4.330.57 | 19.860.38 | 9.510.40 | 7.780.78 |
| S1 | —— | 12.510.84 | 22.583.07 | 27.860.45 | —— | |
| N1 | 2.581.92 | —— | —— | —— | —— | |
| NGC 1174 | nuc | 3.970.12 | —— | 17.540.10 | 9.890.14 | 16.470.37 |
| S1 | 3.020.98 | —— | 16.912.15 | —— | 9.604.15 | |
| N1 | 5.550.42 | —— | 47.831.82 | 33.421.28 | 49.510.27 | |
| NGC 1232 | nuc | 9.380.45 | —— | —— | 6.490.30 | 7.180.44 |
| NGC 1482 | nuc | 6.930.17 | —— | 19.650.10 | 13.700.08 | 20.200.60 |
| S1 | 2.381.34 | —— | 14.590.74 | 10.951.19 | 10.582.32 | |
| N1 | 9.180.67 | —— | 13.071.06 | 6.131.49 | 18.472.51 | |
| NGC 2339 | nuc | 5.680.14 | 1.500.66 | 20.150.08 | 14.490.05 | 20.100.31 |
| S1 | —— | —— | 24.120.48 | 14.660.78 | 14.151.30 | |
| N1 | —— | 12.061.30 | 13.901.17 | 16.500.43 | —— | |
| NGC 2342 | nuc | 3.990.05 | 3.380.25 | 19.500.61 | 6.720.62 | 16.170.47 |
| NGC 2903 | nuc | 4.680.35 | 1.620.23 | 17.780.03 | 8.170.04 | 15.470.27 |
| S1 | 4.310.33 | 3.270.16 | 18.090.23 | 10.290.20 | 17.900.65 | |
| S2 | 2.480.26 | 9.400.10 | 20.680.10 | 9.950.03 | 23.540.28 | |
| S3 | —— | 5.570.10 | 22.500.54 | 9.720.67 | 14.180.82 | |
| N1 | 1.640.31 | 4.770.02 | 16.360.03 | 8.030.05 | 18.640.37 | |
| N2 | 4.670.51 | 2.830.43 | 21.480.08 | 8.850.25 | 15.600.59 | |
| N3 | 2.670.58 | —— | 17.160.25 | 11.860.14 | 16.580.78 | |
| N4 | 5.020.84 | 5.420.29 | 20.890.23 | 10.420.17 | 23.030.52 | |
| NGC 2950 | nuc | 7.330.20 | —— | 19.470.28 | 10.120.12 | 18.510.35 |
| S1 | 5.480.02 | 3.240.08 | 18.060.33 | 9.180.37 | 20.880.44 | |
| S2 | 5.050.04 | 8.060.50 | 12.150.62 | 8.000.85 | 17.051.61 | |
| N1 | 6.040.17 | 1.920.16 | 18.300.32 | 10.620.35 | 19.020.65 | |
| N2 | 3.920.56 | —— | 11.800.58 | —— | 20.000.66 | |
| NGC 2964 | nuc | 6.430.13 | —— | 13.860.76 | 11.410.64 | —— |
| S1 | 16.230.32 | 22.131.13 | 3.422.71 | 29.082.12 | —— | |
| N1 | 13.400.75 | 11.440.17 | —— | 5.643.46 | —— | |
| NGC 3184 | nuc | 8.060.12 | 2.610.75 | 18.361.23 | 5.531.61 | 23.622.10 |
| S1 | 4.940.98 | 2.250.04 | 32.360.16 | 7.940.88 | 24.453.66 | |
| N1 | —— | 8.061.43 | —— | —— | —— | |
| NGC 4102 | nuc | 6.290.13 | 3.340.09 | 26.840.13 | 11.650.30 | 16.350.46 |
| S1 | 7.880.03 | 3.370.33 | 24.880.19 | 9.680.15 | 15.930.57 | |
| N1 | 8.220.18 | —— | 21.160.13 | 8.110.30 | 13.220.58 | |
| NGC 4179 | nuc | 9.380.07 | 6.530.14 | 15.190.32 | 10.390.45 | 21.580.10 |
| S1 | 14.220.08 | 6.080.38 | 4.151.46 | 4.791.02 | 10.351.82 | |
| N1 | 6.200.02 | —— | 9.850.74 | —— | 21.732.15 | |
| NGC 4303 | nuc | 7.300.09 | —— | 17.990.19 | 10.480.22 | 17.930.32 |
| S1 | 7.870.04 | 2.390.17 | 22.410.57 | 11.310.10 | 17.370.11 | |
| S2 | 4.950.08 | 2.050.22 | 17.580.31 | 15.390.14 | 18.181.01 | |
| S3 | 6.830.33 | —— | 26.080.75 | 15.400.59 | 13.340.26 | |
| N1 | 5.230.10 | 2.630.08 | 17.500.29 | 9.180.44 | 15.250.21 | |
| N2 | 7.920.23 | 4.270.19 | 24.190.32 | 13.610.48 | 15.270.60 | |
| N3 | 5.040.09 | —— | 29.010.96 | 20.591.40 | 30.071.46 | |
| NGC 4461 | nuc | 3.610.28 | 7.720.62 | 13.270.44 | 14.980.55 | 6.770.44 |
| N1 | 6.910.55 | 7.110.31 | 22.201.36 | 33.500.28 | 19.600.45 | |
| S1 | 2.670.03 | 8.400.70 | 12.450.80 | 20.961.23 | 14.052.67 | |
| NGC 4845 | nuc | 8.440.08 | 2.530.10 | 23.390.18 | 13.080.11 | 19.430.19 |
| S1 | 6.970.08 | 3.380.30 | 19.850.15 | 11.840.52 | 20.720.92 | |
| S2 | 3.820.21 | 5.090.14 | 25.630.17 | 12.290.61 | 14.261.14 | |
| S3 | 12.350.41 | —— | 43.580.41 | 14.141.03 | —— | |
| N1 | 6.090.16 | 1.820.38 | 24.520.45 | 16.190.20 | 22.260.26 | |
| N2 | 9.180.19 | 5.880.36 | 23.740.10 | 13.820.02 | 19.690.01 | |
| N3 | 5.720.54 | 4.801.55 | 30.380.95 | 27.961.18 | 26.993.27 | |
| NGC 5457 | nuc | 1.200.26 | 5.660.29 | 12.081.03 | 15.230.81 | 27.621.51 |
| S1 | —— | 12.880.62 | 38.760.45 | 28.880.26 | 4.642.18 | |
| N1 | 15.991.87 | 14.231.04 | 24.211.87 | 55.101.06 | 46.122.49 | |
| NGC 5905 | nuc | 4.690.17 | 1.250.09 | 17.490.18 | 12.200.26 | 22.690.42 |
| S1 | 8.310.14 | 4.570.48 | 4.930.92 | 8.980.88 | 33.171.46 | |
| N1 | 8.340.15 | 2.030.09 | 7.140.48 | 10.240.66 | 20.280.15 | |
| NGC 6181 | nuc | 4.920.39 | 2.180.31 | 13.560.25 | 13.720.04 | 20.000.01 |
| S1 | 14.040.81 | —— | 3.051.06 | 16.871.24 | 26.620.30 | |
| N1 | 11.881.18 | 2.511.82 | 17.211.66 | 23.661.48 | 28.331.98 | |
| NGC 6946 | nuc | 5.610.06 | 4.150.08 | 21.820.12 | 10.480.05 | 17.430.40 |
| NGC 7080 | nuc | 6.600.30 | 2.180.34 | 19.020.14 | 5.750.28 | 11.120.45 |
| S1 | 3.260.41 | 10.360.96 | 18.500.84 | 9.021.06 | 8.100.56 | |
| N1 | 13.710.89 | 3.960.60 | 19.050.71 | —— | 14.951.46 | |
| NGC 7448 | nuc | 3.120.68 | —— | 4.801.03 | 13.201.08 | 17.251.86 |
| S1 | 2.640.55 | —— | 13.934.05 | 20.271.77 | 14.442.34 | |
| N1 | —— | 9.011.52 | 2.772.69 | 23.011.88 | 14.360.48 | |
| NGC 7798 | nuc | 4.590.22 | —— | 22.350.48 | 10.440.11 | 23.270.48 |
| S1 | 4.520.71 | —— | 21.313.17 | 15.310.61 | 58.541.48 | |
| N1 | 6.751.10 | 3.352.69 | 21.825.36 | 29.240.74 | 39.991.18 | |
| NGC 7817 | nuc | 7.710.19 | —— | 10.150.65 | 9.340.82 | 23.200.32 |
| S1 | —— | —— | 19.861.61 | —— | 5.922.30 | |
| N1 | 2.000.73 | —— | —— | —— | 31.761.28 |
4 Emission Lines
The spectra of all the galaxies presented in this work are shaped by their stellar populations, as can be inferred by the numerous stellar absorption features present along the 0.8-2.4m region. However, besides the stellar features, these galaxies are classified as H ii/star-forming based on their emission lines properties in the optical. The NIR spectra is not much different. Most sources of our sample display nebular lines of weak to moderate intensity, the most common being H i (Brackett and Pashen series), He i 1.083, [Fe ii] 1.257, [S iii] 0.953 and H2 2.121. As expected, the spectra of normal galaxies completely lack of such lines. In this section we will set up additional constraints on the gas properties of these objects based on the study of these lines.
In order to properly measure these emission lines, it is usually necessary to subtract the stellar continuum. This can be done by fitting the underlying continuum using stellar population synthesis, as it was done by Riffel et al. (2009) and Martins et al. (2010) for Seyfert galaxies.
Maraston (2005)’s models are the only ones available so far that include the effect of the TP-AGB phase, crucial to model the stellar population in the NIR, and that have different metallicities. However, these models are characterised by their very low spectral resolution at NIR wavelengths (R=100). This contrasts with the moderate spectral resolution of the data (R920). Because of this difference, in order to perform the stellar population synthesis, it is necessary to downgrade the spectral resolution of the observations to match that of the models. As a result, the final subtracted spectra (observations minus the final stellar template) will enhance the line fluxes of those features very close to or within the absorption lines, but the weak lines may disappear in the process.
In order to evaluate how much the stellar population subtraction and loss of spectral resolution affects the line flux measurements, we performed the stellar population synthesis (results will be presented in an upcoming paper, Martins et al. 2013) and we measured the emission line fluxes in both spectra: the low resolution ones, with the stellar population subtracted, and the original spectra, without subtraction of the stellar population. Figure 2 shows the comparison for four of the most common lines - Pa, Br, [S iii] 0.953 and H2 2.121. The black line shows the one to one correspondence. It can be seen that the subtraction of the stellar population does significantly affects the measured fluxes relative to those before subtraction. One possible exception is Pa. The underlying stellar population has a stronger effect on the hydrogen lines. The effect is also larger for higher fluxes. The largest differences in fluxes are about 25, which is around the largest errors measured for the lines also. Taking this into account we decided to list the emission lines from the spectra with no stellar population subtraction, for which we could measure more lines. We advise the reader interested in line ratios to be cautious and remember to take this possible effect into account. The emission line flux measurements are presented in Table LABEL:fluxes.

| [SIII] | [SIII] | Pa | HeI | Pa | [FeII] | Pa | [FeII] | Pa | H2 | H2 | Br | ||
|---|---|---|---|---|---|---|---|---|---|---|---|---|---|
| Galaxy | Ap | 0.907 | 0.953 | 1.005 | 1.083 | 1.093 | 1.257 | 1.282 | 1.646 | 1.870 | 1.957 | 2.121 | 2.166 |
| NGC 783 | S1 | —— | —— | —— | —— | —— | 0.45 0.11 | —— | —— | 2.08 0.11 | —— | 0.22 0.07 | —— |
| NGC 783 | N1 | —— | —— | —— | —— | —— | —— | 0.72 0.10 | 0.43 0.09 | 2.98 0.18 | —— | 0.15 0.05 | —— |
| NGC 783 | nuc | —— | —— | —— | —— | —— | 0.74 0.13 | —— | —— | 2.11 0.19 | —— | —— | —— |
| NGC 0864 | S1 | —— | 4.79 0.29 | —— | —— | 2.84 0.68 | —— | 2.13 0.17 | 0.48 0.05 | —— | —— | 0.49 0.05 | 0.35 0.05 |
| NGC 0864 | N1 | —— | 4.68 0.52 | —— | —— | —— | —— | —— | —— | —— | —— | —— | —— |
| NGC 0864 | nuc | 7.97 1.31 | 18.70 1.37 | 2.45 0.58 | 5.53 0.65 | 4.67 0.73 | 2.09 0.32 | 6.94 0.60 | 2.38 0.41 | —— | —— | 0.70 0.13 | 1.50 0.16 |
| NGC 1174 | nuc | 10.06 1.35 | 14.48 0.76 | —— | 8.52 0.98 | 4.66 1.39 | 4.15 0.20 | 8.92 0.27 | 2.67 0.46 | 29.57 1.21 | —— | 1.14 0.11 | 3.01 0.08 |
| NGC 1482 | S1 | —— | —— | —— | —— | 77.99 9.64 | 15.43 2.87 | 43.60 8.74 | —— | —— | —— | —— | 15.75 1.03 |
| NGC 1482 | N1 | —— | —— | —— | —— | —— | —— | 15.73 1.73 | —— | —— | —— | —— | —— |
| NGC 1482 | nuc | —— | —— | —— | 52.14 3.84 | 74.76 10.39 | 17.42 1.79 | 61.60 8.21 | 19.11 3.35 | —— | —— | 11.27 2.28 | 25.03 1.75 |
| NGC 2339 | S1 | —— | —— | —— | —— | 2.86 0.37 | 1.91 0.30 | 2.05 0.51 | 1.77 0.12 | 4.61 0.22 | 1.81 0.30 | 0.88 0.05 | 0.89 0.12 |
| NGC 2339 | N1 | —— | —— | 2.66 0.42 | —— | —— | —— | 3.12 0.41 | 1.39 0.22 | 11.57 0.40 | 1.06 0.10 | 1.07 0.09 | 1.22 0.12 |
| NGC 2339 | nuc | 6.35 2.13 | 14.99 1.76 | —— | 18.13 2.23 | 5.46 1.84 | 10.30 0.79 | 18.14 0.73 | 9.64 1.30 | 68.89 3.30 | 6.40 0.80 | 5.43 0.71 | 7.36 0.55 |
| NGC 2342 | nuc | 7.81 6.65 | 19.42 0.75 | —— | 8.73 0.38 | 6.07 0.43 | 5.48 0.24 | 11.22 0.36 | 6.03 0.36 | 57.37 2.13 | 3.19 0.80 | 1.97 0.18 | 3.71 0.17 |
| NGC 2903 | S1 | —— | 5.07 0.57 | —— | 1.44 0.32 | 1.83 0.22 | 1.70 0.14 | 2.27 0.28 | 1.25 0.26 | —— | —— | 0.74 0.13 | 0.86 0.04 |
| NGC 2903 | S2 | 3.81 0.47 | 6.84 0.85 | 0.95 0.14 | 6.25 0.54 | 3.99 0.68 | 3.25 0.35 | 7.56 0.46 | 2.30 0.43 | —— | —— | 1.06 0.25 | 1.60 0.27 |
| NGC 2903 | S3 | —— | 1.05 0.21 | —— | 2.07 0.42 | 0.72 0.25 | 1.40 0.16 | 1.53 0.24 | —— | —— | —— | 0.27 0.05 | 0.22 0.09 |
| NGC 2903 | N1 | —— | 5.38 1.00 | —— | 4.91 0.68 | 7.60 1.60 | 1.80 0.32 | 3.72 0.33 | —— | —— | 1.81 0.25 | 0.93 0.14 | 0.83 0.62 |
| NGC 2903 | N2 | 7.48 1.01 | 9.52 0.82 | 1.81 0.16 | 7.95 0.64 | 6.02 0.61 | 3.53 0.28 | 9.49 0.62 | 3.82 0.75 | 9.40 0.61 | —— | 1.73 0.17 | 2.25 0.13 |
| NGC 2903 | N3 | 4.52 0.58 | 11.35 0.67 | 2.77 0.53 | 8.61 5.94 | 6.87 0.63 | 4.07 0.29 | 15.10 0.48 | 3.99 0.41 | —— | —— | 1.75 0.09 | 4.92 0.07 |
| NGC 2903 | N4 | —— | 3.28 0.51 | 1.01 0.31 | 3.37 0.32 | 2.13 0.44 | 1.26 0.23 | 4.48 0.30 | —— | —— | —— | 0.62 0.08 | 1.09 0.12 |
| NGC 2903 | nuc | —— | 3.36 0.58 | —— | —— | —— | 2.67 0.33 | 2.32 0.43 | —— | —— | 3.72 0.37 | 1.37 0.38 | 0.76 0.38 |
| NGC 2964 | S1 | —— | 28.89 3.33 | —— | —— | —— | —— | —— | —— | —— | —— | —— | —— |
| NGC 2964 | nuc | 22.65 0.68 | 49.64 7.46 | —— | 55.65 8.40 | 40.72 5.35 | 9.46 1.33 | 19.14 3.19 | —— | —— | 6.89 0.69 | 4.34 0.82 | 6.43 1.03 |
| NGC 3184 | S1 | —— | 2.40 0.31 | —— | —— | —— | —— | 1.45 0.32 | —— | —— | —— | 0.42 0.08 | —— |
| NGC 3184 | N1 | —— | —— | —— | —— | —— | —— | 1.02 0.11 | —— | —— | —— | —— | —— |
| NGC 3184 | nuc | 1.68 0.39 | 6.37 0.59 | —— | 4.38 0.68 | 3.13 0.61 | 0.77 0.11 | 3.83 0.40 | 1.52 0.23 | —— | —— | 0.86 0.09 | 0.75 0.09 |
| NGC 4102 | S1 | 5.54 0.07 | 13.55 0.41 | —— | 11.42 1.20 | 5.95 1.04 | 6.48 0.54 | 9.43 0.38 | 5.35 1.14 | —— | 3.09 0.30 | 2.21 0.36 | 4.49 0.23 |
| NGC 4102 | N1 | 3.86 0.30 | 11.47 0.95 | —— | 6.01 0.54 | 4.78 0.44 | 6.02 0.53 | 8.56 0.78 | —— | —— | 4.29 0.49 | 4.09 0.39 | 3.83 0.49 |
| NGC 4102 | nuc | 18.97 0.73 | 60.06 1.10 | 5.71 0.55 | 27.42 2.12 | 20.63 2.15 | 28.47 1.15 | 44.59 1.84 | 20.84 5.06 | —— | 21.96 1.60 | 11.36 1.45 | 18.50 1.04 |
| NGC 4303 | S1 | —— | 2.53 0.72 | —— | —— | —— | —— | —— | —— | —— | —— | 0.40 0.06 | —— |
| NGC 4303 | S2 | 0.99 0.22 | 4.14 0.59 | —— | 1.19 0.23 | —— | 0.65 0.12 | 0.58 0.12 | —— | —— | —— | —— | —— |
| NGC 4303 | S3 | —— | —— | —— | 1.14 0.15 | —— | —— | —— | —— | —— | 0.53 0.05 | 0.21 0.05 | —— |
| NGC 4303 | N1 | 4.71 0.60 | 2.27 0.53 | —— | —— | —— | 0.74 0.17 | —— | —— | —— | —— | 0.16 0.04 | —— |
| NGC 4303 | N2 | —— | —— | —— | 1.08 0.24 | 0.81 0.10 | 0.80 0.09 | —— | —— | —— | —— | 0.40 0.06 | —— |
| NGC 4303 | N3 | —— | 0.80 0.29 | —— | —— | —— | —— | —— | —— | —— | —— | 0.29 0.04 | —— |
| NGC 4303 | nuc | 5.14 1.06 | 7.88 1.28 | —— | —— | —— | —— | —— | —— | —— | 5.99 1.09 | 1.23 0.21 | —— |
| NGC 4845 | S1 | —— | —— | —— | 2.07 0.49 | —— | —— | —— | —— | —— | 1.52 0.18 | 0.64 0.12 | —— |
| NGC 4845 | S2 | —— | —— | —— | 2.04 0.37 | —— | —— | —— | —— | —— | —— | 0.52 0.06 | —— |
| NGC 4845 | S3 | —— | —— | —— | —— | —— | —— | 1.90 0.25 | —— | —— | —— | 0.77 0.11 | —— |
| NGC 4845 | N1 | —— | —— | —— | —— | —— | —— | —— | —— | —— | —— | 0.70 0.14 | —— |
| NGC 4845 | N2 | —— | —— | —— | 1.07 0.17 | 1.08 0.12 | —— | —— | —— | —— | 0.54 0.11 | —— | —— |
| NGC 4845 | N3 | —— | —— | —— | —— | —— | —— | —— | —— | —— | 0.91 0.18 | —— | —— |
| NGC 4845 | nuc | —— | 16.71 1.30 | —— | 10.47 0.94 | —— | —— | —— | —— | —— | 13.45 1.30 | 3.17 0.63 | —— |
| NGC 5457 | N1 | —— | 9.06 0.60 | —— | —— | —— | —— | 5.24 0.34 | —— | —— | —— | 1.02 0.11 | —— |
| NGC 5457 | nuc | —— | —— | —— | —— | —— | 2.61 0.47 | —— | —— | —— | —— | —— | —— |
| NGC 5905 | S1 | —— | 3.40 0.47 | —— | —— | 1.78 0.21 | —— | 2.57 0.09 | —— | 8.91 0.56 | —— | 0.57 0.07 | 0.48 0.08 |
| NGC 5905 | N1 | —— | 2.37 0.41 | —— | —— | —— | —— | 1.65 0.17 | —— | 6.10 0.32 | —— | —— | 0.54 0.13 |
| NGC 5905 | nuc | —— | 4.36 0.37 | —— | —— | —— | 1.04 0.16 | 1.45 0.24 | —— | 7.94 0.96 | —— | —— | 0.71 0.11 |
| NGC 6946 | nuc | 46.56 8.55 | 84.54 1.78 | —— | 48.62 1.09 | 14.91 1.64 | 51.52 0.83 | 53.87 1.54 | 44.20 5.62 | —— | —— | 13.53 1.83 | 21.21 1.03 |
| NGC 7080 | S1 | —— | —— | —— | 1.83 0.44 | —— | —— | —— | —— | —— | —— | —— | 0.40 0.05 |
| NGC 7080 | N1 | —— | —— | —— | —— | —— | —— | —— | —— | 3.02 0.29 | —— | —— | 0.23 0.04 |
| NGC 7080 | nuc | —— | 3.46 0.30 | —— | 2.91 0.26 | —— | —— | 1.33 0.16 | —— | 5.06 0.29 | 1.94 0.22 | 0.67 0.15 | 0.60 0.18 |
| NGC 7798 | S1 | —— | —— | —— | 1.45 0.13 | —— | —— | —— | —— | 1.11 0.19 | 0.34 0.10 | —— | —— |
| NGC 7798 | nuc | 8.73 0.82 | 7.97 0.99 | —— | 4.98 0.44 | 2.67 0.40 | 3.74 0.24 | 4.78 0.60 | 2.46 0.44 | 15.38 0.46 | 1.89 0.14 | 1.12 0.14 | 2.06 0.18 |
| NGC 7817 | N1 | —— | 18.28 1.87 | —— | —— | —— | —— | —— | —— | —— | —— | —— | —— |
| NGC 7817 | nuc | —— | 22.86 1.54 | —— | —— | —— | —— | —— | —— | —— | —— | —— | —— |
4.1 Extinction
The effects of dust extinction are crucial to understand the spectra of nearby and distant starburst galaxies. In these sources, where active star formation is taking place, dust grains are not only produced and ejected from stars but are also processed in the interstellar medium. Therefore, NIR signatures should be preferred than their optical counterparts in order to penetrate as deep as possible into the dusty starburst cores. When nebular emission is present, the effect of dust opacity is usually removed from the spectra by attributing to dust obscuration any difference between the observed and intrinsic ratio of hydrogen emission lines. A few studies in starburst galaxies found out that the NIR extinction is generally larger than the optical one, suggesting that the dust may be clumped or heavily mixed with the emitting gas (Moorwood & Oliva, 1988; Kawara et al., 1989; Puxley & Brand, 1994).
The trade-off between using optical and NIR H i lines is that the latter are considerably weaker and display smaller differential extinction than the former. Thus, a small uncertainty in the measurement of the NIR lines translates into a large uncertainty in the final extinction value.
Reddening estimates based on NIR H i lines have been determined for many individual H ii/star-forming galaxies. However, few works have studied systematically the effect of extinction using a sample larger than 10 objects (Heisler & De Robertis, 1999). Our sample, free of systematics, may contribute on this subject by determining the extinction not only in the nucleus but also with the distance to the galaxy nucleus along the slit. Note, however, that the lack of emission lines at some locations may, in part, hinder this goal.
The strongest hydrogen lines observed in the sample are Pa and Br. We decided not to use the Pa because, as mentioned before, it falls inside the gap of very poor atmospheric transmission, making the measurement of its flux highly unreliable. Pa and Pa are weaker than Pa and for this reason are not employed. Besides that, the [Fe ii] lines at 1.257 and 1.644 theoretically can be used as a direct measurement of extinction that is independent of electron density and temperature, since they arise from the same upper level. However, the AV values measured from this ratio will be very uncertain because the intrinsic weakness of the iron lines, making the measurement of their emission line flux uncertain. This is specially true for [Fe ii] 1.644 , which is particularly affected because it is located very close to a CO and Brackett10 absorption feature. For the hydrogen lines we assumed case B recombination with an effective temperature of 104 K and electron number density of 104 cm-3. The adopted intrinsic line ratio Pa/Br is 5.89 (Osterbrock, 1989). To estimate the extinction in visual magnitudes for the NIR we used the Calzetti et al. (2000) law, appropriated for actively star-forming regions and starburst. Table 5 shows the AV values calculated from the Pa/Br ratio, and the AV determined by HO97, based on the H/H ratio. Figure 3 shows a comparison between these values.
The comparison of the extinction values derived from the Pa/Br ratio with the ones derived from the H/H ratio (Figure 3) shows that the NIR values tend to be larger than the optical ones. This result agrees to previous works in the literature and reflects the fact that the NIR lines sample an extinction column larger than the optical lines (Heisler & De Robertis, 1999; Moorwood & Oliva, 1988). Other factors may also play a role here. We have assumed case B recombination with the same temperature and density for all the ratios, which could introduce some scatter. Differences in the slit size should also be important. Since HO95’ slit is much larger, the extinction they derived is an average value for the galaxy. However, these values may vary with the distance to the centre, as it can be confirmed from Table 5. For many sources where AV could be measured along the slit, the off-nuclear values are lower than the nuclear ones. If we imagine that the dust tends to be more concentrated in the nuclear regions, smaller apertures would naturally probe higher extinction values, as is our case.

| Galaxy | AV | AVa |
|---|---|---|
| (Pa/Br) | (H/H) | |
| NGC 0864 | 1.19 | 0.68 |
| NGC 1174 | 3.43 | 2.51 |
| NGC 1482 | 4.36 | — |
| NGC 2339 | 4.35 | 4.09 |
| NGC 2342 | 3.33 | 2.17 |
| NGC 2903 | 3.27 | 1.36 |
| NGC 2964 | 3.40 | 2.08 |
| NGC 3184 | 0.74 | 1.36 |
| NGC 4102 | 4.46 | 3.10 |
| NGC 5905 | 5.32 | 1.27 |
| NGC 6946 | 4.20 | 3.60 |
| NGC 7080 | 4.88 | — |
| NGC 7798 | 4.66 | 1.80 |
(a) Obtained from Ho et al. (1997)
4.2 Diagnostic Diagram in the NIR
Rodríguez-Ardila et al. (2004) and Rodríguez-Ardila et al. (2008) suggested that the line ratios H2 2.121/Br and [Fe ii] 1.257/Pa are suitable to separate emission line objects according to their level of activity. Starburst galaxies should be preferentially located in the region with [Fe ii] 1.257/Pa and H2 2.121/Br 0.6, while AGNs would have higher values for both ratios.
Figure 4 shows the flux ratios [Fe ii] 1.257/Pa and H2 2.121/Br for the objects of our sample in which these lines could be measured. Note that because of the proximity in wavelength, both ratios are insensitive to reddening. The largest source of uncertainty here is the flux associated to the H i lines, as it may be suppressed by underlying absorption.
The dotted linen in Figure 4 marks the suggested value for the boundary between AGN and SBs. Although many objects fall inside or very close to this boundary, this figure clearly shows that the values adopted for this separation have to be reviewed. Even if we take into account that the hydrogen lines might be underestimated because of the stellar population contribution that was not subtracted, the overall result should not be significantly altered after correcting for this effect. The most extreme case seems to be the nucleus of NGC 2903. This might be due to the fact that the emission lines are intrinsically weaker in the nuclear region, which makes the measurements of the emission lines more subjected to residual of the telluric lines extraction or residual noises, and therefore, more uncertain. Note here that this result does not contradict the results from Rodríguez-Ardila et al. (2008), where at least the nuclear region of one SBT, as well as some off-nuclear results shows ratios values higher than those limited by 0.6. AGNs would indeed be located in the region with higher values of [Fe ii] 1.257/Pa and H2 2.121/Br, as they showed, and galaxies falling inside the dotted region in Figure 4 are probably starbursts. However, starbursts can also have higher values for these ratios and therefore be located outside the dotted boundary in this figure.

5 Optical properties vs. Near-Infrared properties
HO97 classified the galaxies of our sample as H ii/starburst galaxies based on their optical emission line ratios, that should obey [O i]6300/H 0.08, [N ii]6584/H 0.06 and [S ii]6716,6731/H 0.04. It is then interesting to compare the optical emission line spectrum with that measured in the NIR. This allows us to see, for instance, if evidences of broad permitted H i lines are present in the low-order Brackett or Paschen lines, implying the existence of a buried AGN. It also permits to place upper limits to the location of the starburst component based on the published measures of the H flux. In this discussion, it is important to keep in mind the differences in slit sizes: each of our extractions are typically 0.8, while HO95’s slit is 2. That is, a factor of 5 in the area covered compared to ours.
The figures in the Appendix present the optical spectrum of HO95 (upper panel) and the corresponding NIR apertures extracted for each galaxy (lower panel). It is easy to see that all optical spectra but those of the normal galaxies NGC 221, NGC 2950, NGC 4179 and NGC 4461 display prominent H, [N ii]6584 and [S ii]6716,6731 emission in the optical. In comparison, only a fraction of the sample displays bright emission lines in the NIR. Moreover, no evidence of the presence of broad components in the H i is observed. Although we cannot rule out completely the existence of a hidden AGN based on these pieces of evidence alone, very likely none of the objects of our sample could be classified as an AGN. If hidden AGN does exist, the reddening towards the nucleus would need to be larger than 30 mag. This implies that all the observed emission lines are produced by stellar processes, being it patronisation by a star or a star cluster, or even shocks produced by supernova explosions.
Comparing HO95’s optical spectra with the corresponding NIR allows us to separate the galaxies in 4 main classes, based on the presence and strength of their emission lines:
-
•
Weak emission lines in the optical, no emission lines in the NIR, either at the nucleus or in the extended region (class 1): NGC 514, NGC 674, NGC 6181, NGC 7448.
-
•
Strong emission lines in the optical, no emission lines in the NIR, either at the nucleus or in the extended region (class 2): NGC 278, NGC 7817
-
•
Strong emission lines in the optical, evidence of weak to moderate-intensity lines in the NIR (nucleus or/and extended region - class 3): NGC 783, NGC 864, NGC 1174, NGC 2964, NGC 3184, NGC 4303, NGC 4845, NGC 5457, NGC 5905, NGC 7080, NGC 7798
-
•
Strong emission lines in the optical, moderate to strong emission lines in the NIR (class 4): NGC 2339, NGC 2342, NGC 2903, NGC 4102, NGC 6946
It is easy to see that class 3 concentrates the largest number of objects of our sample, mid-point between objects with no emission lines in the NIR and those with prominent permitted and forbidden lines. Moreover, three of the galaxies belonging to this class (NGC 4303, NGC 4845 and NGC 5457) have no H i lines at the nucleus, presenting them only in the off-nuclear apertures, implying that the region(s) of strong starburst activity is(are) very likely located on a ring of star formation around the nuclear region, or in a hot spot outside the nucleus. As our slit is considerably narrower than that of HO95, regions of active star formation outside the 0.8 strip, with centre at the nucleus, are not covered by our spectra but would show up in HO95 work if the angular distance of these regions from the centre is .
Thus, the lack of NIR emission lines in objects of classes 1 and 2 can be explained by differences in the slit width between the optical and NIR observations. In addition, differences in the position angle between our observations and those of HO95 (they oriented the slit along the parallactic angle while ours was always kept in the N-S direction, PA=0 deg) may also lead to the mapping of different portions of the circumnuclear region of the host galaxy. A third possibility is insufficient signal above the noise to detect them.
In order to examine the three alternatives above, Table 6 lists the upper limit derived for Pa (3-, column 2) for the nuclear NIR spectrum of all objects belonging to classes 1 and 2, objects from class 3 without emission lines in the nucleus and the flux measured on this line for two of the objects of class 4 with bright Pa lines. The H flux (column 3) were taken from H095. The expected Pa flux (column 4) was determined assuming Case-B recombination and an intrinsic Pa/H flux ratio of 0.05.
| Galaxy | Pa | H | Pa | Class |
|---|---|---|---|---|
| (upper limit, 3) | (expected) | |||
| NGC 278 | 5.40x10⁻¹⁶ | 3.55x10⁻¹⁶ | 1.77x10⁻¹⁵ | 2 |
| NGC 514 | 3.32x10⁻¹⁶ | 2.29x10⁻¹⁵ | 1.15x10⁻¹⁶ | 1 |
| NGC 674 | 1.11x10⁻¹⁵ | 4.90x10⁻¹⁵ | 2.45x10⁻¹⁶ | 1 |
| NGC 2903 | 7.90x10⁻¹⁶ | 2.88x10⁻¹⁴ | 1.44x10⁻¹⁵ | 4 |
| NGC 4303 | 2.43x10⁻¹⁵ | 1.45x10⁻¹³ | 7.23x10⁻¹⁵ | 3 |
| NGC 4845 | 2.54x10⁻¹⁵ | 2.45x10⁻¹⁴ | 1.23x10⁻¹⁵ | 3 |
| NGC 5457 | 2.03x10⁻¹⁵ | 4.68x10⁻¹⁴ | 2.34x10⁻¹⁵ | 3 |
| NGC 6181 | 1.25x10⁻¹⁵ | 2.69x10⁻¹⁴ | 1.35x10⁻¹⁵ | 1 |
| NGC 7448 | 4.69x10⁻¹⁶ | 9.77x10⁻¹⁵ | 4.89x10⁻¹⁶ | 1 |
| NGC 7817 | 6.54x10⁻¹⁶ | 5.62x10⁻¹⁴ | 2.81x10⁻¹⁵ | 2 |
| NGC 2339 | 1.69x10⁻¹⁴ | 8.51x10⁻¹⁴ | 4.26x10⁻¹⁵ | 4 |
| NGC 2342 | 1.05x10⁻¹⁴ | 1.48x10⁻¹³ | 7.40x10⁻¹⁵ | 4 |
(a) Obtained from Ho et al. (1997)
(b) Calculated based on the H value
When the expected Pa flux is comparable or smaller than the measured 3 upper limit, the NIR spectrum lacks of sufficient S/N for its adequate detection. This would be the case of all the four galaxies of class 1. That result is expected as the optical spectra of these sources show weaker H emission, sometimes still embedded within the stellar absorption depth. Therefore, the absence of emission lines in these sources is probably due to the intrinsic weakness of the line. This contrasts with what is observed in class 2 sources. The two objects belonging to this category have predicted Pa fluxes larger than the upper limit determined for that line. This means that if the region emitting the Pa line were inside the slit, it should have been observed. Therefore, the optical emission lines should come from regions not covered by our slit but that were inside HO95’s slit.
Considering the galaxies of class 3, it should be noted that six of them display emission lines only in the nuclear region (NGC 864, NGC 1174, NGC 2964, NGC 3184, NGC 7080 and NGC 7798), while NGC 4303, NGC 4845, NGC 5457 and NGC 5905 have emission lines that are more prominent on the off-nuclear extractions. For three of these sources, where Pa was not measured in the nuclear region, Table 6 lists the expected Pa flux and the upper limit flux measured from their nuclear spectra. The results show that for two of these galaxies, the predicted Pa is larger than the detection limit, and therefore the starburst component is very likely located around the nuclear region. This hypothesis is further supported by the off-nuclear emission lines that are clearly detected in our spectra. This would also be the situation of NGC 5905, which has emission lines on all three extractions, but the emission is stronger to the south. Indeed, this galaxy has a star-forming ring (Cameron et al., 2010) that would explain the enhanced emission outside the nucleus.
For most of the galaxies with strong nebular lines in both optical and NIR, the lines in the infrared are either only in the nuclear region, or stronger on the nucleus and with some emission on the off-nuclear extractions or vice-versa.
From all said above, the comparison between the optical and NIR spectra allowed us to conclude that the location of starburst component of the objects studied here varies from galaxy to galaxy. Three cases are particularly relevant: (i) weak starbursts, where the NIR nebular lines are too weak to show up; (ii) nuclear starbursts, where the star-forming region is located within the inner few tens of parsecs of the galaxy nucleus. The NIR spectrum of these objects shows prominent nuclear nebular lines that decreases in strength as the distance from the centre increases; (iii) star-forming rings or hot spots, located at distances larger than 100 pc from the nucleus. The NIR nuclear spectrum of these objects lacks of nuclear emission lines. The nebular lines become prominent in the off-nuclear spectra.
5.1 A NIR template of star-forming galaxies in the NIR
Spectral templates constructed from moderate to large uniform samples have been invaluable to understand the class of objects in question. Composite spectra enhance common features, while unusual characteristics are averaged out. Composite spectra can also be useful at comparing new subclasses of sources with existing populations. The lack of a suitable star-forming galaxy template redward of 9000 Å motivated us to produce such template in the NIR region.
In order to create a mean spectrum it is necessary to shift the objects to their rest frame using the redshifts from the emission lines and then rebin everything to a common dispersion. This last step is necessary as the dispersion changes from the to the -bands by more than a factor of 2 over the wavelength range of our spectra. Therefore, we chose to rebin our spectra by picking a dispersion that is proportional to the wavelength so that R is a constant. We choose =5 Å as it corresponds to the bin the -band, the largest across the wavelength region sampled. We linearly interpolated the flux and error arrays onto this wavelength grid. Finally, we normalised the spectra to unity in the interval 15250100 Å. This wavelength region was taken as reference because it approximately coincides with the centre of the spectra.
We built our composite spectrum by averaging the integrated normalised spectra of the star-forming galaxies. For this purpose, all the signal along the slit was integrated for each source. Normal galaxies were not included in this procedure. Figure 5 displays the final composite star-forming galaxy spectrum. Because of the increase in the S/N of this template spectrum, most emission and absorption features are significantly more prominent than in the individual sources.
How representative of the star forming galaxies in the NIR is our derived template? As we have shown in the previous sections, some of our sources display little or no emission lines, while for others these lines are Bright and prominent. Figure 5 compares the template with a representative spectrum of each of the four groups defined in the preceding section. We also compared our template with a normal galaxy spectrum. It can be seen that the main differences between star-forming galaxies relative to the template is found in the slope of the continuum, while stronger differences are observed when the template is compared to normal galaxies.
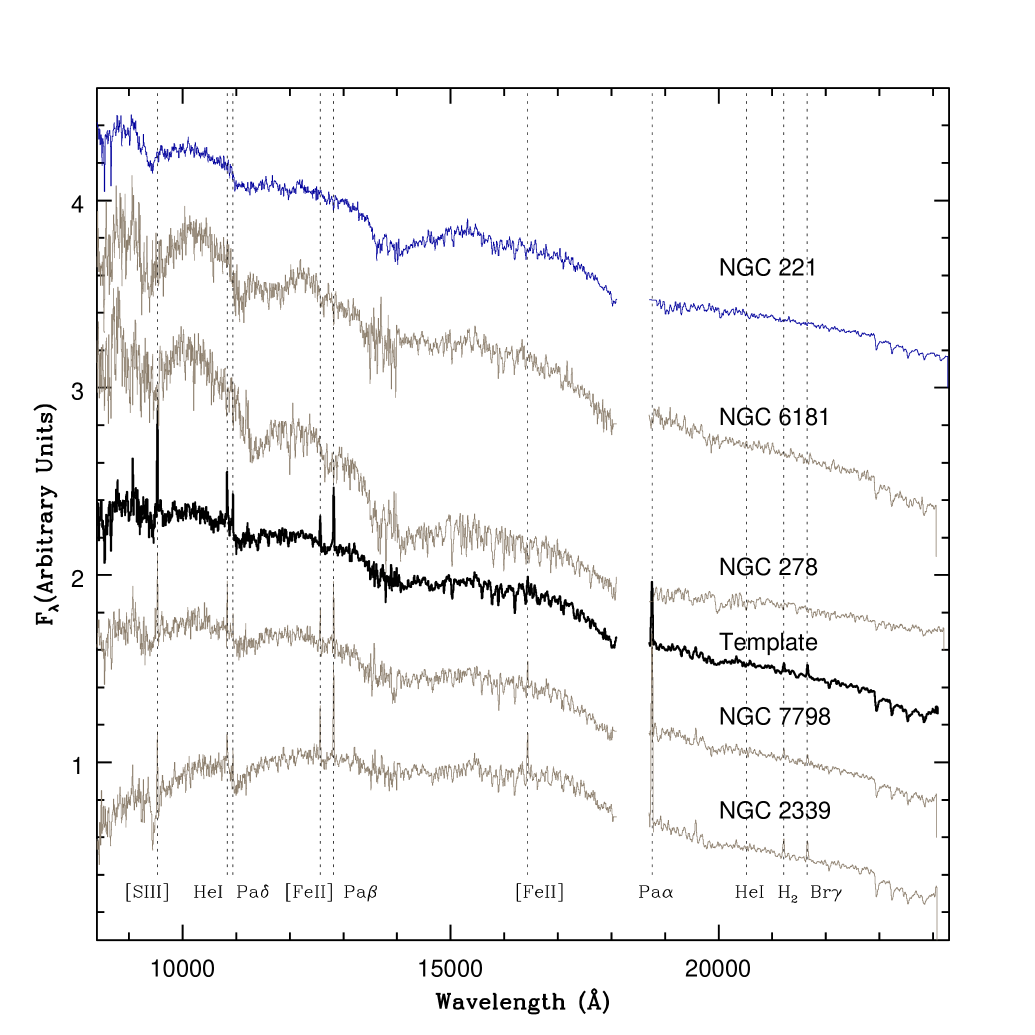
We expect that our template can be used as a benchmark of stellar population(s) in starburst galaxies against which to compare near-IR spectroscopy of different types of galaxies, especially those with AGN activity and/or those at high-redshift.
6 The NIR continuum in H ii/star-forming galaxies
A rapid inspection of the figures in the Appendix shows that despite the fact that the optical spectra of most objects of the sample are rather similar, the NIR spectroscopy reveals a wealth of absorption features and continuum shapes that contrast to what is observed in the optical. The analysis carried out in the preceding sections show that the continuum is intrinsically of stellar origin. Therefore, its shape should reflect the dominant stellar population in each galaxy.
In order to study more closely this issue, Figure 6 shows the nuclear spectra of all galaxies (normal and H ii) sorted out according to the form of the observed continuum. At the top is NGC 7748, which shows the steepest continuum, whose shape resembles that of a power-law usually found in AGN (Riffel et al., 2006). However, several absorption features, particularly the TiO and CN bands discussed in Sect. 3, are easily distinguished. The sequence continues with sources whose continuum emission gets progressively flatter, particularly in the bands, up to the point where it starts increasing its flux with wavelength in the band, then in the band reaches a maximum and then its flux decreases with wavelength in the band (from NGC 4102 up to NGC 6946, located at the bottom of the Figure.
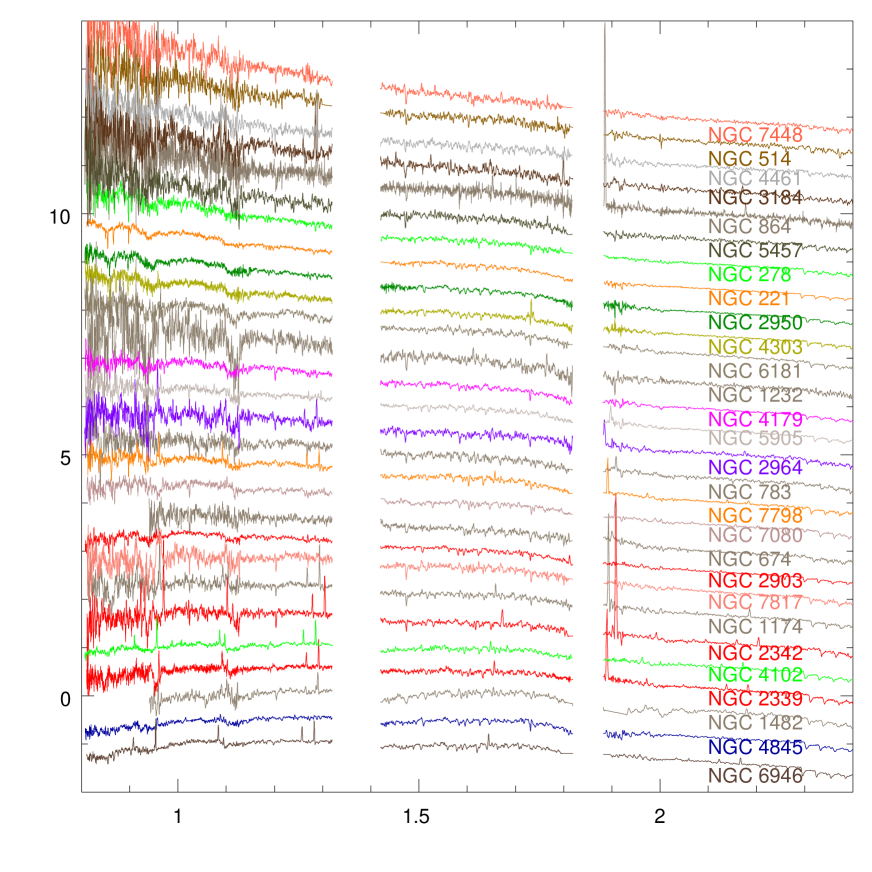
Although the galaxies in Figure 6 are sorted out by their continuum shape, it is easy to see that most sources from the mid- to the top part are populated by objects with very weak or no emission lines. In contrast, objects located in the lower part of the plot are dominated by permitted H i and He i lines as well as forbidden [S iii] and [Fe ii]. Note that the five normal galaxies used as a control sample (NGC 221, NGC 1232, NGC 2950, NGC 4179 and NGC 4461) are all located in the upper portion of the graph.
If the continuum shape follows the absence/presence of emission lines, it can be concluded, on a first approximation, that those sources with a steep continuum should be dominated by a population of old cool stars, unable to ionise the gas surrounding it. Objects located in the lower portion of Figure 6 should, in contrast, display a significant amount of young to intermediate age stellar population. Support to this hypothesis comes from the fact that the strength of the CO bands at 2.3m clearly increases from top to bottom. It is well-known that the first CO overtone bands in the band (2.29 - 2.5 ) are strongest in supergiants and become progressively weaker with decreasing luminosity.
If our hypothesis is correct, objects located in the lower portion of Figure 6 should also display high values of extinction compared to those of the upper portion. The reason is because a young to intermediate stellar population should still contain remnant dust from their parent cloud. Column 3 of Table 5 confirms that 10 out of 12 sources with emission lines have values between 4.7 to 6.9. These objects are all located from the mid- to the bottom part of the Figure. The remaining two objects (NGC 3184 and NGC 864) have of 1.04 and 1.68, respectively, both located in the top portion of the graph.
7 Summary and conclusions
We obtained long-slit NIR spectra of 23 star-forming galaxies with the objective of building an homogeneous sample to test the predictions of stellar population models that are and will soon be released in this wavelength region. We also observed 5 normal galaxies for comparison. The spectra were obtained at IRTF using the SpeX spectrograph.
We compared our NIR spectra with optical spectra available in the literature. For this comparison one have to keep in mind that the aperture sizes are very different. The optical aperture is much larger (2” x 4”) compared to our long slit aperture (0.8” x 2”), which means a factor of 5 times in area. This is probably the main reason for most of the differences observed between the spectra. We found that 26 of the galaxies classified as star-forming galaxies in the optical show no emission lines in the NIR. For the ones that have weak optical emission lines this is explained by our lack of sensibility to detect the emission lines in the NIR, where they would be intrinsically weaker. However, for the galaxies with strong emission lines in the optical that have no signs of emission in the NIR we believe that the star-formation region in these galaxies is not nuclear and was missed by our slit.
The extinction in the NIR due to the gas was calculated using the hydrogen ratio Pa/Br, and was found to be generally larger than the extinction calculated in the optical by HO97. This result agrees with what was found in the literature, and might be due to a combination of several effects. Since the slit size used for the optical observations is much larger than ours, the extinction derived by HO97 is an average value for the galaxy. If the dust tends to be more concentrated in the nuclear regions, smaller apertures would naturally probe higher extinction values. Along with that, the NIR intrinsically should probe larger optical depths than the optical range.
As suggested in the literature, we constructed a diagnostic diagram based on the [Fe ii]1.257/Pa and H2.121/Br ratios, that was suggested in the literature to be able to separate star-forming dominated systems from the ones dominated by AGN activity. Although several of our galaxies fall in the region where star-forming systems should be, some of the points fall in the regions where AGN activity is supposed to dominate the ionisation process. This result seems to indicate that the values of [Fe ii]1.257/Pa and H2.121/Br ratios limiting the starburst zone should be reviewed. Although the region defined by the lower values of these line ratios would be occupied by true starbursts only, and AGNs would always fall in the region for higher values of these ratios, starbursts might also have high values for these ratios and be mixed with the AGNs.
We also measured NIR indexes according to the definitions of Riffel et al. (2008). We found no correlation between these indexes and optical indicators of age or activity obtained from the literature. We detected important signatures predicted for a stellar population dominated by the TP-AGBs, like CN 1.1 m and CO 2.3m. We detected in at least one galaxy (NGC 4102) the CN 1.4 m, which is the first time this signature has been detected in an extragalactic source. We also detect TiO and ZrO bands that, again have never been reported before in galaxies.
With our sample we created a NIR template of star-forming galaxies that can be used as a benchmark of stellar populations in future studies.
The NIR continuum of the galaxies behaves differently from what is seen in the optical. While in the optical the continuum of most of the sources presented here is very similar, in the NIR they show a diversity of absorption signatures and continuum shapes which we believe are related to the presence or absence of dust, as well as of young stellar populations: sources with steep continuum would be dominated by a population of old cool stars. Sources where there is a maximum in the H-band and the flux decreases towards the K-band would have a significant fraction of young and/or intermediate age population.
Acknowledgments
The authors thank Jari Kotilainen, the referee of this paper, for his valuable comments. This research has been partially supported by the Brazilian agency FAPESP (2011/00171-4). ARA thanks to CNPq for financial support through grant 308877/2009-8. SD thanks INCT-A and CAPES for finnacial support.
References
- (1)
- Alonso-Herrero et al. (2000) Alonso-Herrero A., Rieke M. J., Rieke G. H., Shields J. C., 2000, ApJ, 530, 688
- Balogh et al. (1997) Balogh M. L., Morris S. L., Yee H. K. C., Carlberg R. G., Ellingson E., 1997, ApJ, 488, L75
- Bendo & Joseph (2004) Bendo G. J., Joseph R. D., 2004, AJ, 127, 3338
- Bernard-Salas et al. (2009) Bernard-Salas J. et al., 2009, ApJS, 184, 230
- Blain et al. (2002) Blain A. W., Smail I., Ivison R. J., Kneib J.-P., Frayer D. T., 2002, Physics Reports, 369, 111
- Calzetti et al. (2000) Calzetti D., Armus L., Bohlin R. C., Kinney A. L., Koornneef J., Storchi-Bergmann T., 2000, ApJ, 533, 682
- Cameron et al. (2010) Cameron E. et al., 2010, MNRAS, 409, 346
- Cardelli et al. (1989) Cardelli J. A., Clayton G. C., Mathis J. S., 1989, ApJ, 345, 245
- Cesetti et al. (2009) Cesetti M. et al., 2009, A&A, 497, 41
- Coziol et al. (2001) Coziol R., Doyon R., Demers S., 2001, MNRAS, 325, 1081
- Coziol et al. (1998) Coziol R., Torres C. A. O., Quast G. R., Contini T., Davoust E., 1998, ApJS, 119, 239
- Cushing et al. (2004) Cushing M. C., Vacca W. D., Rayner J. T., 2004, PASP, 116, 362
- Elbaz & Cesarsky (2003) Elbaz D., Cesarsky C. J., 2003, Science, 300, 270
- Engelbracht et al. (1998) Engelbracht C. W., Rieke M. J., Rieke G. H., Kelly D. M., Achtermann J. M., 1998, ApJ, 505, 639
- Frogel et al. (1990) Frogel J. A., Mould J., Blanco V. M., 1990, ApJ, 352, 96
- Garcia-Rissmann et al. (2005) Garcia-Rissmann A., Vega L. R., Asari N. V., Cid Fernandes R., Schmitt H., González Delgado R. M., Storchi-Bergmann T., 2005, MNRAS, 359, 765
- Goldader et al. (1997) Goldader J. D., Goldader D. L., Joseph R. D., Doyon R., Sanders D. B., 1997, AJ, 113, 1569
- Gu et al. (2006) Gu Q., Melnick J., Cid Fernandes R., Kunth D., Terlevich E., Terlevich R., 2006, MNRAS, 366, 480
- Heisler & De Robertis (1999) Heisler C. A., De Robertis M. M., 1999, AJ, 118, 2038
- Ho et al. (1995) Ho L. C., Filippenko A. V., Sargent W. L., 1995, ApJS, 98, 477
- Ho et al. (1997) Ho L. C., Filippenko A. V., Sargent W. L. W., 1997, ApJS, 112, 315
- Hunt et al. (2003) Hunt L. K., Thuan T. X., Izotov Y. I., 2003, ApJ, 588, 281
- Kawara et al. (1989) Kawara K., Nishida M., Phillips M. M., 1989, ApJ, 337, 230
- Kennicutt (1988) Kennicutt, Jr. R. C., 1988, ApJ, 334, 144
- Kennicutt (1992) Kennicutt, Jr. R. C., 1992, ApJ, 388, 310
- Kotilainen et al. (2012) Kotilainen J. K., Hyvönen T., Reunanen J., Ivanov V. D., 2012, MNRAS, 425, 1057
- Lançon et al. (2001) Lançon A., Goldader J. D., Leitherer C., González Delgado R. M., 2001, ApJ, 552, 150
- Lyubenova et al. (2012) Lyubenova M., Kuntschner H., Rejkuba M., Silva D. R., Kissler-Patig M., Tacconi-Garman L. E., 2012, A&A, 543, A75
- Maraston (2005) Maraston C., 2005, MNRAS, 362, 799
- Martins et al. (2010) Martins L. P., Riffel R., Rodríguez-Ardila A., Gruenwald R., de Souza R., 2010, MNRAS, 406, 2185
- Melbourne et al. (2010) Melbourne J., Williams B., Dalcanton J., Ammons S. M., Max C., Koo D. C., Girardi L., Dolphin A., 2010, ApJ, 712, 469
- Melbourne et al. (2012) Melbourne J. et al., 2012, ApJ, 748, 47
- Micheva et al. (2012) Micheva G. et al., 2012, ArXiv e-prints
- Miner et al. (2011) Miner J., Rose J. A., Cecil G., 2011, in Bulletin of the American Astronomical Society, Vol. 43, American Astronomical Society Meeting Abstracts #217, p. 211.02
- Moorwood & Glass (1982) Moorwood A. F. M., Glass I. S., 1982, A&A, 115, 84
- Moorwood & Oliva (1988) Moorwood A. F. M., Oliva E., 1988, A&A, 203, 278
- Oliva et al. (1995) Oliva E., Origlia L., Kotilainen J. K., Moorwood A. F. M., 1995, A&A, 301, 55
- Origlia et al. (1993) Origlia L., Moorwood A. F. M., Oliva E., 1993, A&A, 280, 536
- Osterbrock (1989) Osterbrock D. E., 1989, Astrophysics of gaseous nebulae and active galactic nuclei
- Persson et al. (1983) Persson S. E., Aaronson M., Cohen J. G., Frogel J. A., Matthews K., 1983, ApJ, 266, 105
- Puxley & Brand (1994) Puxley P. J., Brand P. W. J. L., 1994, MNRAS, 266, 431
- Rayner et al. (2009) Rayner J. T., Cushing M. C., Vacca W. D., 2009, ApJS, 185, 289
- Rayner et al. (2003) Rayner J. T., Toomey D. W., Onaka P. M., Denault A. J., Stahlberger W. E., Vacca W. D., Cushing M. C., Wang S., 2003, PASP, 115, 362
- Reunanen et al. (2002) Reunanen J., Kotilainen J. K., Prieto M. A., 2002, MNRAS, 331, 154
- Reunanen et al. (2003) Reunanen J., Kotilainen J. K., Prieto M. A., 2003, MNRAS, 343, 192
- Rieke et al. (1980) Rieke G. H., Lebofsky M. J., Thompson R. I., Low F. J., Tokunaga A. T., 1980, ApJ, 238, 24
- Riffel et al. (2009) Riffel R., Pastoriza M. G., Rodríguez-Ardila A., Bonatto C., 2009, MNRAS, 400, 273
- Riffel et al. (2008) Riffel R., Pastoriza M. G., Rodríguez-Ardila A., Maraston C., 2008, MNRAS, 388, 803
- Riffel et al. (2006) Riffel R., Rodríguez-Ardila A., Pastoriza M. G., 2006, A&A, 457, 61
- Rodríguez-Ardila et al. (2004) Rodríguez-Ardila A., Pastoriza M. G., Viegas S., Sigut T. A. A., Pradhan A. K., 2004, A&A, 425, 457
- Rodríguez-Ardila et al. (2008) Rodríguez-Ardila A., Riffel R., Carvalho E. A., 2008, in Revista Mexicana de Astronomia y Astrofisica Conference Series, Vol. 32, Revista Mexicana de Astronomia y Astrofisica Conference Series, pp. 77–79
- Schlafly & Finkbeiner (2011) Schlafly E. F., Finkbeiner D. P., 2011, ApJ, 737, 103
- Vega et al. (2009) Vega L. R., Asari N. V., Cid Fernandes R., Garcia-Rissmann A., Storchi-Bergmann T., González Delgado R. M., Schmitt H., 2009, MNRAS, 393, 846
- Worthey & Ottaviani (1997) Worthey G., Ottaviani D. L., 1997, ApJS, 111, 377
- Zibetti et al. (2012) Zibetti S., Gallazzi A., Charlot S., Pierini D., Pasquali A., 2012, ArXiv e-prints
Appendix A Spectra