Formaldehyde Densitometry of Starburst Galaxies: Density-Independent Global Star Formation
Abstract
Accurate techniques that allow for the derivation of the spatial density in star formation regions are rare. A technique that has found application for the derivation of spatial densities in Galactic star formation regions utilizes the density-sensitive properties of the K-doublet transitions of formaldehyde (H2CO). In this paper, we present an extension of our survey of the formaldehyde ( cm) and ( cm) K-doublet transitions of H2CO in a sample of 56 starburst systems (Mangum et al., 2008). We have extended the number of galaxies in which both transitions have been detected from 5 to 13. We have improved our spatial density measurements by incorporating kinetic temperatures based upon NH3 measurements of 11 of the galaxies with a total of 14 velocity components in our sample (Mangum et al., 2013). Our spatial density measurements lie in a relatively narrow range from 104.5 to 105.5 cm-3. This implies that the Schmidt-Kennicutt relation between LIR and Mdense: (1) is an indication of the dense gas mass reservoir available to form stars, and (2) is not directly dependent upon a higher average density driving the star formation process in the most luminous starburst galaxies. We have also used our H2CO measurements to derive two separate measures of the dense gas mass which are generally smaller, in many cases by a factor of , than those derived using HCN. This disparity suggests that H2CO traces a denser, more compact, component of the giant molecular clouds in our starburst galaxy sample.
We also report measurements of the rotationally-excited cm state of OH and the H111 radio recombination line taken concurrently with our H2CO measurements.
Subject headings:
ISM: molecules, galaxies: ISM, galaxies: nuclei, galaxies: starbursts, radio lines: galaxies1. Introduction
Studies of the abundant CO molecule toward external galaxies have revealed the large scale structure of the molecular mass in these objects. Unfortunately, high optical depth tends to limit the utility of the abundant CO molecule as a probe of the spatial density and kinetic temperature in dense gas environments, quantities necessary to assess the possibility and conditions of star formation (Liszt et al., 2010). Emission from less-abundant, higher-dipole moment molecules is better-suited to the task of deriving the spatial density and kinetic temperature within dense gas environments. A variety of molecules which trace dense molecular environments in mainly nearby galaxies have been studied; see the reviews of Henkel, Baan, & Mauersberger (1991, for early work) and Omont (2007).
Formaldehyde (H2CO) has proven to be a reliable density and kinetic temperature probe in Galactic molecular clouds (Mangum & Wootten, 1993; Mangum et al., 1993; Ginsburg et al., 2011). Existing measurements of the H2CO and K-doublet transitions in a wide variety of galaxies by Baan et al. (1986, 1990, 1993), and Araya et al. (2004) have mainly concentrated on measurements of the transition. By collecting a consistent set of measurements of both K-doublet transitions we are able to derive the spatial density within the extragalactic star formation regions which comprise this study. Using the unique density selectivity of the K-doublet transitions of H2CO we have measured the spatial density in a sample of galaxies exhibiting starburst phenomena and/or high infrared luminosity (Mangum et al., 2008). In the present work we have nearly tripled the number of galaxies within which the spatial density can be derived from five to thirteen. In eleven of these galaxies with a total of fourteen velocity components we have further improved the quality of our spatial density determination by applying kinetic temperatures derived from NH3 measurements (Mangum et al., 2013). In §2 we discuss the specific properties of the H2CO molecule that make it a good probe of spatial density. §3 presents a summary of our observations; §4 our H2CO, OH, H111, and continuum emission measurement results; §5 analyses of our H2CO, OH, and H111 measurements, including Large Velocity Gradient (LVG) model fits and dense gas mass calculations based on our H2CO measurements.
2. Formaldehyde as a High Density Probe
The ubiquitous and readily-observed formaldehyde (H2CO) molecule is a reliable probe of the high density environs of star formation regions. Pervasive in the interstellar medium, H2CO exhibits a moderate abundance which appears to vary by less than an order-of-magnitude within star formation regions in our own Galaxy (Mangum et al., 1990). As a slightly asymmetric rotor molecule, most H2CO rotational transitions are split into two sub levels. These energy levels are designated by a total angular momentum quantum number, J, the projection of J along the symmetry axis for a limiting prolate symmetric top, K-1, and the projection of J along the symmetry axis for a limiting oblate symmetric top, K+1. This splitting leads to two types of transitions: the high-frequency J = 1, K-1 = 0, K+1 = 1 “P-branch” transitions and the lower-frequency J = 0, K-1 = 0, K+1 = 1 “Q-branch” transitions, popularly known as the “K-doublet” transitions (see discussion in Mangum & Wootten, 1993; McCauley et al., 2011). The P-branch transitions are only seen in emission in regions where n() 104 cm-3. In the K-doublet transitions, for n() 105.5 cm-3, the lower energy states of the through transitions become overpopulated due to a collisional selection effect (Evans et al., 1975; Garrison et al., 1975). This overpopulation cools the J 5 K-doublets to excitation temperatures lower than that of the cosmic microwave background, causing them to appear in absorption. For n() cm-3 and an assumed kinetic temperature of 40 K, this collisional pump is quenched and the J 5 K-doublets are driven into emission over a wide range of kinetic temperatures and abundances (see Figure 1 in Mangum et al., 2008).
Measurements of the spatial density in galactic and extragalactic star formation regions often rely upon only order-of-magnitude or critical density estimates. The collisional excitation of H2CO provides a direct translation to density that is fairly kinetic temperature independent. The use of H2CO as a density probe offers unprecedented improvement to these more approximate density determinations, allowing for an actual measurement of this important physical quantity.
3. Observations
The measurements reported here were made using the National Radio Astronomy Observatory (NRAO111The National Radio Astronomy Observatory is a facility of the National Science Foundation operated under cooperative agreement by Associated Universities, Inc.) Green Bank Telescope (GBT) during the periods 2006/06/07-14 (reported in Mangum et al., 2008), 2007/01/16-04/22, 2007/11/05-11/26, 2008/04/14-09/22, and 2011/05/04-07/16. Using exactly the same observing setup as was used for the observations presented in Mangum et al. (2008), single-pointing measurements were obtained of the (4.829660 GHz; Tucker et al., 1971) and (14.488479 GHz; Tucker et al., 1972) K-doublet transitions of H2CO, the H111 radio recombination line (RRL) at 4.744183 GHz, and two ( and ) of the three 6 cm lines of the rotationally-excited state of OH at 4.750656(3) and 4.765562(3) GHz (Radford, 1968; Lovas, 1992) toward a sample of 56 infrared-luminous and/or starburst galaxies (Table 1). Our galaxy sample was chosen to represent both galaxies with measured H2CO emission or absorption (Baan et al., 1993; Araya et al., 2004) and other galaxies with substantial molecular emission deduced from HCN measurements (Gao & Solomon, 2004a). The single-beam H2CO , H111, and OH transitions were measured simultaneously using 4 spectral windows each with 50 MHz of bandwidth sampled by 16384 channels. All of the 4.8 GHz measurements () utilized the position switching technique with reference position located 30 arcmin west in azimuth from each galaxy position. Galaxy and reference integrations were 3 minutes each at 4.8 GHz. The H2CO transition was measured using a dual-beam (; beam separation 330′′ in cross-elevation) receiver over 50 MHz of bandwidth sampled by 16384 channels. The dual-beam system at 14.5 GHz allowed for both position switching or beam nodding. Galaxy and reference integrations were 2 minutes each at 14.5 GHz. The correlator configurations produced a spectral channel width of 3.052 kHz, which is approximately 0.2 and 0.08 km s-1 at 4.8 and 14.5 GHz, respectively.
For eighteen of the galaxies listed in Table 1 measurements of one or both K-doublet H2CO transitions were presented in Mangum et al. (2008). Additional observations and/or updated analysis (i.e. modified spectral smoothing) of the K-doublet H2CO measurements of these eighteen galaxies are included in the results presented here.
| GalaxyaaIR IRAS (Infrared Astronomical Satellite) throughout this paper. | vhelbbHeliocentric velocity drawn from the literature. | DccNEDf Hubble flow distance corrected for Virgo cluster, Great Attractor, and Shapley supercluster. For NGC 598 no Hubble flow distance available, so NED “redshift-independent” distance assumed. | TdustddFrom Gao & Solomon (2004b), who used IRAS 60 and 100m dust continuum emission ratios with an assumed dust emissivity with . | ClassificationeeFrom NED, Sbrst = starburst galaxy. | ||
|---|---|---|---|---|---|---|
| (J2000) | (J2000) | (km s-1) | (Mpc) | (K) | ||
| NGC 55 | 00:14:54.5 | 39:11:19 | 129 | SB(s)m: edge-on | ||
| NGC 253 | 00:47:33.1 | 25:17:18 | 251 | 34 | SAB(s)c | |
| IC 1623 | 01:07:47.2 | 17:30:25 | 6028 | 39 | LIRG | |
| NGC 520 | 01:24:35.3 | 03:47:37 | 2281 | 38 | Pec, Pair, Sbrst | |
| NGC 598 | 01:33:54.0 | 30:40:07 | 179 | SA(s)cd | ||
| NGC 660 | 01:43:01.7 | 13:38:36 | 856 | 37 | SB(s)a:pec, HII LINER | |
| IR 01418+1651 | 01:44:30.5 | 17:06:09 | 8101 | LIRG | ||
| NGC 695 | 01:51:14.9 | 22:34:57 | 9769 | 34 | SO pec:LIRG | |
| Mrk 1027 | 02:14:05.6 | 05:10:24 | 9061 | 37 | I:LIRG | |
| NGC 891 | 02:22:33.4 | 42:20:57 | 529 | 28 | SA(s)b?:sp | |
| NGC 925 | 02:27:16.9 | 33:34:35 | 553 | SAB(s)d | ||
| NGC 1022 | 02:38:32.7 | 06:40:39 | 1503 | 39 | SB(s)a | |
| NGC 1055 | 02:41:45.2 | 00:26:35 | 996 | 29 | SBb:sp:Sy2 LINER | |
| Maffei 2 | 02:41:55.1 | 59:36:15 | 17 | SAB(rs)bc | ||
| NGC 1068 | 02:42:40.7 | 00:00:48 | 1136 | 40 | SA(rs)b:Sy1/2 | |
| UGC 02369 | 02:54:01.8 | 14:58:15 | 9262 | DBL | ||
| NGC 1144 | 02:55:12.2 | 00:11:01 | 8750 | 32 | S pec | |
| NGC 1365 | 03:33:36.4 | 36:08:25 | 1652 | 32 | SBb(s)b | |
| IR 03359+1523 | 03:38:47.1 | 15:32:53 | 10507 | LIRG | ||
| IC 342 | 03:46:49.7 | 68:05:45 | 31 | 30 | SAB(rs)cd | |
| NGC 1614 | 04:33:59.8 | 08:34:44 | 4847 | 46 | SB(s)c:pec | |
| VIIZw31 | 05:16:46.4 | 79:40:13 | 16290 | 34 | ||
| NGC 2146 | 06:18:37.7 | 78:21:25 | 918 | 38 | SB(s)ab:pec | |
| NGC 2623 | 08:38:24.1 | 25:45:17 | 5535 | LIRG | ||
| Arp 55 | 09:15:55.1 | 44:19:55 | 11957 | 36 | Pair | |
| NGC 2903 | 09:32:10.1 | 21:30:02 | 556 | 29 | SB(s)d | |
| UGC 5101 | 09:35:51.6 | 61:21:11 | 11810 | 36 | Sy1.5, LINER | |
| M 82 | 09:55:52.2 | 69:40:47 | 203 | 45 | I0,Sbrst | |
| M 82SW | 09:55:50.0 | 69:40:43 | 203 | |||
| NGC 3079 | 10:01:57.8 | 55:40:47 | 1150 | 32 | SB(s)c, LINER | |
| IR 10173+0828 | 10:19:59.9 | 08:13:34 | 14716 | Sbrst | ||
| NGC 3227 | 10:23:30.7 | 19:52:46 | 1111 | SAB(s):pec | ||
| NGC 3627 | 11:20:15.0 | 12:59:30 | 727 | 30 | SAB(s)b:LINER | |
| NGC 3628 | 11:20:17.2 | 13:35:20 | 847 | 30 | Sb:pec:sp | |
| NGC 3690 | 11:28:32.2 | 58:33:44 | 3121 | Merger | ||
| NGC 4631 | 12:42:08.0 | 32:32:29 | 606 | 30 | SB(s)d | |
| NGC 4736 | 12:50:53.0 | 41:07:14 | 308 | SA(r)ab;Sy2;LINER | ||
| Mrk 231 | 12:56:14.2 | 56:52:25 | 12642 | SA(rs)c:pec | ||
| NGC 5005 | 13:10:56.2 | 37:03:33 | 946 | 28 | SAB(rs)bc | |
| IC 860 | 13:15:04.1 | 24:37:01 | 3866 | Sa, Sbrst | ||
| NGC 5194 | 13:29:52.7 | 47:11:43 | 463 | SA(s)bc:pec | ||
| M 83 | 13:37:00.9 | 29:51:57 | 518 | 31 | SAB(s)c | |
| Mrk 273 | 13:44:42.1 | 55:53:13 | 11324 | 48 | LINER | |
| NGC 5457 | 14:03:12.6 | 54:20:57 | 241 | SAB(rs)cd | ||
| IR 15107+0724 | 15:13:13.1 | 07:13:27 | 3897 | Sbrst | ||
| Arp 220 | 15:34:57.1 | 23:30:11 | 5434 | 44 | Pair, Sbrst | |
| NGC 6240 | 16:52:59.0 | 02:24:02 | 7339 | 41 | I0:pec, LINER, Sy2 | |
| IR 17208-0014 | 17:23:21.9 | 00:17:00 | 12834 | 46 | ULIRG | |
| IR 17468+1320 | 17:49:06.7 | 13:19:54 | 4881 | LIRG | ||
| NGC 6701 | 18:43:12.4 | 60:39:12 | 3950 | 32 | SB(s)a | |
| NGC 6921 | 20:28:28.8 | 25:43:24 | 4399 | 34 | SA(r)0/a | |
| NGC 6946 | 20:34:52.3 | 60:09:14 | 48 | 30 | SAB(rs)cd | |
| IC 5179 | 22:16:09.1 | 36:50:37 | 3447 | 33 | SA(rs)bc | |
| NGC 7331 | 22:37:04.1 | 34:24:56 | 821 | 28 | SA(s)b;LINER | |
| NGC 7479 | 23:04:56.6 | 12:19:22 | 2385 | 36 | SB(s)c;LINER | |
| IR 23365+3604 | 23:39:01.3 | 36:21:09 | 19330 | 45 | ULIRG | |
| Mrk 331 | 23:51:26.7 | 20:35:10 | 5422 | 41 | LIRG |
To calibrate the intensity scale of our measurements, several corrections need to be considered:
- Opacity:
-
Historical opacity estimates based on atmospheric model calculations using ambient pressure, temperature, and relative humidity measurements indicated that at 4.8 and 14.5 GHz was 0.01 and 0.05 during our observations (assuming elevation 30 degrees). The opacity corrections are and , respectively.
- Flux:
-
Assuming point-source emission, one can use the current relation (derived from point-source radiometric continuum measurements; Maddalena, 2008) for the aperture efficiency to convert antenna temperature to flux density. At 4.8 and 14.5 GHz this yields = 0.71 and 0.67, respectively. For elevation 90 degrees and zero atmospheric opacity, TA/S = = 2.0 and 1.9 for 4.8 and 14.5 GHz, respectively. For elevation , TA/S = 1.97 and 1.80 at 4.8 and 14.5 GHz. These are the K/Jy calibration factors used to convert our spectra to flux density assuming point-source emission. Measurements of the standard flux calibration sources 3C 48 and 3C 286 yielded TA/S = and at 4.8 and 14.5 GHz, consistent with the standard empirical values. Note also that since the opacity correction is small, , where for the GBT. Using , we can write the main beam brightness temperature as .
- Galaxy Structure:
-
Several of our galaxies are suspected to have high-density structure (measured with high-dipole moment molecules like HCN) on scales approaching the size of our beam at 14.5 GHz (51′′). The beam coupling correction necessary to account for structure in our 14.5 GHz measurements, relative to our point-source assumption, is given by:
(1) This correction factor is less than 20% for . With the exception of M 82, none of the galaxies in our sample have measured dense molecular gas structure larger than . We therefore assume that, with the exception of M 82222As was discussed in Mangum et al. (2008), the source coupling correction for the extended nature of M 82 results in a 20% decrease in the measured H2CO / K-doublet transition ratio, which leads to a corresponding increase in the derived spatial density., all of the H2CO emission reported in these measurements is from structures smaller than the primary beams of our measurements.
- Absolute Amplitude Calibration:
-
The GBT absolute amplitude calibration is reported to be accurate to 10–15% at all frequencies, limited mainly by temporal drifts in the noise diodes used as absolute amplitude calibration standards. As noted above, measurements of the standard flux calibration sources 3C 48 and 3C 286 yielded TA/S = and at 4.8 and 14.5 GHz, suggesting that our absolute flux calibration is good to %. Relative calibration between our 4.8 and 14.5 GHz measurements is assumed to be , which produces a negligible impact on density measurements obtained from H2CO line ratios.
4. Results
4.1. H2CO
Table 2 lists our H2CO and measurement results, including updated results for the eighteen galaxies in our present sample that were presented in Mangum et al. (2008). Since additional observations and/or updated analysis of these eighteen galaxies are included in the analysis presented in this work, we list these updated H2CO measurement results in italics in Table 2. H2CO measurements for thirty-eight galaxies and one galaxy offset position (M 82SW) are completely new measurements. The new H2CO measurements presented in this paper have nearly tripled the number of galaxies within which both H2CO K-doublet transitions have been detected from five to thirteen. For each detection we list the peak intensity, heliocentric central line velocity, velocity width (FW(ZI/HM)), and integrated intensity derived from direct channel-by-channel integration of and gaussian fits to each of the line profiles. Uncertainties expressed as one-sigma are listed in parentheses for each quantity in Tables 2.
Spectra for the galaxies detected in only the or transition are displayed in Figure 1. NGC 253, NGC 660, Maffei 2, IC 342 (all in Figure 2), NGC 2146, M 82, M 82SW, NGC 3079 (all in Figure 3), NGC 3628, IC 860, M 83, IR 15107+0724 (all in Figure 4), Arp 220, and NGC 6946 (both in Figure 5) were all detected in both H2CO transitions. These spectra have been gaussian smoothed to the spectral channel widths quoted in Table 2 to both increase the channel-specific signal-to-noise ratio of our measurements and more closely match other molecular spectral line measurements of these galaxies (i.e. Gao & Solomon, 2004a).
| Galaxy | Transitionbb Transitions in italics reanalyzed and/or amended with new measurements from those presented in Mangum et al. (2008). | Fitcc Gnn / Dnn Gaussian / Direct measurement results with nn km/s gaussian spectral smoothing. | vheld,ed,efootnotemark: | FW(HM/ZI)e,fe,ffootnotemark: | Tdvgg Derived from direct integration of line profile. | |
|---|---|---|---|---|---|---|
| (mK) | (km s-1) | (km s-1) | (mK km s-1) | |||
| NGC 55 | D10 | (0.8) | ||||
| NGC 253 | D15 | 32.8(1.8) | 230.1 | 349.1 | 5773.7(299.5) | |
| G15 | 34.3(1.3) | 227.0(3.0) | 163.0(7.0) | 5947.9(339.4) | ||
| D15 | 20.2(0.4) | 237.8 | 242.9 | 2542.3(51.6) | ||
| G15 | 11.4(1.0) | 169.1(3.1) | 58.3(6.3) | 708.2(99.5) | ||
| G15 | 18.7(0.6) | 252.6(2.9) | 93.1(6.3) | 1847.8(136.4) | ||
| IC 1623 | D10 | (1.3) | ||||
| NGC 520 | D20 | 4.4(0.9) | 2301.2 | 215.4 | 449.1(93.9) | |
| G20 | 4.0(0.4) | 2286.6(4.8) | 106.8(11.6) | 451.9(64.3) | ||
| D10 | (0.5) | |||||
| NGC 598 | D10 | (0.7) | ||||
| D10 | (0.3) | |||||
| NGC 660 | D30 | 3.2(0.6) | 1041.6 | 976.6 | 1511.9(261.7) | |
| G30 | 2.2(0.2) | 923.3(47.3) | 765.0(135.5) | 1758.2(366.4) | ||
| D30 | 3.7(0.4) | 871.6 | 1060.8 | 1280.8(223.5) | ||
| G30 | 2.2(0.2) | 754.3(19.1) | 547.2(47.8) | 1257.6(140.3) | ||
| IR 014181651 | D20 | (0.6) | ||||
| D10 | (0.3) | |||||
| NGC 695 | D10 | (0.8) | ||||
| D10 | (0.5) | |||||
| Mrk 1027 | D10 | (1.3) | ||||
| NGC 891 | D20 | 2.8(0.8) | 476.3 | 434.8 | 538.9(160.1) | |
| G20 | 1.7(0.3) | 535.0(48.8) | 413.6(145.2) | 726.6(280.4) | ||
| D10 | (0.3) | |||||
| NGC 925 | D10 | (1.4) | ||||
| NGC 1022 | D10 | (1.2) | ||||
| D10 | (0.7) | |||||
| NGC 1055 | D10 | (1.2) | ||||
| D10 | (0.3) | |||||
| Maffei 2 | D20 | 5.5(0.9) | 64.0 | 354.5 | 756.5(144.7) | |
| G20 | 2.1(0.6) | 98.1(45.5) | 127.5(85.2) | 284.9(208.7) | ||
| G20 | 4.5(1.0) | 24.7(17.1) | 102.1(30.3) | 493.2(180.2) | ||
| D20 | 1.4(0.2) | 15.5 | 303.1 | 220.5(24.7) | ||
| G20 | 0.9(0.2) | 90.7(12.8) | 78.9(29.0) | 78.1(33.2) | ||
| G20 | 1.4(0.2) | 18.3(9.1) | 91.3(21.8) | 136.0(36.9) | ||
| NGC 1068 | D10 | (1.1) | ||||
| D10 | (0.4) | |||||
| UGC 02369 | D10 | (1.1) | ||||
| NGC 1144 | D20 | 6.9(0.7) | 8838.7 | 1214.4 | 2251.6(417.6) | |
| G20 | 2.1(0.7) | 8281.8(8.6) | 51.6(20.1) | 116.8(60.4) | ||
| G20 | 6.2(0.4) | 8517.4(5.4) | 158.7(13.2) | 1044.8(113.0) | ||
| G20 | 1.8(0.2) | 9088.9(39.0) | 609.0(119.6) | 1186.0(275.9) | ||
| D10 | (0.4) | |||||
| NGC 1365 | D20 | 2.1(0.4) | 1637.6 | 398.4 | 410.0(77.1) | |
| G20 | 1.6(0.3) | 1608.1(21.8) | 266.9(57.9) | 449.3(121.8) | ||
| D10 | (2.0) | |||||
| IR 033591523 | D10 | (1.3) | ||||
| IC 342 | D10 | 5.6(1.7) | 22.1 | 116.7 | 391.1(94.8) | |
| G10 | 5.2(0.8) | 25.0(4.9) | 67.9(11.5) | 372.2(83.4) | ||
| D10 | 2.8(0.4) | 23.5 | 109.8 | 138.8(22.7) | ||
| G10 | 2.6(0.2) | 27.4(2.1) | 51.1(4.9) | 139.1(17.6) | ||
| NGC 1614 | D10 | (1.5) | ||||
| VIIZw31 | D10 | (1.1) | ||||
| D10 | (0.3) | |||||
| NGC 2146 | D20 | 1.9(0.3) | 883.9 | 436.0 | 483.2(68.7) | |
| G20 | 1.7(0.2) | 867.3(13.4) | 239.8(36.4) | 430.3(77.3) | ||
| G20 | 1.6(0.4) | 1038.5(5.3) | 49.6(14.5) | 83.8(31.4) | ||
| D20 | 1.7(0.1) | 869.4 | 569.1 | 366.0(19.6) | ||
| G20 | 1.2(0.1) | 824.3(8.9) | 231.8(23.3) | 296.8(35.2) | ||
| G20 | 0.6(0.1) | 1046.9(12.3) | 109.5(29.4) | 65.3(22.1) | ||
| NGC 2623 | D10 | (1.0) | ||||
| D10 | (0.4) | |||||
| Arp 55 | D10 | (2.6) | ||||
| NGC 2903 | D10 | (0.3) | ||||
| D10 | (0.2) | |||||
| UGC 05101 | D20 | (0.6) | ||||
| D10 | (0.3) | |||||
| M 82 | D20 | 22.8(1.1) | 231.7 | 453.8 | 4600.1(237.0) | |
| G20 | 14.7(0.9) | 124.6(4.1) | 98.1(9.0) | 1531.6(167.6) | ||
| G20 | 21.7(0.7) | 275.0(3.3) | 135.3(8.0) | 3128.0(212.8) | ||
| D20 | 6.0(0.4) | 234.6 | 465.5 | 1440.9(92.7) | ||
| G20 | 5.7(0.6) | 110.2(5.8) | 97.4(13.1) | 595.2(99.4) | ||
| G20 | 4.7(0.4) | 278.6(10.3) | 177.1(26.6) | 883.5(151.2) |
| Galaxy | Transitionbb Transitions in italics reanalyzed and/or amended with new measurements from those presented in Mangum et al. (2008). | Fitcc Gnn / Dnn Gaussian / Direct measurement results with nn km/s gaussian spectral smoothing. | vheld,ed,efootnotemark: | FW(HM/ZI)e,fe,ffootnotemark: | Tdvgg Derived from direct integration of line profile. | |
|---|---|---|---|---|---|---|
| (mK) | (km s-1) | (km s-1) | (mK km s-1) | |||
| M 82SW | D20 | 18.2(1.8) | 228.0 | 424.4 | 4040.0(320.0) | |
| G20 | 11.2(1.4) | 132.0(12.6) | 116.4(24.6) | 1384.6(342.9) | ||
| G20 | 18.0(1.1) | 282.7(9.1) | 144.2(19.2) | 2767.9(406.9) | ||
| D20 | 7.7(0.4) | 225.2 | 464.8 | 1632.9(98.1) | ||
| G20 | 7.3(0.5) | 116.4(3.5) | 96.4(7.9) | 743.3(80.2) | ||
| G20 | 4.7(0.3) | 274.9(9.3) | 185.4(22.7) | 925.2(125.0) | ||
| NGC 3079 | G05 | 1.0(0.4) | 1006.8(12.0) | 55.2(33.6) | 56.0(41.4) | |
| G05 | 2.0(0.2) | 1186.7(11.4) | 200.9(35.0) | 436.1(87.9) | ||
| G05 | 0.9(0.2) | 1501.9(25.6) | 213.5(78.8) | 210.6(90.3) | ||
| G05 | 5.0(0.6) | 1017.8(3.4) | 56.6(8.2) | 300.9(57.0) | ||
| G05 | 27.6(0.9) | 1115.8(0.4) | 25.5(1.0) | 748.3(37.4) | ||
| IR 10173+0828 | D10 | (2.2) | ||||
| NGC 3227 | D10 | (2.1) | ||||
| NGC 3627 | D10 | (0.8) | ||||
| D10 | (0.3) | |||||
| NGC 3628 | D10 | 8.5(1.1) | 826.4 | 384.0 | 1295.6(191.7) | |
| G10 | 4.1(0.9) | 725.9(11.5) | 87.7(25.5) | 381.7(137.8) | ||
| G10 | 5.8(0.6) | 875.4(11.4) | 153.8(29.0) | 954.9(206.4) | ||
| D10 | 2.5(0.4) | 900.7 | 210.8 | 209.4(43.2) | ||
| G10 | 1.7(0.2) | 886.5(6.4) | 119.1(16.0) | 217.1(37.6) | ||
| NGC 3690 | D10 | (0.8) | ||||
| D10 | (0.4) | |||||
| NGC 4631 | D10 | (0.3) | ||||
| NGC 4736 | D10 | (0.8) | ||||
| Mrk 231 | D10 | (0.7) | ||||
| D10 | (0.4) | |||||
| NGC 5005 | D10 | (0.7) | ||||
| IC 860 | D10 | 5.5(1.2) | 3921.1 | 315.8 | 501.5(185.3) | |
| G10 | 3.6(0.6) | 3889.1(9.3) | 117.5(22.0) | 449.5(111.3) | ||
| D10 | 1.2(0.2) | 3879.8 | 215.0 | 128.9(17.3) | ||
| G10 | 1.1(0.1) | 3877.9(3.6) | 108.8(8.6) | 130.9(13.6) | ||
| NGC 5194 | D20 | 1.7(0.3) | 369.7 | 434.5 | 222.8(67.3) | |
| G20 | 0.8(0.2) | 403.9(30.9) | 267.7(81.1) | 237.2(89.8) | ||
| D10 | (0.3) | |||||
| M 83 | D10 | 3.0(0.8) | 510.0 | 181.0 | 167.6(67.1) | |
| G10 | 1.7(0.5) | 522.6(15.6) | 104.3(39.2) | 192.3(93.1) | ||
| D10 | 1.5(0.3) | 494.6 | 152.1 | 117.6(21.1) | ||
| G10 | 1.1(0.2) | 507.2(8.7) | 109.2(24.0) | 129.9(34.9) | ||
| Mrk 273 | D10 | 4.7(1.5) | 11521.7 | 171.6 | 216.6(120.3) | |
| G10 | 2.5(0.8) | 11505.0(15.5) | 95.3(38.2) | 253.0(131.2) | ||
| D10 | (0.4) | |||||
| NGC 5457 | D10 | (0.9) | ||||
| D10 | (0.4) | |||||
| IR 15107+0724 | D10 | 5.3(1.0) | 3888.1 | 391.9 | 714.0(190.1) | |
| G10 | 3.7(0.3) | 3888.4(8.0) | 182.0(19.1) | 713.5(98.5) | ||
| D10 | 3.7(0.4) | 3912.3 | 368.6 | 506.7(75.5) | ||
| G10 | 2.7(0.2) | 3908.6(5.7) | 179.3(13.7) | 508.9(51.2) | ||
| Arp 220 | D20 | 5.5(0.7) | 5483.5 | 531.2 | 1323.3(171.3) | |
| G20 | 5.1(0.4) | 5352.3(7.0) | 154.1(18.2) | 842.1(116.7) | ||
| G20 | 3.2(1.0) | 5487.2(6.7) | 59.5(19.9) | 200.4(92.0) | ||
| G20 | 1.7(0.4) | 5596.0(38.8) | 175.6(86.4) | 316.9(168.8) | ||
| D20 | 4.1(0.4) | 5405.0 | 544.5 | 1012.2(89.7) | ||
| G20 | 3.5(0.9) | 5318.0(24.7) | 136.9(29.6) | 505.4(167.7) | ||
| G20 | 3.2(0.7) | 5443.1(25.5) | 137.6(42.7) | 474.5(181.5) | ||
| G20 | 0.5(0.2) | 5607.4(29.1) | 85.4(76.7) | 41.1(42.9) | ||
| NGC 6240 | D20 | 1.9(0.6) | 7309.8 | 392.8 | 354.3(101.8) | |
| G20 | 1.5(0.3) | 7309.5(26.7) | 260.4(70.2) | 401.1(136.7) | ||
| D10 | (0.4) | |||||
| IR 17208-0014 | D10 | (1.2) | ||||
| D10 | (0.9) | |||||
| IR 17468+1320 | D10 | (1.5) | ||||
| NGC 6701 | D10 | (1.4) | ||||
| D10 | (0.5) | |||||
| NGC 6921 | D20 | 3.4(0.6) | 3960.7 | 609.9 | 1012.7(182.8) | |
| G20 | 2.8(0.3) | 3995.4(20.1) | 364.4(52.0) | 1087.9(196.5) | ||
| D10 | (0.4) | |||||
| NGC 6946 | D10 | 2.7(0.7) | 51.2 | 275.9 | 269.2(95.5) | |
| G10 | 1.7(0.5) | 11.6(6.8) | 44.4(16.4) | 78.5(37.4) | ||
| G10 | 2.7(0.4) | 81.2(5.0) | 64.5(12.4) | 185.0(45.9) | ||
| D10 | 1.1(0.3) | 36.0 | 209.6 | 94.0(28.0) | ||
| G10 | 0.7(0.1) | 4.7(5.7) | 74.5(15.2) | 58.0(14.6) | ||
| G10 | 0.9(0.2) | 77.9(3.2) | 34.4(7.7) | 32.4(9.2) | ||
| IC 5179 | D10 | (1.9) |
| Galaxy | Transitionbb Transitions in italics reanalyzed and/or amended with new measurements from those presented in Mangum et al. (2008). | Fitcc Gnn / Dnn Gaussian / Direct measurement results with nn km/s gaussian spectral smoothing. | vheld,ed,efootnotemark: | FW(HM/ZI)e,fe,ffootnotemark: | Tdvgg Derived from direct integration of line profile. | |
|---|---|---|---|---|---|---|
| (mK) | (km s-1) | (km s-1) | (mK km s-1) | |||
| NGC 7331 | D10 | (0.7) | ||||
| D10 | (0.5) | |||||
| NGC 7479 | D10 | (1.1) | ||||
| IR 233653604 | D10 | (1.0) | ||||
| D10 | (0.3) | |||||
| Mrk 331 | D10 | (1.2) |


4.2. OH and H111
Table 3 lists and Figures 6 and 7 show our measured OH and ( K above ground) and H111 radio recombination line results. We report new detections of these OH and H111 transitions toward nine galaxies, while updated analysis is presented for OH and H111 detections quoted for four galaxies presented in Mangum et al. (2008). For each OH and H111 detection we list the same quantities in Table 3 as derived for our H2CO spectra in Table 2.
Toward most of our galaxies we did not detect the OH or H111 transitions. The RMS noise values for our OH 4765 and 4750 MHz and H111 measurements of the undetected galaxies are listed in Table 4.
Rotationally excited OH has been used as a tracer of the molecular environment within AGN (Henkel et al., 1986, 1987; Henkel & Wilson, 1990; Impellizzeri et al., 2006). AGN come in two main types: those with (type 1) and those without (type 2) broad optical atomic line emission. In the unified scheme of active galactic nuclei, all AGN are intrinsically similar, with the observed differences in type due to orientation/observer perspective. In the framework of a common paradigm a significant column density of molecular material, in the form of a parsec-scale torus, obscures our view of the AGN in type 2 objects. Attempts to detect the obscuring molecular material using measurements of molecular absorption or emission have yielded few confirmations (e.g. Schmelz et al., 1986; Baan & Haschick, 1992; Staveley-Smith et al., 1992). While the existence of molecular AGN tori is confirmed by H2O megamaser emission in some objects (Lo, 2005; Reid et al., 2009), other tracers like OH in the ground rotational transitions at 1.7 GHz trace gas at larger galactocentric distance (e.g. Pihlström et al., 2001; Klöckner et al., 2003; Klöckner & Baan, 2004). Before concluding that parsec-scale tori are rarely molecular, however, we should note that radiative excitation effects, in which coupling to the nonthermal continuum can suppress the opacity in the lowest transitions, may strongly affect the shape of a molecular spectral energy distribution (SED). To explore this effect, detailed measurements of rotationally-excited OH lines (see also Impellizzeri et al., 2006) may be worthwhile. Before obtaining interferometric high resolution measurements, however, it first has to be demonstrated that the lines are detectable. This is shown in Figure 6. The observed OH line widths for the nine galaxies detected in our sample are similar, though slightly larger, than those obtained in H2CO, suggesting a similar dynamical origin for the OH and H2CO emitting regions. Note, though, that similarity in galaxy-scale (i.e.large) line width does not uniquely associate the physical regions from which these molecular emission lines originate. Viable alternate mechanisms which can produce similarly large line widths include shocked gas, turbulence, and mixture of outflowing material with gas motions. Apparent optical depths for each of the OH and H2CO line region measurements range from 0.04 (Arp 220) to 0.22 (IC 860), suggesting optically thin absorption.
Among the eight sources with detected rotationally-excited OH absorption, a total of five (IR 014181651 (alias IIIZw 35), IC 860, IR 151070724, Arp 220, and IR 172080014) are well known (Ultra)Luminous Infrared Galaxies ((U)LIRGs) with prominent OH maser or megamaser emission (e.g. Baan, 1989; Henkel & Wilson, 1990; Baan et al., 1992). The combination of ground state maser emission and OH absorption in the rotationally excited level is likely a consequence of the strong infrared radiation field (e.g. Henkel et al., 1986, 1987; Lockett & Elitzur, 2008; Willett et al., 2011). We are not aware of any 18 cm OH detections towards IR 174681320, NGC 7331, and IR 233653604 (e.g. Baan et al., 1992) so that these cases are less constrained.
| Galaxy | Transitionaa Transitions in italics reanalyzed from measurements presented in Mangum et al. (2008). | bb RMS noise levels are for 20 km s-1 channels. | vhel | FWZI |
|---|---|---|---|---|
| (mK) | (km s-1) | (km s-1) | ||
| NGC 253 | H111 | 17.6(1.7) | 219.3(3.8) | 183.5(9.0) |
| IR 01418+1651 | OH4750 | 8236.8(5.3) | 198.6(12.5) | |
| OH4765 | 8284.1(10.0) | 312.5(23.9) | ||
| M 82 | 21.6(2.0) | 119.0(6.5) | 107.5(13.2) | |
| 16.4(1.2) | 271.3(11.8) | 161.8(27.1) | ||
| M 82SW | H111 | 22.3(1.2) | 120.5(3.2) | 109.0(8.1) |
| 9.0(1.3) | 291.4(7.9) | 108.2(20.8) | ||
| IC 860 | OH4750 | 3856.0(7.1) | 132.0(17.1) | |
| OH4765 | (0.8) | |||
| M 83 | H111 | 2.2(0.6) | 491.8(12.3) | 135.9(30.1) |
| IR 15107+0724 | OH4750 | 3891.4(9.6) | 190.3(24.4) | |
| OH4765 | 3910.5(13.2) | 203.6(35.9) | ||
| Arp 220 | OH4750cc Arp 220 OH4750 spectrum shown in Mangum et al. (2008) was mis-scaled by a factor of 1.97. | 5432.5(2.2) | 277.6(5.4) | |
| OH4765 | 5458.5(4.5) | 314.9(11.2) | ||
| IR 17208-0014 | OH4750 | 12835.6(12.4) | 250.1(32.1) | |
| OH4765 | (0.7) | |||
| IR 17468+1320 | OH4750 | 4737.9(7.0) | 341.5(16.7) | |
| OH4765 | (1.34) | |||
| NGC 7331 | OH4750 | 881.1(6.1) | 153.8(14.6) | |
| OH4765 | (0.64) | |||
| IR 23365+3604 | OH4750 | 19284.6(12.7) | 398.2(35.1) | |
| OH4765 | (0.66) |
| Galaxy | RMSa,ba,bfootnotemark: | ||
|---|---|---|---|
| OH 4765 | OH 4750 | H111 | |
| (mK) | (mK) | (mK) | |
| NGC 253 | 3.15 | 1.95 | Emis |
| IC 1623 | 0.91 | 0.80 | 0.94 |
| NGC 520 | 0.81 | 0.78 | 0.74 |
| NGC 598 | 0.68 | 0.67 | 0.70 |
| NGC 604 | 1.22 | 1.13 | 1.23 |
| NGC 660 | 0.79 | 0.80 | 0.76 |
| IR 01418+1651 | Abs | Abs | 0.85 |
| NGC 695 | 0.54 | 0.80 | 0.55 |
| Mrk 1027 | 0.97 | 0.95 | 1.02 |
| NGC 891 | 0.94 | 0.90 | 0.82 |
| NGC 925 | 0.99 | 1.02 | 1.07 |
| NGC 1022 | 0.96 | 0.90 | 0.99 |
| NGC 1055 | 0.80 | 0.80 | 0.91 |
| Maffei 2 | 1.24 | 1.12 | 1.19 |
| NGC 1068 | 2.73 | 3.72 | 4.22 |
| UGC 02369 | 0.96 | 0.96 | 0.89 |
| NGC 1144 | 0.78 | 0.90 | 0.73 |
| NGC 1365 | 1.53 | 0.55 | 1.44 |
| IR 03359+1523 | 1.17 | 1.22 | 1.10 |
| IC 342 | 1.66 | 1.24 | 1.90 |
| NGC 1614 | 1.14 | 1.26 | 1.09 |
| VIIZw31 | 1.03 | 0.71 | 1.07 |
| NGC 2146 | 2.33 | 0.97 | 3.18 |
| NGC 2623 | 0.83 | 0.82 | 0.91 |
| NGC 2903 | 0.42 | 0.46 | 0.52 |
| Arp 55 | 1.67 | 1.63 | 1.68 |
| UGC 05101 | 1.09 | 1.09 | 1.15 |
| M 82 | 3.24 | 3.81 | Emis |
| M 82SW | 3.63 | 3.63 | Emis |
| NGC 3079 | 2.55 | 1.00 | 7.61 |
| IR 10173+0828 | 1.61 | 1.68 | 1.81 |
| NGC 3227 | 2.42 | 1.86 | 3.28 |
| NGC 3627 | 0.55 | 0.70 | 0.71 |
| NGC 3628 | 0.94 | 0.96 | 0.83 |
| NGC 3690 | 2.11 | 1.87 | 0.49 |
| Mrk 231 | 1.39 | 1.42 | 1.26 |
| IC 860 | Abs | 0.83 | 0.90 |
| NGC 5194 | 0.36 | 0.36 | 0.39 |
| M 83 | 0.70 | 0.66 | Emis |
| Mrk 273 | 3.63 | 2.15 | 4.05 |
| NGC 5457 | 0.54 | 0.70 | 0.55 |
| IR 15107+0724 | Abs | Abs | 0.63 |
| Arp 220 | Abs | Abs | 0.91 |
| NGC 6240 | 0.95 | 0.95 | 0.89 |
| IR 17208-0014 | Abs | 0.66 | 0.81 |
| IR 17468+1320 | 1.34 | Abs | 1.28 |
| NGC 6701 | 0.87 | 0.84 | 0.60 |
| NGC 6921 | 0.80 | 0.93 | 0.88 |
| NGC 6946 | 0.55 | 0.56 | 0.52 |
| IC 5179 | 1.50 | 1.87 | 1.86 |
| NGC 7331 | Abs | 0.64 | 0.70 |
| NGC 7479 | 1.17 | 0.87 | 1.10 |
| IR 23365+3604 | Abs | 0.66 | 0.67 |
| Mrk 331 | 0.68 | 0.72 | 0.64 |


4.3. Continuum Emission
Table 5 lists our measured continuum levels derived from the mean zero-level offset of our spectroscopic measurements. Note that for galaxies whose flux measurements were presented in Mangum et al. (2008) we have reanalyzed those flux measurements and have taken a mean of the baseline rather than just the central channel offset333In Mangum et al. (2008) the “central channel offset” was derived by fitting a polynomial to the spectral baseline and capturing the central channel value from that baseline (continuum) fit. for the flux measurement. Differences between our derived continuum fluxes and those quoted in Mangum et al. (2008) are with one exception less than 2% for our 4.8 GHz measurements, the one exception being NGC 3079 where the difference is 15%. For our 14.5 GHz continuum measurements the differences are less than 15%.
For most of the galaxies in our sample the measured continuum fluxes agree with those quoted in Araya et al. (2004), Baan et al. (1990), and the NED archive. Exceptions to this agreement are shown in italic in Table 5. Continuum emission from starburst galaxies at these frequencies emits as a power law with spectral index (S). Likely emission mechanisms at the frequencies of our GBT observations include synchrotron emission () and free-free emission ( to ). The GBT fluxes listed in Table 5 suggest that the centimeter-wavelength emission from the majority of the starburst galaxies in our sample is produced via synchrotron emission, though several galaxies, including NGC 1055 and UGC 05101, appear to have flat spectra suggestive of free-free emission.
| Galaxy | 4.8 GHz | 14.5 GHz | ||||
|---|---|---|---|---|---|---|
| GBTa,ba,bfootnotemark: | AreciboccThe Arecibo 4.8 GHz continuum levels were obtained from spectral baselines by Araya et al. (2004), their Table 1.,140ftdd Heliocentric optical velocity frame. | NED | GBTa,ba,bfootnotemark: | 140ftddThe NRAO 140′ 4.8 and 14.5 GHz continuum levels from Baan et al. (1990), their Table 1. | NED | |
| (Jy) | (Jy) | (Jy) | (Jy) | (Jy) | (Jy) | |
| NGC 55 | PM | 0.150–0.197 | 0.003 | |||
| NGC 253 | 1.771 | 1.20 | 2.0–2.5 | 0.522 | 0.37 | |
| IC 1623 | 0.077 | 0.096 | ||||
| NGC 520 | 0.081 | 0.079 | 0.087–0.126 | 0.033 | ||
| NGC 598 | PM | 1.300 | 0.002 | |||
| NGC 660 | 0.151 | 0.140 | 0.156-0.232 | 0.288 | ||
| IR 01418+1651 | 0.031 | 0.028 | 0.018 | |||
| NGC 695 | 0.024 | 0.041 | 0.011 | |||
| Mrk 1027 | 0.021 | |||||
| NGC 891 | 0.319 | 0.194–0.342 | 0.101 | |||
| NGC 925 | 0.030 | |||||
| NGC 1022 | 0.031 | 0.171 | ||||
| NGC 1055 | 0.068 | 0.063–0.086 | 0.058 | |||
| Maffei 2 | 0.276 | 0.243–0.375 | ||||
| NGC 1068 | 1.680 | 1.770–2.187 | 0.555 | 0.680 | ||
| UGC 02369 | 0.112 | |||||
| NGC 1144 | 0.062 | 0.052 | 0.011 | |||
| NGC 1365 | 0.235 | 0.180–0.230 | 0.052 | |||
| IR 03359+1523 | 0.016 | |||||
| IC 342 | 0.086 | 0.080–0.277 | 0.050 | |||
| NGC 1614 | 0.072 | 0.063 | ||||
| VIIZw31 | 0.032 | 0.015 | ||||
| NGC 2146 | 0.389 | 0.223 | 0.30 | |||
| NGC 2623 | 0.061 | 0.064 | 0.057–0.073 | 0.009 | ||
| Arp 55 | 0.039 | |||||
| NGC 2903 | 0.115 | 0.041 | 0.118–0.180 | 0.019 | ||
| UGC 05101 | 0.054 | 0.077 | 0.048 | |||
| M 82 | 3.233 | 3.55 | 3.67–3.96 | 1.304 | 1.79 | 1.73 |
| M 82SW | 1.128 | |||||
| NGC 3079 | 0.342 | 0.33 | 0.32 | 0.159 | 0.14 | |
| IR 10173+0828 | PM | 0.020 | ||||
| NGC 3227 | 0.559 | 0.008 | 0.045 | |||
| NGC 3627 | 0.121 | |||||
| NGC 3628 | 0.186 | 0.131,0.33 | 0.222–0.283 | 0.043 | 0.11 | |
| NGC 3690 | 0.321 | 0.362–0.407 | 0.115 | |||
| NGC 4631 | 0.299-0.438 | 0.033 | ||||
| NGC 4736 | 0.090–0.119 | 0.022 | ||||
| Mrk 231 | 0.321 | 0.417 | 0.129 | |||
| NGC 5005 | 0.060 | 0.001 | ||||
| IC 860 | 0.010 | 0.042 | 0.031 | |||
| NGC 5194 | 0.150 | 0.215–0.436 | 0.023 | |||
| M 83 | 0.322 | 0.648–0.780 | 0.071 | |||
| Mrk 273 | 0.012 | 0.070–0.103 | 0.028 | |||
| NGC 5457 | 0.023 | 0.013 | ||||
| IR 15107+0724 | 0.017 | 0.031 | 0.021 | |||
| Arp 220 | 0.217 | 0.172,0.22 | 0.22 | 0.082 | 0.11 | |
| NGC 6240 | 0.141 | 0.178 | 0.035 | |||
| IR 17208-0014 | 0.071 | 0.062 | 0.068 | 0.028 | ||
| IR 17468+1320 | 0.190 | 0.047 | ||||
| NGC 6701 | 0.025 | 0.022 | 0.008 | |||
| NGC 6921 | 0.028 | 0.027 | 0.035 | |||
| NGC 6946 | 0.167 | 0.219–0.531 | 0.030 | |||
| IC 5179 | PM | 0.079 | ||||
| NGC 7331 | 0.095 | 0.040 | 0.070–0.096 | 0.007 | ||
| NGC 7479 | 0.038 | 0.040 | ||||
| IR 23365+3604 | 0.015 | 0.010 | 0.001 | |||
| Mrk 331 | 0.028 | 0.025 | 0.028 | |||
5. Analysis
5.1. Comparison to Previous Measurements
In the following we list previous measurements of the H2CO emission in galaxies where we have detected the H2CO or transitions. We also present a re-evaluation of our reported detection of H2CO emission in UGC 05101 (Mangum et al., 2008) which we now believe is a non-detection. Where available, we also list measurements of high spatial density molecular tracers in these galaxies.
NGC 253: As noted in Mangum et al. (2008), the 4.8 and 14.5 GHz H2CO transitions have previously been detected in absorption (Gardner & Whiteoak, 1974; Baan et al., 1990). Our GBT detection of the transition (Figure 2) is significantly different in shape from the line profile reported by Gardner & Whiteoak (1974). Baan et al. (1997) have used the Very Large Array to image the transition, measuring an absorption structure with FWHM size . The peak integrated flux measured by Baan et al. (1997) of Jy beam-1 km s-1 is about 60% of the integrated flux we measure, suggesting that some extended structure detected in our GBT observations is missing in these interferometric measurements. Previous CS, H2CO, NH3 and high-J CO measurements (Baan et al., 1990, 1997; Hüttemeister et al., 1997; Ott et al., 2005; Güsten et al., 2006; Martín et al., 2006; Bayet et al., 2009) estimate spatial densities in the range cm-3, which compares favorably to the cm-3 we measure (Table 6).
NGC 520: Araya et al. (2004) first detected the H2CO transition in absorption, in good agreement with the GBT transition properties (Figure 1). Our non-detection of H111 (RMS mJy in v km s-1) is consistent with the mJy detection of H110 reported by Araya et al. (2004). Interferometric measurements of the CO J= emission from NGC 520 by Sanders et al. (1988) and Yun & Hibbard (2001) reveal kpc-scale structures over a region in extent.
NGC 660: Our GBT detection of the H2CO transition in absorption (Figure 2) is similar in both intensity and velocity extent as that reported by Baan et al. (1986), while our detection of the H2CO transition is the first reported. Aalto et al. (1995) measured the 12CO J=, ; 13CO J=, ; C18O J=; and HCN J= emission, while Israel (2009) measured the 12CO J=, , , and 13CO J=, , and emission from this galaxy. From CO J= (Aalto et al., 1995) and (Israel, 2009) images these studies derived a source diameter of .
NGC 891: Our absorption measurement was reported in Mangum et al. (2008) (Figure 1). García-Burillo & Guélin (1995) measured the CO J= and emission toward this edge-on galaxy. The emission is extended along the galactic disk to spatial scales , but is mainly concentrated in a nuclear condensation in extent.
Maffei 2: Images of the CO J=, , and CS J= emission (Kuno et al., 2008), 13CO and C18O J= and and HCN J= emission (Meier et al., 2008), and NH3 (1,1) and (2,2) emission (Lebrón et al., 2011) all point to a two- to four-component structure of the central bar in this nearby spiral galaxy. These studies indicate dense gas structures with spatial densities and kinetic temperatures cm-3 and T K, respectively. High-excitation NH3 (6,6) measurements (Mauersberger et al., 2003) have uncovered a high-temperature (T K) component in this galaxy. Our detections of H2CO and absorption (Figure 2) are the first reported measurements of H2CO in this galaxy. The K-doublet H2CO spectra are clearly composed of two velocity components at (component “C1”) and km s-1 (component “C2”), consistent with previous studies (Mauersberger et al., 2003).
NGC 1144: Gao & Solomon (2004a) reported broad yet weak CO and HCN J= emission (T 50 and 2 mK, respectively) toward this Seyfert galaxy. Our detection of broad H2CO absorption (Figure 1) which decomposes into three velocity components is consistent with the HCN J= spectra reported by Gao & Solomon (2004a). There do not appear to be any imaging studies of the dense gas in this galaxy.
NGC 1365: Baan et al. (2008) report single-position J= CO, HCN, HNC, HCO+, N= CN, J= CO, J= CS, and N= CN observations with resolutions ranging from to from this barred spiral galaxy. Pérez-Beaupuits et al. (2007) report HCN J= emission in addition to the J= and J= transitions of CO, HCN, HNC, and N= and N= transitions of CN. Gao & Solomon (2004a) report relatively bright (160 and 8 mK, respectively) and extended CO and HCN J= emission from this galaxy, while Sandqvist (1999) mapped the CO J= emission and found extended ( FWHM) structure dominated by a circumnuclear molecular torus (). Our detection of weak H2CO absorption (Figure 1) is consistent with these previous molecular tracer measurements.
IC 342: The absorption measurements in H2CO and reported in Mangum et al. (2008) were new detections of these K-doublet transitions (Figure 2). Previous millimeter-wavelength H2CO measurements (Hüttemeister et al., 1997; Meier & Turner, 2005; Meier et al., 2011) estimate spatial densities in the range cm-3. High-excitation NH3 (6,6) emission toward this galaxy (Mauersberger et al., 2003) points to the presence of high kinetic temperatures. HCN J= images (Downes et al., 1992) resolve IC 342 into five condensations with sizes ranging from to over a region in extent.
NGC 2146: The relatively intense CO and HCN J= emission (800 and 30 mK, respectively) measured by Gao & Solomon (2004a) is consistent with our detections of H2CO and absorption (Figure 3), the first reported detection of this molecule in this galaxy. Greve et al. (2006) imaged the 12CO J= and J= and 13CO J= emission from this barred spiral galaxy, measuring a disk-like structure in extent.
UGC 05101: This was reported as a new detection of the transition in emission in Mangum et al. (2008). Additional measurements, though, have thrown this assignment into question as we do not see consistent results between our 2006 (reported in Mangum et al., 2008) and our new 2013 measurements. We now believe that neither the nor the transitions have been detected in this galaxy.
M 82: The morphology of M 82’s molecular ISM is characterized by a double-lobed structure (Mao et al., 2000). Seaquist, Lee, & Moriarty-Schieven (2006) imaged the CO J= emission from this galaxy, finding emission extended over a disk-like structure in extent. H2CO was previously detected in absorption in the line by Graham et al. (1978), in emission in the and (218 GHz) lines by Baan et al. (1990), and in emission in the (146 GHz), and / (218 GHz) lines by Mühle et al. (2007). We detect both the 4.8 and 14.5 GHz lines in absorption with high confidence (Figure 3). Investigation of our LVG model predictions of the relative intensities of the 4.8 and 14.5 GHz emission (see §5.3) cannot reproduce the 14.5 GHz emission observed by Baan et al. (1990). The H110 and H111 lines, as well as other higher frequency hydrogen radio recombination lines, have been detected in M 82 (Seaquist, Bell, & Bignell, 1981; Bell et al., 1984; Rodriguez-Rico et al., 2004). We re-detect the H111 line and confirm the two components identified by Bell et al. (1984). Previous CS and H2CO measurements (Baan et al., 1990; Hüttemeister et al., 1997) estimate spatial densities in the range cm-3.
Recent Herschel-SPIRE imaging spectroscopic measurements of the molecular emission toward M 82 (Kamenetzky et al., 2012) have characterized the physical conditions in this galaxy using measurements of 12CO and 13CO emission over a wide range of molecular excitation. By using a LVG radiative transfer model with Bayesian likelihood analysis of the J= through J= 12CO and 13CO emission toward M 82 Kamenetzky et al. (2012) confirmed the existence of two temperature components (Panuzzo et al., 2010): A cool component with median TK = 35 K (1- range 12–385 K) and n(H2) = cm-3 (1- range – cm-3) and a warm component with median TK = 436 K (1- range 344–548 K) and n(H2) = cm-3 (1- range – cm-3). Our H2CO measurements clearly correspond to the cool component measured by Kamenetzky et al. (2012), with our derived spatial density of n(H2) = cm-3 overlapping at the high-density limit of their derived 1- range.
We also measure a position offset of (,) arcsec from the nominal M 82 position in the H2CO transition only, which we refer to as M 82SW (Figure 3). This is the “P3” HCN J= peak position noted by Brouillet & Schilke (1993), and corresponds to within of the “southwestern molecular lobe” where NH3 emission was detected in this galaxy (Weiß et al., 2001). M 82SW appears to be stronger in H2CO emission than the nominal galaxy center position (Table 2), but note that the spatial resolution of our H2CO measurements ( and ) allows for some sampling of both components in all of our M 82 measurements. In the NH3 measurements of M 82 (Mangum et al., 2013) only the M 82SW position possesses detectable NH3 emission, and is the source of the kinetic temperature assumed in our LVG analysis (§5.3).
NGC 3079: Reported as a nondetection in Mangum et al. (2008), additional integration resulted in a detection of the line (Figure 3), consistent with the absorption line reported by Baan et al. (1986, mJy). Pérez-Beaupuits et al. (2007) detect CO J= and J=, CN N= and , and HCN and HNC J= and J= emission from the nucleus of this galaxy. From the HCN J= image presented by Kohno et al. (2000) Pérez-Beaupuits et al. (2007) derive a source size of . 450 m, 850 m (Stevens & Gear, 2000), and 1200 m continuum imaging reveals an unresolved core in extent.
NGC 3079 is one of two galaxies in our sample which shows complex absorption and emission structure in its H2CO spectrum. The and transitions are dominated by velocity components at and km s-1 (which is the systemic velocity), with the transition exhibiting a tentative third broad component at km s-1. The two velocity components which are apparent in both H2CO transitions are detected in CH3OH, OH, and HI (Impellizzeri et al., 2008). The excitation characteristics of these three velocity components differ dramatically:
-
•
1010 km s-1 Component (C1): emission with absorption suggests high spatial density. In subsequent discussion we refer to this as component 1 (C1).
-
•
1115 km s-1 Component (C2): Complex emission and absorption spectral structure suggesting that this component has a spatial density and kinetic temperature which lies near the point where the transition goes from absorption to emission. This spectral structure with absorption suggests lower spatial density than the 1010 km s-1 component. In subsequent discussion we refer to this as component 2 (C2).
-
•
1500 km s-1 Component (C3): Only detected in broad absorption at 4.5 confidence in peak intensity. In subsequent discussion we refer to this as component 3 (C3). We are not aware of corresponding spectral line detections of the 1500 km s-1 component in other high density molecular tracers (though the CO emission toward NGC 3079 includes this velocity; Figure 3).
NGC 3628: The transition was detected in absorption by Baan et al. (1986, 1990) and confirmed by Araya et al. (2004), while the transition was not detected by Baan et al. (1990). The GBT line properties show good agreement with those measured by both Baan et al. (1986, S = mJy) and Araya et al. (2004, S = mJy) to within the calibration uncertainties (Figure 4). Israel (2009) measured the 12CO J=, J=, J=, J= and 13CO J=, J=, and J= emission from this galaxy. From their CO J= map one notes that the source size is . 450 m and 850 m continuum imaging (Stevens et al., 2005) expose a core.
IC 860: The emission line was detected by Baan et al. (1993) and Araya et al. (2004), and the GBT detection shows good agreement in line properties (Figure 4). Our discovery of H2CO absorption is a new result. resolution CO J= and emission measurements Yao & Seaquist (2003) provide an estimate of the maximum source size.
NGC 5194 (M51): The “Whirlpool Galaxy” is a well-studied Sbc galaxy with a weak AGN. The inner 2.′5 of this galaxy have been imaged in a variety of molecular tracers, including CO, 13CO, and C18O J= (Kohno et al. (1996); Aalto et al. (1999)), CO J= (Schinnerer et al., 2010), and HCN and HCO+ J= (Kohno et al. (1996); Schinnerer et al. (2010)). These dense gas studies have revealed structure associated with the nearly face-on spiral arms down to spatial scales pc. Our H2CO absorption measurement (Figure 1) is the first reported detection of H2CO in this galaxy.
M 83: Both H2CO transitions are detected in absorption, with the 14.5 GHz transition showing a significantly larger optical depth than the 4.8 GHz transition (Figure 4). CO J= and emission imaging of this barred starburst galaxy (Sakamoto et al., 2004) indicates a structure.
Mrk 273: Imaged in CO J= by Wilson et al. (2008). Based on these Wilson et al. (2008) measurements Iono et al. (2009) derive a deconvolved CO J= source size of . Graciá-Carpio et al. (2008) measured moderately intense HCN and HCO+ J= and , along with CO J= emission from this ULIRG. Furthermore, Herschel has detected OH emission due to outflows from this galaxy (Fischer et al., 2010). Our H2CO absorption measurement is the first reported measurement of H2CO in this galaxy (Figure 1).
IR 15107+0724: Our measurement is consistent with that reported by Baan et al. (1993) and Araya et al. (2004). We also detect the line in absorption (Figure 4). Planesas et al. (1991) imaged the CO J= emission from this galaxy, deriving a compact nuclear source with size .
Arp 220/IC 4553: The H2CO transition was detected in emission by Baan et al. (1986), but the line was not subsequently detected (Baan et al., 1990). We find good agreement between our GBT measurement (Figure 5) and the total integrated intensity of the sub-arcsecond resolution interferometric measurements reported by Baan & Haschick (1995). Our 4.8 and 14.5 GHz GBT spectra are consistent with those reported by Araya et al. (2004). Note also that previous studies (Baan et al., 1986) have suggested that H2CO emission is produced by maser amplification in this galaxy. In Mangum et al. (2008) we argued that, to the contrary, the emission in Arp 220 is simply the signature of a dense gas component in this ULIRG.
Mangum et al. (2008) summarized the previous molecular spectral line measurements of Arp 220. Of particular note is the dichotomy between the relative intensities of various dense gas tracers from the two nuclei which comprise this merging system. As noted by Greve et al. (2009), this dichotomy reflects differing spatial densities in these two components: the western component possessing lower spatial densities, the eastern component possessing higher spatial densities. Our H2CO measurements partially reflect this trend. Both H2CO transitions can be fit with velocity components at and km s-1, likely corresponding to the western and eastern velocity components noted previously. We also find an indication of a third component at km s-1. We are not aware of corresponding spectral line detections of this km s-1 velocity component in other molecular species.
Recent Herschel-SPIRE imaging spectroscopic measurements of the molecular emission toward Arp 220 (Rangwala et al., 2011) have characterized the physical conditions in this galaxy using measurements of 12CO and HCN emission over a wide range of molecular excitation. By using a radiative transfer model with Bayesian likelihood analysis of the J= through J= 12CO emission toward Arp 220 Rangwala et al. (2011) derived two temperature components: A cool component with median TK = 50 K (1- range 34–67 K) and n(H2) = cm-3 (1- range – cm-3) and a warm component with median TK = 1343 K (1- range 1247–1624 K) and n(H2) = cm-3 (1- range – cm-3). A similar LVG radiative transfer and Bayesian likelihood analysis of the HCN J= through J= emission yielded a single-temperature fit with T K and n(H2) cm-3. Our H2CO-derived spatial density (n(H2) = cm-3) and NH3-derived kinetic temperature (Tk = K) correspond most closely to the spatial density and kinetic temperature derived from the Rangwala et al. (2011) HCN measurements, though are slightly lower in both quantities (see Table 6). The cool and warm components derived from the Rangwala et al. (2011) CO analysis do not correspond to any physical components in our H2CO or NH3 measurements, suggesting that the contribution to the CO emitting gas in Arp 220 from high spatial density components is small.
NGC 6240: Our GBT detection of the transition in absorption (Figure 1; 5.2 in a single smoothed 20 km s-1 channel) is not consistent with the emission reported by Baan et al. (1993). As noted by Mangum et al. (2008), our spectrum peaks near 7300 km s-1, slightly blueshifted relative to the systemic velocity of 7359 km s-1 (Greve et al., 2009). CO J= images (Bryant & Scoville, 1999) indicate a molecular gas source size of . NGC 6240 has also been imaged in CO J= and HCO+ J= by Wilson et al. (2008). Based on the Wilson et al. (2008) measurements Iono et al. (2009) derive a deconvolved CO J= source size of . The HCO+ J= image presented by Wilson et al. (2008) suggests a source size .
NGC 6921: Gao & Solomon (2004a) measure very weak CO and HCN J= ( and 1 mK, respectively) emission toward this spiral galaxy. We are not aware of any spectral line imaging measurements of this galaxy at radio wavelengths. Somewhat surprisingly, given the low intensity of the HCN J= measurement, we detect significant H2CO absorption toward this galaxy (Figure 1). As the 4.8 GHz continuum flux is measured to be only 28 mJy toward this galaxy, H2CO absorption of a strong background continuum source does not provide a mechanism for producing significant H2CO absorption. The H2CO absorption we measure is clearly absorbing the cosmic microwave background.
NGC 6946: In Mangum et al. (2008) we reported the discovery of the H2CO transition in absorption. We add to this the H2CO transition, also in absorption (Figure 5). Schinnerer et al. (2006) and Schinnerer et al. (2007) imaged the CO J=, J=, and HCN J= emission from this galaxy, detecting a compact nuclear source size of and a “nuclear spiral” structure in size.
5.2. H2CO Apparent Optical Depth Calculations
The apparent peak optical depths (, see Equation 2 of Mangum et al., 2008) for our H2CO absorption measurements (Table 2) have been calculated using the GBT continuum emission intensities listed in Table 5 and assuming T Tc. With the exception of NGC 6921, which has an optical depth of , all of the other galaxies detected in H2CO in our sample have optical depths , indicating optically-thin H2CO emission.
5.3. Spatial Density and Column Density Derivation Using LVG Models
As was done in Mangum et al. (2008), to derive the H2 spatial density (number density) and H2CO column density of the dense gas in our galaxy sample, we use a Large Velocity Gradient (LVG) model (Sobolev, 1960) to calculate the radiative transfer properties of the H2CO transitions. The detailed properties of our implementation of the LVG approximation are described in Mangum & Wootten (1993). One important point regarding this implementation of the LVG model is our scaling of the calculated ortho-H2CO/He excitation rates to those appropriate for collisions with H2. Following the recommendation of Green (1991), we scale the calculated He rates by a factor of 2.2 to account for (1) the reduced collision velocity of He relative to H2, which scales as the inverse-square-root of the masses of He and H2 and (2) the larger cross section of the H2 molecule (; Nerf (1975)) relative to He.
Radiative transfer models of the molecular emission in astrophysical environments are dependent upon collisional excitation rates for the molecule(s) under study. As noted by Mangum & Wootten (1993) and Mangum et al. (2008), the uncertainty associated with the collisional excitation rates must be considered in any analysis of the physical conditions derived from radiative transfer modelling. Green (1991) suggests that the total collisional excitation rate for a given H2CO transition is accurate to . This implies that the physical conditions derived from our LVG modelling are limited to an accuracy of no better than 20%.
For the 13 galaxies and one galaxy offset position (M 82SW) where both the H2CO and transitions were detected we can derive a unique solution to the (ensemble average) spatial density and H2CO column density for an assumed gas kinetic temperature. This unique solution to the physical conditions is derived by fitting to the intercept between the H2CO and transition ratio and the H2CO transition intensity at the assumed kinetic temperature. Absorption line measurements afford the possibility of using the measured apparent optical depths in the LVG model fitting procedure. For our galaxy sample, where with the exception of M 82 , this method has the disadvantage of involving an estimate of the excitation temperature (Tex) in order to derive the apparent optical depth. Since Tex is dependent upon the input physical conditions that we are attempting to derive, we do not believe that fitting to measured apparent H2CO optical depths is advantageous. In fact, as we showed in § 5.3.3 of Mangum et al. (2008), these two approaches to estimating the excitation of H2CO absorption lines in the presence of the cosmic background radiation and weak ambient continuum emission are roughly equivalent for the measurements presented in this paper. Furthermore, we showed in Mangum et al. (2008) that for M 82, which possesses strong continuum emission, ignoring contributions due to background continuum emission produces a derived spatial density which is a lower-limit to the true average spatial density in this galaxy.
As was done in Mangum et al. (2008), a model grid of predicted H2CO transition intensities over a range and step size in spatial density, ortho-H2CO column density per velocity gradient, and kinetic temperature (n(H2), N(ortho-H2CO)/, TK) = ( cm-3, cm-2/km s-1, 20–300 K) and ((n(H2)), (N(ortho-H2CO)/), TK) = (0.03 (cm-3), 0.04 (cm-2/km s-1), 5 K) was calculated. Note that the model grid used in the present calculations is significantly larger in all three modeled parameters than that used in Mangum et al. (2008). The predicted transition intensities were then compared to our measured H2CO and transition intensities (Table 2).
Table 6 lists the derived LVG model best-fit physical conditions for all of the H2CO-detected galaxies in our sample. There are three different sets of assumptions used to derive these physical conditions dependent upon the information available:
-
•
Both Transitions Detected: For the 13 galaxies and one galaxy offset position where we have detected both the H2CO and transitions, we calculate explicit values for the spatial density and ortho-H2CO column density assuming TK = Tdust, with Tdust from Table 1. For the 12 galaxies where we also have NH3-based kinetic temperature measurements (Mangum et al., 2013), we also derive spatial density and column density assuming these gas-derived kinetic temperatures. As NGC 253 and IC 342 possess two NH3-derived temperature components LVG model fits assuming both of these kinetic temperatures are listed. For the LVG model fits with NH3-derived kinetic temperatures, kinetic temperature uncertainties (Mangum et al., 2013) are included. By using NH3-derived kinetic temperatures to constrain our H2CO-derived spatial densities we are assuming cospatiality for these two dense molecular gas tracers. As the spectral line profiles from NH3 and H2CO are similar in all but one galaxy (NGC 660; see §5.3.1), the assumption of cospatiality seems plausible.
-
•
One Transition Detected and Limit to Other Transition: For the 8 galaxies and one galaxy velocity component where we have detected only one of the two K-doublet transitions, but also have a limit to the nondetected transition, we make two estimates of the physical conditions:
-
–
We derive limits to both the spatial density and ortho-H2CO column density assuming a kinetic temperature of 40 K, a intensity limit, and an equivalent line width for the nondetected transition. Furthermore, since our LVG modeling results imply that the transition goes into emission before the transition as the spatial density is increased (for a fixed kinetic temperature), a detection of absorption in the transition means that the (undetected) transition must also be in absorption. On the other hand, a detection of the transition in emission implies that the transition can either be in emission or absorption. These results are listed as limits in columns 3 and 4 of Table 6.
-
–
As was done in Mangum et al. (2008), we calculate the LVG model derived column density assuming n(H2) = cm-3 (for absorption sources) or cm-3 (for emission sources). These assumed values for the spatial density are reasonable averages from our H2CO galaxy sample where spatial density was derived. We also assume444We assumed TK = 40 K in Mangum et al. (2008). Note, though, that T 40 K for most galaxies in our sample. TK = Tdust. This line of reasoning allows us to derive an actual value rather than a limit for N(ortho-H2CO)/v that we can use in a calculation of the dense gas mass. The column densities derived using these assumptions are listed in column 3 of Table 6.
-
–
-
•
Neither Transition Detected: For the 35 galaxies where we derive only limits to the and/or the transition intensities we assume a limit to the measured yet undetected intensities. This allows us to calculate a limit to the ortho-H2CO column density assuming n(H2) = cm-3 and TK = Tdust. Note that we conservatively do not assume a line width in these limits, which would decrease the intensity limit by the square-root of the number of channels over which the line is integrated.
For all of our LVG calculations we assume Tcmb = 2.73 K and negligible contribution due to any background continuum emission (Tc = 0). In § 5.3.3 of Mangum et al. (2008) we showed that our results represent a lower-limit to the true spatial density when contributions due to strong background continuum sources (S 1 Jy) are neglected.
| Galaxy | TKaaRMS noise levels are for 20 km s-1 channels.GBT measurements shown in italics differ from the measurement range defined by Araya et al. (2004), Baan et al. (1990), and NED measurements by more than 25%. | log(N(ortho-H2CO)/v)b,cb,cfootnotemark: | log(n(H2))bbAn “Abs” entry indicates that the line was detected in absorption, “Emis” in emission (see Table 3).PM Poor measurement due to insufficient total power stability. |
|---|---|---|---|
| (K) | (cm-2/km s-1) | (cm-3) | |
| NGC 55 | Tdust = 40dd Assumed value. | ||
| NGC 253 | Tdust = 34 | ||
| TK(NH3) = | |||
| TK(NH3) | |||
| IC 1623 | Tdust = 39 | ||
| NGC 520 | Tdust = 38 | ||
| NGC 598 | Tdust = 40dd Assumed value. | ||
| NGC 660 | Tdust = 37 | ||
| TK(NH3) = ee Uncertainty in direct measurement vhel and FWZI assumed to be 2 km/s, or 1/5 to 1/10 of a smoothed channel width, for all measurements. | |||
| IR 01418+1651 | Tdust = 40dd Assumed value. | ||
| NGC 695 | Tdust = 34 | ||
| Mrk 1027 | Tdust = 37 | ||
| NGC 891 | Tdust = 28 | ||
| NGC 925 | Tdust = 40dd Assumed value. | ||
| NGC 1022 | Tdust = 39 | ||
| NGC 1055 | Tdust = 29 | ||
| Maffei 2 | Tdust = 40dd Assumed value. | ||
| Maffei 2C1 | TK(NH3) = | ||
| Maffei 2C2 | TK(NH3) = | ||
| NGC 1068 | Tdust = 40 | ||
| UGC 02369 | Tdust = 40dd Assumed value. | ||
| NGC 1144 | Tdust = 40dd Assumed value. | ||
| NGC 1365 | Tdust = 32 | ||
| IR 033591523 | Tdust = 40dd Assumed value. | ||
| IC 342 | Tdust = 30 | ||
| TK(NH3) = | |||
| TK(NH3) | |||
| NGC 1614 | Tdust = 46 | ||
| VIIZw31 | Tdust = 34 | ||
| NGC 2146 | Tdust = 38 | ||
| NGC 2623 | Tdust = 40dd Assumed value. | ||
| Arp 55 | Tdust = 36 | ||
| NGC 2903 | Tdust = 29 | ||
| UGC 5101 | Tdust = 36 | ||
| M 82 | Tdust = 45 | ||
| TK(NH3) = | |||
| M 82SW | Tdust = 45 | ||
| TK(NH3) = | |||
| NGC 3079C1 | Tdust = 32 | ||
| TK(NH3) | |||
| NGC 3079C2 | Tdust = 32 | ||
| TK(NH3) | |||
| NGC 3079C3 | Tdust = 32 | ||
| IR 10173+0828 | Tdust = 40dd Assumed value. | ||
| NGC 3227 | Tdust = 40dd Assumed value. | ||
| NGC 3627 | Tdust = 30 | ||
| NGC 3628 | Tdust = 30 | ||
| NGC 3690 | Tdust = 40dd Assumed value. | ||
| NGC 4631 | Tdust = 30 | ||
| NGC 4736 | Tdust = 40dd Assumed value. | ||
| Mrk 231 | Tdust = 47 |
| Galaxy | TKaa Tdust from Table 1; TK(NH3) from Mangum et al. (2013) and Ao et al. (2011) for NGC 1068. | log(N(ortho-H2CO)/v)b,cb,cfootnotemark: | log(n(H2))bb See §5.3 for assumptions used in calculating these quantities. |
|---|---|---|---|
| (K) | (cm-2/km s-1) | (cm-3) | |
| NGC 5005 | Tdust = 28 | ||
| IC 860 | Tdust = 40dd Assumed value. | ||
| TK(NH3) = | |||
| NGC 5194 | Tdust = 40dd Assumed value. | ||
| M 83 | Tdust = 31 | ||
| TK(NH3) = | |||
| Mrk 273 | Tdust = 48 | ||
| NGC 5457 | Tdust = 40dd Assumed value. | ||
| IR 15107+0724 | Tdust = 40dd Assumed value. | ||
| TK(NH3) = | |||
| Arp 220 | Tdust = 44 | ||
| TK(NH3) = | |||
| NGC 6240 | Tdust = 40dd Assumed value. | ||
| IR 17208-0014 | Tdust = 46 | ||
| IR 17468+1320 | Tdust = 40dd Assumed value. | ||
| NGC 6701 | Tdust = 32 | ||
| NGC 6921 | Tdust = 34 | ||
| NGC 6946 | Tdust = 30 | ||
| TK(NH3) = | |||
| IC 5179 | Tdust = 33 | ||
| NGC 7331 | Tdust = 28 | ||
| NGC 7479 | Tdust = 36 | ||
| IR 23365+3604 | Tdust = 45 | ||
| Mrk 331 | Tdust = 41 |
5.3.1 The Multiple Dense Gas Components of NGC 660
Comparison of the NH3 and H2CO K-doublet spectra toward NGC 660 suggests that the bulk of the emission from these two molecules originates from different spatial components. The NH3 (J,K) = (1,1) through (7,7) (for J=K) and (2,1) rotation-inversion transitions have been detected toward NGC 660 with multiple absorption components comprising a total FWZI km s-1 centered near V km s-1 (Mangum et al., 2013). The Vhel and FWZI values determined from the NH3 spectra correspond to the narrow absorption peak embedded within the H2CO absorption component (Figure 2). Analysis of the (narrow) NH3 emission within NGC 660 (Mangum et al., 2013) strongly suggests that it contains four velocity components, two of which originate in the disk of the galaxy. The bulk of the H2CO absorption traces the nuclear region of this galaxy. In spite of the partial non-cospatiality of the NH3 and H2CO absorption in this galaxy, we present physical condition calculations assuming both the dust- and NH3-derived kinetic temperature for H2CO components associated with the disk component.
5.3.2 LVG Model Dependence on Kinetic Temperature
It is difficult to determine kinetic temperatures in extragalactic molecular clouds. The most common kinetic temperature probe is interstellar dust, which is available for a large number of galaxies. However, dust and gas kinetic temperatures, even though being about 10 K in local dark clouds, are not always the same. Good coupling is normally only achieved at densities in excess of cm-3. In the case of substantial gas heating through cosmic rays (Papadopoulos, 2010), even high densities cannot prevent a significant discrepancy between dust and gas temperatures.
Ammonia (NH3) is a more direct probe of the gas. Its temperature sensitive inversion transitions trace molecular gas in star forming as well as in quiescent regions (e.g., Benson & Myers, 1983; Mauersberger et al., 2003). As is the case with many molecules, NH3 shows some chemical peculiarities in star formation regions in our own Galaxy, which have to be kept in mind. NH3 is easily destroyed in photon dominated regions and shows particularly high abundances in hot cores, where temperatures of 100 K or more lead to dust grain mantle evaporation (e.g., Mauersberger et al., 1987). Differences in abundances in individual Galactic regions can amount to two orders of magnitude. This is also the case when comparing NH3 abundances between M 82 and other detected galaxies. Unlike dust, ammonia has been measured in only a limited number of galaxies.
Formaldehyde is another direct probe of kinetic temperature (Mangum & Wootten, 1993). The first application of the technique described by Mangum & Wootten (1993), using the H2CO , , and transitions, has been applied to the kinetic temperature measurement of M 82 by Mühle et al. (2007).
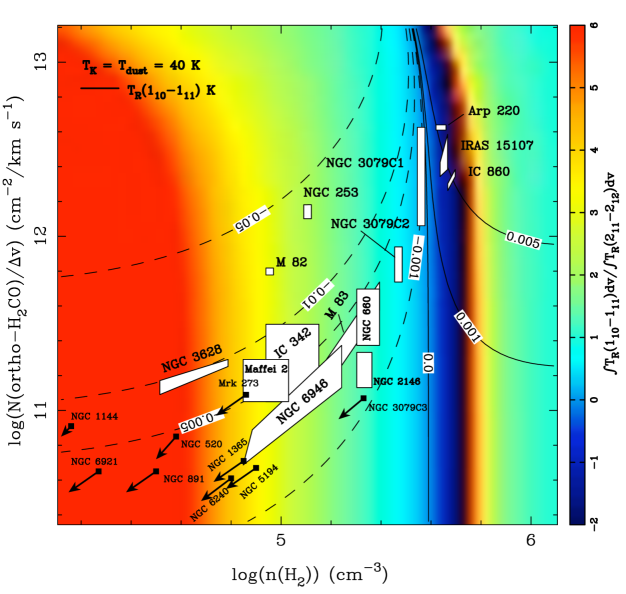
As noted in Mangum et al. (2008), our LVG model-based derivations of the spatial density and ortho-H2CO column density are dependent upon the assumed kinetic temperature used in these models. As we did not have a complete set of gas kinetic temperature measurements for the sample of starburst galaxies presented in Mangum et al. (2008), we assumed TK = Tdust, which were generally in the range 30–40 K. An update of Figure 10 from Mangum et al. (2008), showing a graphical representation of our LVG model derivations of the spatial density and ortho-H2CO column density assuming TK = Tdust is shown in Figure 8. These results of Mangum et al. (2008) naturally lead to the conclusion that spatial density is an important factor in the development and evolution of starbursts in galaxies. The higher mean spatial densities of cm-3 found in the LIRG and ULIRG (Arp 220, IR 15107+0724) measurements of Mangum et al. (2008) contrast with the lower mean spatial densities of cm-3 found in the normal starburst galaxies of Mangum et al. (2008).
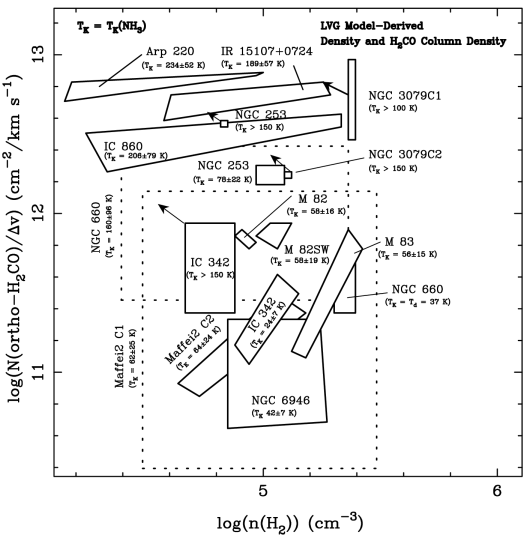
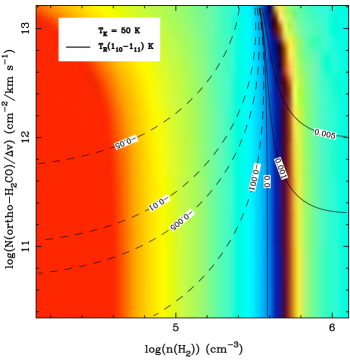
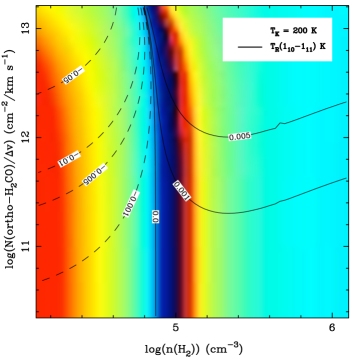
As we now have NH3 measurements of the dense gas kinetic temperature in 11 galaxies with a total of 14 velocity components (Mangum et al., 2013), sampled over similar though slightly smaller () spatial scales to our H2CO measurements, we have used these values to constrain our LVG models and derive revised spatial densities and ortho-H2CO column densities. Figure 9 shows the LVG model-predicted spatial densities and ortho-H2CO column densities for these 11 galaxies (and their individual velocity components, as appropriate). In all 11 galaxies with a total of 14 velocity components the measured kinetic temperature is significantly higher than the previously-assumed Tdust, thus driving the derived spatial densities significantly lower. The correlation between higher kinetic temperature and lower spatial density is shown in Figure 10. The range of best-fit values for spatial density and column density for each galaxy listed in Table 6 and shown in Figure 9 are driven by signal-to-noise limitations of our H2CO measurements and the uncertainties in our derived kinetic temperature measurements.
Mangum et al. (2008) note, based on LVG model-derived spatial densities which assumed TK = Tdust, that there appeared to be a correlation between infrared luminosity and spatial density. This was purported to be another representation of the correlation (Gao & Solomon, 2004b). The revised spatial density measurements, which include appropriate dense gas kinetic temperature measurements, now point to a relatively narrow range in spatial density of cm-3 in our starburst galaxy sample. We should stress that while the assumed kinetic temperature influences the spatial density that we derive from our H2CO measurements, the density-kinetic temperature anti-correlation is dramatically smaller in parameter space than most other molecular tracers; only 1.2 dex in spatial density (Figure 9). In §6 we analyze the implications of the narrow range in spatial density derived for our galaxy sample.
5.3.3 H2CO Excitation Pumping by Continuum Emission
As was noted in Mangum et al. (2008), the H2CO transition can be driven into a maser excitation state by bright and compact nonthermal continuum emission at frequencies near 4.8 GHz (Baan et al., 1986), producing anomalously bright H2CO emission. Analysis of the potential for maser amplification of the H2CO transition in Arp 220, in light of the fact that the transition is observed in absorption, suggest either that the transition is not masing or that there are differences in the small-scale structure traced by the two K-doublet H2CO transitions. Using the simplest possible interpretation, we have so far relied on beam averaged quantities. While such an approach is reasonable for first order estimates, it ignores the potential impact of masers, distorting the picture outlined above. With our LVG models, all data could be successfully simulated without having to adopt population inversion. However, low-spatial resolution data alone do not provide a tool to discriminate safely between quasi-thermal and maser emission. Higher spatial resolution (i.e. using the VLA) measurements will make it possible to clarify the influence of maser emission on the few extragalactic sources of H2CO K-doublet emission.
5.4. H2CO Luminosity and Dense Gas Mass
The correlation between the infrared continuum and molecular spectral line luminosity can be used to characterize the infrared emission power source in these objects. HCN (Gao & Solomon, 2004a, b) and HCO+ (Graciá-Carpio et al., 2006) extragalactic emission surveys have shown this correlation to be very good, suggesting that star formation is the main power source for the large infrared luminosities observed in these galaxies. Following the formalism for calculating molecular spectral line luminosity and dense gas mass described in Mangum et al. (2008), we have derived LIR (Mangum et al., 2008, Equation 12) from existing infrared measurements and Mdense(H2CO) (Mangum et al., 2008, Equation 11) from our H2CO measurements (Table 7):
| (2) |
where is the solid angle of a gaussian source convolved with the gaussian telescope beam, is the angular size distance to the galaxy, is the mass of molecular hydrogen, accounts for the mass fraction due to He (1.36), is the abundance (relative to H2) of the molecule, and uniform filling of the molecular volume is assumed. Where two calculations of Mdense(H2CO) are listed the two calculations of N(ortho-H2CO)/v listed in Table 6 have been used.
We also list Mdense(HCN) derived from HCN measurements (Gao & Solomon, 2004a). Note that our Mdense(H2CO) calculations assume X(H2CO) = and include a conservative 50% uncertainty to our assumed source sizes and H2CO abundances. Due to the lack of H2CO source structure information our H2CO-derived Mdense values are only estimates to be compared with other molecule-derived dense gas masses.
| Galaxy | Sizeaa See §5.1 for galaxies detected in H2CO. Other source size references and measurements used are NGC 55, NGC 1022, NGC 1055, NGC 3627, NGC 5005, NGC 6701: Gao & Solomon (2004a), HCN J=; IC 1623: Imanishi et al. (2007), HCN and HCO+ J=; NGC 598: Rosolowsky et al. (2007), CO J=; NGC 925, NGC 4736: Leroy et al. (2009), CO J=; UGC 02369: this work; IR 03359+1523: Sanders, Scoville, & Soifer (1991), CO J=; NGC 1614, NGC 2623, Arp 55, IR 17208-0014: Iono et al. (2009), CO J= and HCO+ J=; VIIZw31, NGC 3690: Graciá-Carpio et al. (2008), HCN J=; IR 10173+0828: Planesas et al. (1991), CO J=; NGC 3227: Lisenfeld et al. (2008), CO J=; NGC 4631: Israel (2009), CO J= and ; NGC 5457: Helfer et al. (2003), CO J=. | LIRbb Luminosities from Sanders et al. (2003), derived from IRAS fluxes over 8 to 1000 m. | Mdense(HCN)cc LVG-derived column densities listed as limits for unconstrained density fits, followed by column density derived assuming a fixed density. See §5.3 for details. | Mdense(H2CO)d,ed,efootnotemark: |
|---|---|---|---|---|
| (arcsec) | () | () | () | |
| NGC 55 | 0.050.01 | |||
| NGC 253 | 3.410.24 | 2.7 | 9.686.97 (TK = 7822 K) | |
| (TK K) | ||||
| IC 1623 | 45.103.20 | 0.85 | ||
| NGC 520 | 8.220.57 | |||
| NGC 598 | 0.130.05 | |||
| NGC 660 | 3.030.22 | 82.04124.62 (TK = 16096 K) | ||
| 3.030.22 | 31.9225.57 (TK = Td = 37 K) | |||
| IR 01418+1651 | 36.332.72 | |||
| NGC 695 | 42.013.03 | 43.0 | ||
| Mrk 1027 | 23.661.92 | 18.9 | ||
| NGC 891 | 2.250.16 | 2.5 | ||
| NGC 925 | 0.260.02 | |||
| NGC 1022 | 2.170.15 | 2.0 | ||
| NGC 1055 | 1.720.12 | |||
| Maffei 2 | 0.310.05 | 0.330.25 | ||
| Maffei 2 C1 | 0.421.55 | |||
| Maffei 2 C2 | 0.220.36 | |||
| NGC 1068 | 22.721.64 | 36 | ||
| UGC 02369 | 39.152.85 | |||
| NGC 1144 | 23.862.16 | 27 | ||
| NGC 1365 | 14.311.00 | 31 | ||
| IR 03359+1523 | 29.492.61 | |||
| IC 342 | 1.010.07 | 4.7 | 0.140.12 | |
| … | … | 0.160.16 (TK = 247 K) | ||
| … | … | (T 150 K) | ||
| NGC 1614 | 40.362.84 | 12.6 | ||
| VIIZw31 | 82.626.08 | 98.0 | ||
| NGC 2146 | 12.561.36 | 8 | 6.194.70 | |
| NGC 2623 | 35.132.49 | |||
| Arp 55 | 46.993.59 | 38 | ||
| NGC 2903 | 1.230.09 | |||
| UGC 5101 | 88.886.32 | 100 | ||
| M 82 | 15.691.11 | 3.0 | 19.1013.76 | |
| M 82SW | 15.691.11 | 3.0 | 18.6813.66 | |
| NGC 3079C1 | 6.930.50 | |||
| NGC 3079C2 | 6.930.50 | |||
| NGC 3079C3 | 6.930.50 | |||
| IR 10173+0828 | 61.694.74 | |||
| NGC 3227 | 1.410.10 | |||
| NGC 3627 | 1.000.07 | |||
| NGC 3628 | 1.270.09 | 2.4 | 2.782.07 | |
| NGC 3690 | 76.965.40 | |||
| NGC 4631 | 1.600.11 | |||
| NGC 4736 | 0.530.04 | |||
| Mrk 231 | 319.4622.45 | |||
| NGC 5005 | 3.230.23 | 6.5 | ||
| IC 860 | 11.950.93 | 1604.961325.28 | ||
| NGC 5194 | 2.890.20 | |||
| M 83 | 1.570.11 | 3.5 | 1.772.25 | |
| Mrk 273 | 138.799.71 | 152 | ||
| NGC 5457 | 1.360.10 | |||
| IR 15107+0724 | 19.981.44 | 195.60148.75 | ||
| Arp 220 | 167.1111.70 | 30–370 | ||
| NGC 6240 | 74.365.22 | 80–260 | ||
| IR 17208-0014 | 244.2517.23 | 376 | ||
| IR 17468+1320 | 10.081.67 | |||
| NGC 6701 | 11.800.82 | 28 | ||
| NGC 6921 | 12.420.88 | |||
| NGC 6946 | 1.510.11 | 4.9 | 0.120.13 | |
| IC 5179 | 15.451.08 | 34 | ||
| NGC 7331 | 3.610.25 | |||
| NGC 7479 | 6.600.48 | 11.2 | ||
| IR 23365+3604 | 127.8111.06 | 150 | ||
| Mrk 331 | 28.101.97 | 33.5 |
Our Mdense estimates range from (NGC 598) to (NGC 660, NGC 1144, IR 15107+0724, NGC 6921). In general, Mdense derived from our H2CO measurements agrees to within an order-of-magnitude with derived from HCN measurements (excluding NGC 1144, which differs by a factor of ). There is an apparent trend, though, for Mdense(H2CO) Mdense(HCN). Note that the uncertainties in many of the quantities which go into the calculation of Mdense limit its accuracy to no better than an order-of-magnitude.
Gao & Solomon (2004a) found that the values of (HCN) are factors of 5–200 smaller than derived from CO measurements for their sample of spiral, LIRG, and ULIRG galaxies, many of which are included in our sample. Our (H2CO) values are generally smaller than those derived using HCN. The progression from high to low masses derived from dense gas tracers such as CO, HCN, and H2CO reflects the hierarchical structure of the giant molecular clouds in these galaxies (Gao & Solomon, 2004a, b; Greve et al., 2009). H2CO traces a denser, more compact, component of the giant molecular clouds in our galaxy sample than low-excitation transitions of CO or HCN. This result is consistent with high-resolution studies of the K-doublet H2CO emission in our own Galaxy (Mangum et al., 1993).

In Figure 11 we show versus for the 11 galaxies and one galaxy offset position where we have derived values for N(ortho-H2CO)/v from our LVG model fits (rather than simply limits to the ortho-H2CO column density) with TK derived from NH3 measurements (Mangum et al., 2013). We also show in Figure 11 the log-linear relation . Note that given the uncertainties regarding the size of the dense gas distribution we have not performed a formal fit of this relation. This correlation, first noted by Solomon, Downes, & Radford (1992), reflects the correlation between the infrared luminosity and the amount of material to form stars in galaxies. This in turn leads directly to the Kennicutt-Schmidt laws, which relate the star formation rate to the mass of gas available to produce stars (Schmidt, 1959, 1963) in galaxies. Since , the suggestion of a linear correlation between and implies that, similar to HCN, H2CO traces the dense star-forming gas in starburst galaxies.
As was alluded to in Mangum et al. (2008)555Equation 14 in Mangum et al. (2008) presents a similar relation for M that has two errors: a missing factor of and an incorrect exponent to DL. Equation 14 in Mangum et al. (2008) is also not properly normalized., the dense gas mass can also be calculated using the spatial density n(H2) rather than the molecular column density Nmol:
| (3) |
where we have assumed that the volume of emitting gas is a uniformly-filled face-on disk with height , = 1.36, and is the mass of an individual molecule. Comparing the mass derived from Equation 2 (Mdense) with M allows for a consistency check of our dense gas mass calculation. Comparing the terms in Equations 2 and 3, this consistency check amounts to a check of our assumptions regarding the H2CO abundance (Xmol) and the dense gas emitting volume thickness . Assuming pc (similar in size to the GMC structures identified in IC 342 by Meier et al. (2011)) for all galaxies we find that for the ten galaxies which have both Nmol and n(H2) measurements that our calculations of M and Mdense (Table 8) agree to within a factor of for NGC 253, NGC 660, M 82, and IR 15107+0724. For the other seven galaxies M and Mdense agree to within a factor of , with M larger than Mdense in all but one galaxy (Arp 220). To bring these two dense gas mass estimates into agreement we can either lower the dense gas emitting volume thickness or lower the H2CO abundance by a factor of . As our estimate for pc is consistent with the GMC-scale structures imaged at high-spatial resolution in several nearby starburst galaxies (e.g. IC 342; Meier et al. (2011), M 82; Carlstrom & Kronberg (1991)), the more plausible option appears to be to lower the H2CO abundance to (recall that our assumed Xmol for all calculations above is ). Note that models of molecular abundances in starburst galaxies with low to moderate cosmic ray ionization rates (the local Milky Way value of to s-1) predict H2CO abundances in the range (Bayet et al., 2011) and (Meijerink et al., 2011, ; R. Meijerink 2011, priv. comm.). In these models as the cosmic ray ionization rate is increased the H2CO abundance decreases. If mechanical heating is included (Meijerink et al., 2011) a more complicated prediction of the H2CO abundance with increasing cosmic ray ionization rate is predicted which lies in the range –.
| Galaxy | Mdense(H2CO)aaDerived from Equation 2. | M(H2CO)bbDerived from Equation 3. |
|---|---|---|
| () | () | |
| NGC 253 (TK = 7822 K) | 9.686.97 | 12.686.57 |
| NGC 660 (TK = 16097 K) | 82.04124.62 | 45.12123.47 |
| Maffei 2 | 0.330.25 | 3.312.18 |
| IC 342 (TK = K) | 0.160.16 | 4.053.37 |
| NGC 2146 | 6.194.70 | 105.2255.59 |
| M 82 | 19.1013.76 | 31.2117.47 |
| M 82SW | 18.6813.66 | 42.1026.53 |
| NGC 3628 | 2.782.07 | 12.9010.71 |
| M 83 | 1.772.25 | 36.3931.65 |
| IR 15107+0724 | 110.0083.65 | 49.9246.51 |
| Arp 220 | 62.8545.94 | 1.460.96 |
| NGC 6946 | 0.120.13 | 3.113.50 |
6. Density-Independent Star Formation
As was noted in §5.3.2, the measured mean spatial density within the starburst environments of our sample of 13 galaxies with measured H2CO and emission or absorption lies within a rather limited range of cm-3. These galaxies span a considerable variety in kinetic temperature (TK K), infrared luminosity (), and dense gas mass (), representing a wide range of starburst environments. The physical size scales over which these measurements apply range from to kpc based on our spatial resolution of 51′′ to 153′′, sample galaxy distances of 1 to 200 Mpc (see Table 1) and unknown single dish beam filling factors. The relatively narrow range of the mean spatial density within our starburst galaxy sample suggests that spatial density is not a driver of the star formation process in the most luminous starburst galaxies. Furthermore, a relatively constant mean spatial density implies that the Schmidt-Kennicutt relation between LIR and Mdense is a measure of the dense gas mass reservoir available to form stars, and not a reflection of a higher spatial density in the most luminous and massive starburst galaxies.
We should point out that the relatively narrow range of spatial densities derived in our starburst galaxy sample is not due to limitations of our densitometry technique. The H2CO K-doublet transitions we have used in this analysis absorb the cosmic microwave background at n() cm-3 and appear in emission at higher spatial densities (see §2). For typical H2CO abundances the H2CO K-doublet transitions are excited at n() cm-3. As there is no upper limit to the spatial density sensitivity of these H2CO transitions, biased sensitivity to spatial density does not affect our spatial density measurements. Observational support for this lack of bias to spatial density exists for both lower (Zeiger & Darling, 2010) and higher (McCauley et al., 2011; Ginsburg et al., 2011) spatial densities than those derived in this study.
7. Conclusions
Measurements of the and K-doublet transitions of H2CO toward a sample of 56 starburst galaxies have been used to study the physical conditions within the active starburst environments of these galaxies. By applying detections of at least one of these K-doublet H2CO transitions toward 21 of these starburst galaxies an estimate to the spatial density (n(H2)) and dense gas mass within each of these starburst galaxies has been derived. For the 13 galaxies where both K-doublet H2CO transitions have been detected we have derived accurate measurements of the mean spatial density. By applying an appropriate measurement of the dense gas kinetic temperature in 11 of the galaxies in our sample we have improved the spatial density measurement procedure presented in Mangum et al. (2008). Furthermore, all of our K-doublet H2CO measurements can be fit to our LVG model assuming quasithermal exciation. This fact does not entirely exclude potential maser emission, as noted in Mangum et al. (2008).
Using measured kinetic temperatures has narrowed the range of derived spatial densities presented in Mangum et al. (2008) to 104.5 to 105.5 cm-3 in our starburst galaxy sample. This improvement to the spatial density measurement in our starburst galaxy sample has removed the trend between and our derived noted in Mangum et al. (2008). That trend, which suggested that starburst galaxies with higher spatial densities also possessed higher IR luminosities, was indicative of another representation of the - correlation. Instead, our results now imply that the Schmidt-Kennicutt relation between LIR and Mdense:
-
•
Is a measure of the dense gas mass reservoir available to form stars, and
-
•
Is not directly dependent upon a higher average density driving the star formation process in the most luminous starburst galaxies.
This extension of the characterization of the spatial density in starburst galaxies presented in Mangum et al. (2008) produces the most accurate measurements of this important physical quantity in starburst galaxies made to-date.
As was done in Mangum et al. (2008), we have also used our H2CO measurements to derive a measure of the dense gas mass which ranges from . By comparing this traditional measure of the dense gas mass to that derived using our spatial density measurements we find agreement to within a factor of . The most extreme differences between these two methods of calculating the dense gas mass using H2CO can best be reconciled with a modification of the assumed H2CO abundance of X(H2CO) = toward several of the galaxies in our sample. Recent modeling of the molecular abundances in starburst galaxies suggest that low to moderate cosmic ray ionization rates (Bayet et al., 2011) and mechanical heating (Meijerink et al., 2011) can affect the H2CO abundance in starburst environments. Furthermore, comparison of our measures of the dense gas mass using H2CO with those derived using HCN suggest that the H2CO K-doublet transitions trace a denser, more compact, component of the giant molecular clouds in our starburst galaxy sample than low-excitation transitions of CO or HCN.
References
- Aalto et al. (1995) Aalto, S., Booth, R. S., Black, J. H., & Johansson, L. E. B. 1995, A&A, 300, 369
- Aalto et al. (1999) Aalto, S., Hüttemeister, S., Scoville, N. Z., & Thaddeus, P. 1999, ApJ, 522, 165
- Ao et al. (2011) Ao, Y., Henkel, C., Braatz, J.A., et al. 2011, A&A, 529, A154
- Araya et al. (2004) Araya, E., Baan, W. A., & Hofner, P. 2004, ApJS, 154, 541
- Baan et al. (1986) Baan, W. A., Güsten, R., & Haschick, A. D. 1986, ApJ, 305, 830
- Baan (1989) Baan, W. A. 1989, ApJ, 338, 804
- Baan et al. (1990) Baan, W. A., Henkel, C., Schilke, P., Mauersberger, R., & Güsten, R. 1990, ApJ, 353, 132
- Baan & Haschick (1992) Baan, W. A. & Haschick, A. D. 1992, AJ, 103, 728
- Baan et al. (1992) Baan, W. A., Haschick, A. D. & Henkel, C. 1992, AJ, 103, 728
- Baan et al. (1993) Baan, W. A., Haschick, A. D., & Uglesich, R. 1993, ApJ, 415, 140
- Baan & Haschick (1995) Baan, W. A. & Haschick, A. D. 1995, ApJ, 454, 745
- Baan et al. (1997) Baan, W. A., Bragg, A. E., Henkel, C., & Wilson, T. L. 1997, ApJ, 491, 134
- Baan et al. (2008) Baan, W. A., Henkel, C., Loenen, A. F., Baudry, A., & Wiklind, T. 2008, A&A 477, 747
- Bayet et al. (2009) Bayet, E., Aladro, R., Martin, S., Viti, S., & Martin-Pintado, J. 2009, ApJ, 707, 126
- Bayet et al. (2011) Bayet, E., Williams, D. A., Hartquist, T. W., & Viti, S. 2011, MNRAS, 414, 1583
- Bell et al. (1984) Bell, M. B., Seaquist, E. R., Mebold, U., Reif, K., & Shaver, P. 1984, A&A, 130, 1
- Benson & Myers (1983) Benson, P. J. & Myers, P. C. 1983, ApJ, 266, 309
- Brouillet & Schilke (1993) Brouillet, N. & Schilke, P. 1993, A&A, 277, 381
- Bryant & Scoville (1999) Bryant, P. M. & Scoville, N. Z. 1999, AJ, 117, 2632
- Carlstrom & Kronberg (1991) Carlstrom, J. E. & Kronberg, P. P. 1991, ApJ, 366, 422
- Downes et al. (1992) Downes, D., Radford, S. J. E., Guilloteau, S., et al. 1992, A&A, 262, 424
- Evans et al. (1975) Evans, N. J., II, Zuckerman, B., Morris, G., & Sato, T. 1975, ApJ, 196, 433
- Fischer et al. (2010) Fischer, J., Sturm, E., González-Alfonso, E., et al. 2010, A&A, 518, L41
- Gao & Solomon (2004a) Gao, Y., & Solomon, P. M. 2004a, ApJS, 152, 63
- Gao & Solomon (2004b) Gao, Y., & Solomon, P. M. 2004b, ApJ, 606, 271
- García-Burillo & Guélin (1995) García-Burillo, S. & Guélin, M. 1995, A&A, 299, 657
- Gardner & Whiteoak (1974) Gardner, F. F. & Whiteoak, J. B. 1974, Nature, 247, 526
- Garrison et al. (1975) Garrison, B. J., Lester, W. A., Miller, W. H., & Green, S. 1975, ApJL, 200, L175
- Ginsburg et al. (2011) Ginsburg, A., Darling, J., Battersby, C., Zeiger, B., & Bally, J. 2011, ApJ, 736, A149
- Graciá-Carpio et al. (2006) Graciá-Carpio, J., García-Burillo, S., Planesas, P., & Colina, L. 2006, A&A, 640, L135
- Graciá-Carpio et al. (2008) Graciá-Carpio, J., García-Burillo, S., Planesas, P., Fuente, A., & Usero, A. 2008, A&A, 479, 703
- Graham et al. (1978) Graham, D. A., Emerson, D. T., Weiler, K. W., Wielebinski, R., & de Jager, G. 1978, A&A, 70, L69
- Green (1991) Green, S. 1991, ApJS, 76, 979
- Greve et al. (2006) Greve, A., Neininger, N., Sievers, A., & Tarchi, A. 2006, A&A, 459, 441
- Greve et al. (2009) Greve, T. R., Papadopoulos, P. P., Gao, Y., & Radford, S. J. E. 2009, ApJ, 692, 1432
- Güsten et al. (2006) Güsten, R., Philipp, S. D., Weiß, A., & Klein, B. 2006, A&A, 454, L115
- Helfer et al. (2003) Helfer, T. T., Thornley, M. D., Regan, et al. 2003, ApJS, 145, 259
- Henkel et al. (1986) Henkel, C., Güsten, R., & Batrla, W. 1986, A&A, 168, L13
- Henkel et al. (1987) Henkel, C., Güsten, R., & Baan, W. A. 1987, A&A, 185, 14
- Henkel & Wilson (1990) Henkel, C. & Wilson, T. L. 1990, A&A, 229, 431
- Henkel, Baan, & Mauersberger (1991) Henkel, C. Baan, W. A., & Mauersberger, R 1991, A&AR, 3, 47
- Hüttemeister et al. (1997) Hüttemeister, S., Mauersberger, R., & Henkel, C. 1997, A&A, 326, 59
- Imanishi et al. (2007) Imanishi, M., Nakanishi, K., Tamura, Y., Oi, N., Kohno, K. 2007, AJ, 134, 2366
- Impellizzeri et al. (2006) Impellizzeri, C. M. V., Roy, A. L., & Henkel, C. 2006, Proceedings of the 8th European VLBI Network Symposium. September 26-29, 2006, Torun, Poland. Editorial Board: Baan Willem, Bachiller Rafael, Booth Roy, Charlot Patrick, Diamond Phil, Garrett Mike, Hong Xiaoyu, Jonas Justin, Kus Andrzej, Mantovani Franco, Marecki Andrzej (chairman), Olofsson Hans, Schlueter Wolfgang, Tornikoski Merja, Wang Na, Zensus Anton., p. 35
- Impellizzeri et al. (2008) Impellizzeri, C. M. V., Henkel, C., Roy, A. L., & Menten, K. M. 2008, A&A, 484, L43
- Iono et al. (2009) Iono, D., Wilson, C. D., Yun, M. S., et al. 2009, ApJ, 695, 1537
- Israel (2009) Israel, F. P. 2009, A&A, 506, 689
- Kamenetzky et al. (2012) Kamenetzky, J., Glenn, J., Rangwala, N. et al., 2012, ApJ, 753, A70
- Klöckner et al. (2003) Klöckner, H.-R., Baan, W. A., & Garrett, M. A. 2003, Nature, 421, 821
- Klöckner & Baan (2004) Klöckner, H.-R. & Baan, W. A. 2004, A&A, 419, 887
- Kohno et al. (1996) Kohno, K., Kawabe, R., Tosaki, T. & Okumura, S. 1996, ApJ, 461, L29
- Kohno et al. (2000) Kohno, K., Kawabe, R., Shibatsuka, T. & Matsushita, S. 2000, in Imaging at Radio through Submillimeter Wavelengths, ed. J. G. Mangum & S. J. E. Radford, ASP Conf. Ser. 217
- Kuno et al. (2008) Kuno, N., Nakanishi, K., Sorai, K., & Shibatsuka, T. 2009, PASJ, 60, 475
- Lebrón et al. (2011) Lebrón, M., Mangum, J. G., Mauersberger, R., et al. 2011, A&A, 534, A56
- Leroy et al. (2009) Leroy, A. K., Walter, F., Bigiel, F., et al. AJ, 137, 4670
- Lisenfeld et al. (2008) Lisenfeld, U., Mundell, C. G., Schinnerer, E., Appleton, P. N., & Allsopp, J. 2008, ApJ, 685, 181
- Liszt et al. (2010) Liszt, H. S., Pety, J., & Lucas, R. 2010, A&A, 518, A45
- Lo (2005) Lo, K. Y. 2005, ARA&A, 43, 625
- Lockett & Elitzur (2008) Lockett, P. & Elitzur, M. 2008, ApJ, 677, 985
- Lovas (1992) Lovas, F.J., 1992, J. Phys. Chem. Ref. Data 21, 181
- Maddalena (2008) Maddalena, R. 2008, priv. comm.
- Mangum et al. (1990) Mangum, J. G., Wootten, A., Wadiak, E. J., & Loren, R. B. 1990, ApJ, 348, 542
- Mangum et al. (1993) Mangum, J. G., Wootten, A., & Plambeck, R. L. 1993, ApJ, 409, 282
- Mangum & Wootten (1993) Mangum, J. G. & Wootten, A. 1993, ApJS 89, 123
- Mangum et al. (2008) Mangum, J. G., Darling, J., Menten, K. M., & Henkel, C. 2008, ApJ, 673, 832
- Mangum et al. (2013) Mangum, J. G., Darling, J., Menten, K. M., et al. 2013, in preparation
- Mao et al. (2000) Mao, R. Q., Henkel, C., Schulz, A., et al. 2000, A&A, 358, 433
- Martín et al. (2006) Martín, S., Mauersberger, R., Martín-Pintado, J., Henkel, C., & García-Burillo, S. 2006, ApJS, 164, 450
- Mauersberger et al. (1987) Mauersberger, R., Henkel, C., & Wilson, T. L. 1987, A&A, 173, 352
- Mauersberger et al. (2003) Mauersberger, R., Henkel, C., Weiß, A., Peck, A. B., & Hagiwara, Y. 2003, A&A, 403, 561
- McCauley et al. (2011) McCauley, P. I., Mangum, J. G., & Wootten, A. 2011, ApJ, 742, 58
- Meier & Turner (2005) Meier, D. S. & Turner, J. L. 2005, ApJ, 618, 259
- Meier et al. (2008) Meier, D. S., Turner, J. L., & Hurt, R. L. 2008, ApJ, 675, 281
- Meier et al. (2011) Meier, D. S., Turner, J. L., & Schinnerer, E., AJ, 142, A32
- Meijerink et al. (2011) Meijerink, R., Spaans, M., Loenen, A. F., & van der Werf, P. P. 2011, A&A, 525, A119
- Mühle et al. (2007) Mühle, S., Seaquist, E. R., & Henkel, C. 2007, ApJ, 671, 1579
- Nerf (1975) Nerf, R. B. 1975, J. Mol. Spectrosc., 58, 451
- Omont (2007) Omont, A. 2007, “Molecules in Galaxies”, in Reports on Progress in Physics, 70, 1099
- Ott et al. (2005) Ott, J., Weiß, A., Henkel, C., & Walter, F. 2005, ApJ, 629, 767
- Panuzzo et al. (2010) Panuzzo, P., Rangwala, N., Rykala, A., et al., 2010, A&A, 518, L37
- Papadopoulos (2010) Papadopoulos, P. P. 2010, ApJ, 720, 226
- Pérez-Beaupuits et al. (2007) Pérez-Beaupuits, J. P., Aalto, S., & Gerebo, H. 2007, A&A, 476, 177
- Pihlström et al. (2001) Pihlström, Y. M., Conway, J. E., Booth, R. S., Diamond, P. J., & Polatidis, A. G. 2001, A&A, 377, 413
- Planesas et al. (1991) Planesas, P., Mirabel, I. F., & Sanders, D. B. 1991, ApJ, 370, 172
- Radford (1968) Radford, H. E. 1968, Rev. Sci. Instrum., 39, 1687
- Rangwala et al. (2011) Rangwala, N. Maloney, P. R. Glenn, J., et al.2011, ApJ, 743, A94
- Reid et al. (2009) Reid, M. J., Braatz, J. A., Condon, J. J., Greenhill, L. J., & Lo, K. Y. 2009, ApJ, 695, 287
- Rodriguez-Rico et al. (2004) Rodriguez-Rico, C. A., Viallefond, F., Zhao, J.-H., Goss, W. M., & Anantharamaiah, K. R. 2004, ApJ, 616, 783
- Rosolowsky et al. (2007) Rosolowsky, E., Keto, E., Matsushita, S., & Willner, S. P. 2007, ApJ, 661, 830
- Sakamoto et al. (2004) Sakamoto, K., Satoki, M., Peck, A. B., Wiedner, M. C., & Iono, D. 2004, ApJ, 616, L59
- Sanders et al. (1988) Sanders, D. B., Scoville, N. Z., Sargent, A. I., & Soifer, B. T. 1988, ApJ, 324, L55
- Sanders et al. (2003) Sanders, D. B., Mazzarella, J. M., Kim, D.–C., Surace, J. A., & Soifer, B. T. 2003, AJ, 126, 1607
- Sanders, Scoville, & Soifer (1991) Sanders, D. B., Scoville, N. Z., & Soifer, B. T. 1991, ApJ, 370, 158
- Sandqvist (1999) Sandqvist, Aa. 1999, A&A, 343, 367
- Schinnerer et al. (2006) Schinnerer, E., Böker, T., Emsellem, E., & Lisenfeld, U. 2006, ApJ, 649, 181
- Schinnerer et al. (2007) Schinnerer, E., Böker, T., Emsellem, E., & Downes, D. 2007, A&A, 462, L27
- Schinnerer et al. (2010) Schinnerer, E., Weiß, A., Aalto, S., & Scoville, N. Z. 2010, ApJ, 719, 1588
- Schmelz et al. (1986) Schmelz, J. T., Baan, W. A., Haschick, A. D., & Eder, J. 1986, AJ, 92, 1291
- Schmidt (1959) Schmidt, M. 1959, ApJ, 129, 243
- Schmidt (1963) Schmidt, M. 1963, ApJ, 137, 758
- Seaquist, Bell, & Bignell (1981) Seaquist, E. R., Bell, M. B., & Bignell, R. C. 1981, BAAS, 13, 807
- Seaquist, Lee, & Moriarty-Schieven (2006) Seaquist, E. R., Lee, S. W., & Moriarty-Schieven, G. H. 2006, ApJ, 638, 148
- Sobolev (1960) Sobolev, V. V. 1960, “Moving Envelopes of Stars” (Cambridge: Harvard University Press)
- Solomon, Downes, & Radford (1992) Solomon, P. M., Downes, D., & Radford, S. J. E. 1992, ApJ, 387, L55
- Staveley-Smith et al. (1992) Staveley-Smith, L., Norris, R. P., Chapman, J. M., et al. 1992, MNRAS, 258, 725
- Stevens & Gear (2000) Stevens, J. A. & Gear, W. K. 2000, MNRAS, 312, L5
- Stevens et al. (2005) Stevens, J. A., Amure, M., & Gear, W. K. 2005, MNRAS, 357, 361
- Tucker et al. (1971) Tucker, K. D., Tomasevich, G. R., & Thaddeus, P. 1971, ApJ, 169, 429
- Tucker et al. (1972) Tucker, K. D., Tomasevich, G. R., & Thaddeus, P. 1971, ApJ, 174, 463
- Yao & Seaquist (2003) Yao, L. & Seaquist, E. R. 2003, ApJ, 588, 771
- Yun & Hibbard (2001) Yun, M. S. & Hibbard, J. E. 2001, ApJ 550, 104
- Weiß et al. (2001) Weiß, A., Neininger, N., Henkel, C., Stutzki, J. & Klein, U. 2001, ApJ, 554, L143
- Willett et al. (2011) Willett, K. W., Darling, J., Spoon, H. W. W., Charmandaris, V., & Armus, L. 2011, ApJ, 730, A56
- Wilson et al. (2008) Wilson, C. D., Petitpas, G. R., Iono, D., et al. 2008, ApJS, 178, 189
- Zeiger & Darling (2010) Zeiger, B. & Darling, J., ApJ, 709, 386