Physical Conditions of the Gas in an ALMA [CII]-identified Submillimetre Galaxy at
Abstract
We present 12CO(2–1) observations of the submillimetre galaxy ALESS65.1 performed with the Australia Telescope Compact Array at 42.3 GHz. A previous ALMA study of submillimetre galaxies in the Extended Chandra Deep Field South detected [CII] 157.74 m emission from this galaxy at a redshift of . No 12CO(2–1) emission was detected but we derive a firm upper limit to the cold gas mass in ALESS65.1 of . The estimated gas depletion timescale is Myr, which is similar to other high redshift SMGs, and consistent with SMGs being the likely progenitors of massive red-and-dead galaxies at . The ratio of the [CII], 12CO and far-infrared luminosities implies a strong far-ultraviolet field of , as seen in Galactic star forming regions or local ULIRGs. The observed is high compared to local ULIRGs and, combined with , it is consistent with ALESS65.1 either having an extended (several kpc) [CII] emitting region or lower than solar metallicity.
keywords:
galaxies: evolution, galaxies: formation1 Introduction
Submillimetre galaxies (SMGs) are ultraluminous, dusty starbursting systems with extreme star formation rates (SFRs) of 100 – 1000 yr-1 (e.g. Blain et al., 2002). These SMGs have typical redshifts of –3 (e.g. Chapman et al., 2005; Wardlow et al., 2011; Yun et al., 2012; Smolčić et al., 2012), but an increasing number of higher redshift SMGs are being found. The SMGs represent candidates for the most intense star formation phase of the massive red galaxies seen at (Cimatti et al., 2008; Marchesini et al., 2010). This high redshift tail of the SMG distribution was long under-represented in SMG redshift surveys, mostly because they lie below the sensitivity limits of the radio interferometer surveys used to identify SMGs. However, in the last few years, over a dozen of these sources have been reported (Capak et al., 2008, 2011; Daddi et al., 2009a, b; Coppin et al., 2009; Knudsen et al., 2010; Carilli et al., 2010, 2011; Riechers et al., 2010; Smolčić et al., 2011; Cox et al., 2011; Combes et al., 2012; Walter et al., 2012), and recent ALMA redshift surveys have doubled these numbers (Weiss et al. submitted; Vieira et al. submitted). Detailed studies of the star formation and gas content in these SMGs are still rare, but are needed to provide a unique insight into the earliest phases of the growth of massive elliptical galaxies.
The most accessible tracer of cold gas in galaxies is 12CO, which has been observed extensively in SMGs (e.g. Greve et al., 2005; Tacconi et al., 2006; Bothwell et al., 2013). Detections of 12CO in SMGs have shown they are gas rich systems with sufficient reservoirs ( ) to sustain the extreme star formation rates of 1000 yr-1 for only short time scales (10s of Myrs) (Coppin et al., 2010; Riechers et al., 2010), unless the gas is replenished. This is consistent with high redshift SMGs being the progenitors of the luminous red galaxies seen at .
The – fine structure line of singly ionised carbon at 157.74 m (here-after [CII]) has emerged as a powerful alternative line for studying the ISM in high redshift sources. It can represent up to 1% of the bolometric luminosity of star forming galaxies (e.g. Crawford et al., 1985; Stacey et al., 1991). This line emission arises mainly from the photodissociation regions (PDRs) that form at the edges of molecular clouds illuminated by the UV photons of young-massive stars, but a significant contribution can also come from HII regions and the more diffuse warm interstellar medium (Madden et al., 1993; Heiles, 1994). The [CII] line therefore provides an important probe of the gas content and star formation processes in a galaxy.
A recent ALMA Cycle 0 study of 126 submillimetre sources located in the LABOCA Extended Chandra Deep Field South (LESS, Weiß et al., 2009; Karim et al. 2012; Hodge et al. 2013 submitted) resulted in the serendipitous identification of [CII] line emission from two SMGs (Swinbank et al., 2012, hereafter S12). The average [CII[/far-infrared luminosity ratio of these two SMGs is 0.0012 0.0004, roughly ten times higher than that observed in local ultraluminous infrared galaxies, which has been interpreted as evidence that their gas reservoirs are more extended (S12). The large extent of SMGs is supported by other observations, such as extended radio morphologies (e.g. Chapman et al., 2004; Biggs & Ivison, 2008), extended H- morphologies (e.g. Swinbank et al., 2006), large 12CO(1-0) sizes (Ivison et al., 2010a, 2011; Thomson et al., 2012; Hodge et al., 2012), lack of silicate absorption in mid-infrared spectra (Menéndez-Delmestre et al., 2009), and less reddened broad-band mid-infrared colours (Hainline et al., 2009). High [CII]/far-infrared ratios (Stacey et al., 2010; Ivison et al., 2010b; S12) add to this mounting evidence that star-formation in SMGs takes place in a region larger than the compact nuclear starbursts of local ULIRGs.
In this paper we present 12CO(2–1) observations of one of the ALMA detected SMGs, ALESS J033252.26-273526.3 (hereafter ALESS65.1). We adopt the standard -CDM cosmological parameters of , , and a Hubble constant of 71 km s-1 Mpc-1 throughout this paper.
2 Observations and Results
The 12CO(2–1) line ( = 230.538 GHz) in ALESS65.1 (RA(J2000) = 03 32 52.26, Dec(J2000) = 27 35 26.3) (S12) was observed over a period of four consecutive nights, 9 – 12 August 2012, with the Australia Telescope Compact Array (ATCA), using the Compact Array Broadband Backend (CABB). The array was in the most compact five-antenna configuration, H75, which has a maximum baseline of 89m and two antennas set along a northern spur. The hybrid configuration allows good coverage to be obtained for integrations less than the full 12 hour synthesis. We centered the 7mm IF1 receiver on 42.343 GHz, the expected frequency of the 12CO(2–1) line emission given the [CII] redshift of derived by S12. The 2GHz wide bandwidth of CABB results in a frequency coverage of 41.3 to 43.3 GHz, covering 12CO(2–1) emission between 4.32 – 4.58. The weather was good to average, with rms atmospheric path length variations of 100 to 400 microns throughout the run, as measured on the 230m baseline ATCA Seeing Monitor (Middelberg et al., 2006). The system temperature was 140 to 250 K throughout the four nights. Weather and atmospheric conditions can induce temporal fluctuations across the wide CABB band, so, following Emonts et al. (2011), a bandpass calibration scan was acquired at the beginning, middle and end of each 8 hour night. Phase and amplitude calibration information was acquired with 2 minute scans on PKS 0346279 every 10 minutes and pointing checks performed on the same source every hour. Flux density calibration was performed on Uranus at the beginning of the nights, when it was at an elevation of roughly 55 degrees. The uncertainty in the flux density calibration using the standard MIRIAD model of Uranus is estimated to be 30% (Emonts et al., 2011).
The data were calibrated, mapped and analysed using the standard MIRIAD (Sault & Killeen, 1999) and KARMA (Gooch, 1996) packages. The synthesized beam from natural weighting is 14.0 9.9 arcsec. A total of about 20 hours on-source integration time was obtained over the 4 8 hour nights. ALESS65.1 was not detected in the 42.3 GHz continuum map from the full CABB band, which achieves an rms noise level of 11 Jy beam-1.
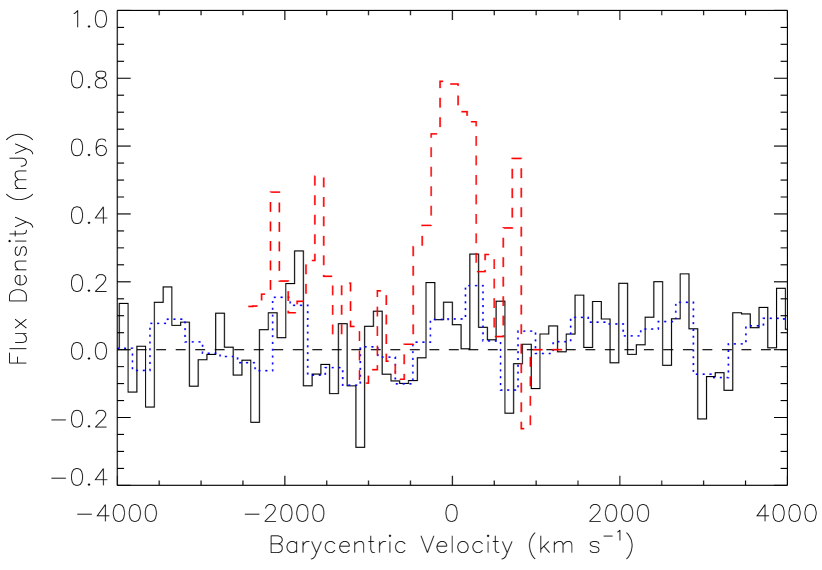
The resultant channel noise in the 1 MHz (7.1 km s-1) wide spectrum is 0.43 mJy beam-1, consistent with other comparable 7mm ATCA/CABB surveys (e.g. Coppin et al., 2010; Emonts et al., 2011). The visibilities were resampled to velocity resolutions of 50, 100 and 200 km s-1 and each cube was examined for an emission line near the ALMA position. A 4 spike at the position of ALESS65.1 and offset from the [CII] emission by 280 km s-1 was examined in detail. It was deemed a noise spike because it is only present in one channel in all three binned images and is present only in the last night of data when each night is imaged separately. We flag the spike (20 native channels) in the last night of data and recombined all four nights of data to derive the final spectra. The spectra at the source position in the 100 and 200 km s-1 binned cubes (Figure 1) have an rms of 0.11 and 0.08 mJy beam-1, respectively. Assuming a line FWHM identical to the [CII] emission line (470 km s-1, S12) and adopting a 3 limit, the 12CO(2–1) line intensity of ALESS65.1 is Jy km s-1.
3 Discussion
The observed and derived properties of ALESS65.1 are summarised in Table 1. To estimate the cold molecular gas content in ALESS65.1 we calculate upper limits to the line luminosity and total cold gas (H2 + He) mass from the CO(2–1) flux density limit. Following Solomon and Vanden Bout (2005), the line luminosity upper limit is 2.2 K km s-1 pc2. If we assume the gas is thermalised (i.e. intrinsic brightness temperature and line luminosities are independent of transition), so = , and a CO-to-H2 conversion factor (K km s-1 pc2)-1, which is appropriate for ULIRGs (e.g. Downes & Solomon, 1998, but see Bothwell et al., 2012), the upper limit on the total cold gas mass is . This is consistent with the gas mass found in other SMGs (Schinnerer et al., 2008; Daddi et al., 2009a; Coppin et al., 2010; Walter et al., 2012) and the typical [CII]/ ratio at high redshift (S12).
The total baryonic mass of ALESS65.1 can be derived by combining the gas and stellar mass estimates for the system. The stellar mass of the system was estimated from the rest-frame absolute H-band magnitude to be (S12), so the gas fraction is modest with . The total baryonic mass = is 9 – . This is consistent with the dynamical mass for the system, based on the [CII] linewidths and spatial extent, of (S12).
ALESS65.1 is detected in the 870m continuum by ALMA and weakly detected in the far-infrared (FIR) by Herschel (S12). A fit to the IR SED resulted in a restframe IR (8 – 1000 m) luminosity (S12), which corresponds to a star formation rate of 340 yr-1 using the conversion of Kennicutt (1998). The gas depletion timescale Myr is similar to the gas depletion rates of other high redshift SMGs (Schinnerer et al., 2008; Coppin et al., 2010). This short timescale provides further evidence that SMGs have the gas consumption timescales necessary to be the progenitors of red-and-dead “ellipticals” at .
Next we examine the physical conditions of the gas in ALESS65.1 using the [CII] detection and 12CO(2–1) limit. The versus diagram is a powerful diagnostic as these two ratios are sensitive to gas density and the incident far-ultraviolet (FUV) flux (Stacey et al., 1991). Figure 2 shows ALESS65.1 compared with other low and high redshift galaxies, and solar metallically PDR model curves (Kaufman et al., 1999). This diagram can be used to roughly estimate both and for a galaxy, but there are some caveats, as outlined in De Breuck et al. (2011). These are: (i) the 12CO luminosity is that of the ground state rotational line, (ii) [CII] emission from the diffuse ionised medium and cosmic-ray-heated gas is assumed to be small compared to that from PDRs, and (iii) AGN and their related X-Ray Dissociation Regions (XDRs) are assumed to not contribute significantly to the FIR and [CII] luminosity. To be consistent with both De Breuck et al. (2011) and Stacey et al. (2010) in Figure 2 we assume , which is 90% of its value if the gas was fully thermalised and optically thick. Cosmic ray rates are greater in starbursts compared to normal galaxies but this does not seem to result in higher [CII]/CO ratios, so cosmic ray ionization does not appear to dominate the [CII]/CO ratio (De Breuck et al., 2011), at least for local galaxies. ALESS65.1 is not detected in the 250ks Chandra X-Ray observations of this region (Lehmer et al., 2005), so it is not a luminous QSO (–3 erg s-1, for – 1023.5 cm-2). The maximum likely AGN contribution to the FIR luminosity is estimated from a multicomponent (AGN and starburst) fit to the FIR using Decompir software (Mullaney et al., 2011) and following the method described by (Seymour et al., 2012). We use the 24 m flux density upper limit to constrain the short wavelength part of the IR SED and find the AGN contribution to the total FIR luminosity is 10%. ALESS65.1 therefore appears to be dominated by star-formation processes and the AGN contribution to [CII] and is minimal.
| Parameter | Value | Reference |
|---|---|---|
| 4.4445 0.0005 | S12 | |
| 5.4 0.7 Jy km s-1 | S12 | |
| FWHM[CII] | 470 35 km s-1 | S12 |
| (3.2 0.4) | S12 | |
| 11footnotemark: 1 | (1.38 0.28) | S12 |
| Jy km s-1 (3) | this paper | |
| (3) | this paper | |
| 8.5 (3) | this paper | |
| 2.2 K km s-1 pc2 | this paper |
In examining the PDR physical conditions, we multiply the 12CO(2–1) flux by a factor of two to account for the line being optically thick, and hence only the 12CO emission coming from the illuminated PDR side is seen (Kaufman et al., 1999; Hailey-Dunsheath et al., 2010). We also multiply the [CII] flux by a factor of 0.7 to remove non-PDR contributions (e.g. Hailey-Dunsheath et al., 2010; Stacey et al., 2010). The 12CO geometry correction applies to all galaxies in Figure 2, and so does not affect the relative position of ALESS65.1 on the diagram compared to other galaxies. Using the Kaufman et al. (1999) models, we find ALESS65.1 has and cm-3 (Figure 2). Such a FUV radiation field is on the high end of those seen in low redshift normal galaxies, but it is consistent with the strong FUV fields seen in local starbursts, nearby ULIRGs, and some galaxies. This limit on and implies a PDR temperature 300 K (Kaufman et al., 1999). Using Equation 1 from Hailey-Dunsheath et al. (2010), we estimate the atomic gas associated with the PDR to be greater than 3 . We note that this atomic mass estimate is very uncertain, and it is highly dependent on . The atomic gas mass , so for cm-3 the atomic mass would be 6 .
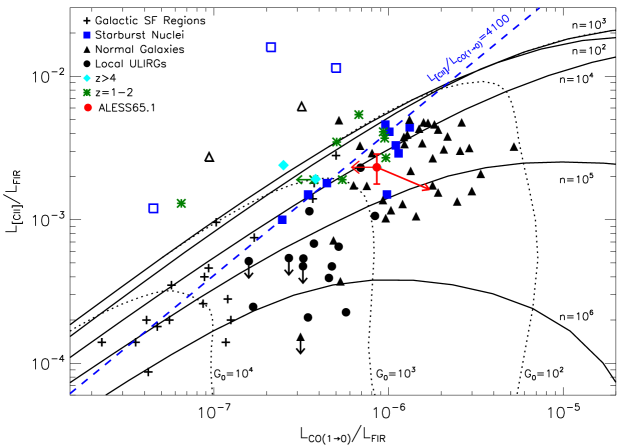
ALESS65.1 and the other two SMGs shown in Figure 2, LESS J033229.4 (De Breuck et al. 2011) and HDF850.1 (Walter et al. 2012), have a similar FUV radiation field, , to local starbursts, but have much higher FIR luminosity, leading to suggestions that they are scaled-up versions of local starbursts. For a given the size of the emission region will increase for smaller . Following Stacey et al. (2010), we scale up from M82 using two laws from Wolfire et al. (1990) to constrain the size: if the mean free path of a UV photon is small and if the mean free path of a UV photon is large. Applying these relations and using for ALESS65.1 yields a diameter of 1.1 – 2.1 kpc. This is consistent with the marginally resolved [CII] data which shows ALESS65.1 has a possible extent of 3.3 1.7 kpc (S12). The same scaling relation applied to HDF850.1 results in a diameter of 1.8 – 4.6 kpc, which is consistent with the observed 5.7 1.9 kpc extent of the [CII] emission region (Walter et al. 2012). Similarly, LESS J033229.4 has an extent of 4 kpc (Coppin et al. 2010; De Breuck et al. 2011). Thus the starburst in all three SMGs appears to be extended over galactic scales.
Local starbursts and Galactic OB star forming regions lie on a line with [CII]/CO luminosity ratios of about 4100 in Figure 2. Higher [CII]/CO ratios can also be found in low metallicity systems, such as 30 Doradus in the LMC, where the size of the [CII] emitting envelope of the cloud (relative to the the CO emitting core) is much larger than in more metal-rich systems (Stacey et al., 1991). Metallicity may also affect the [CII]/CO ratios of the highest redshift galaxies. For example, LESS J033229.4 at has a very high [CII]/CO ratio of and was initially thought to have sub-solar metallicity (De Breuck et al., 2011), but more recent [NII] observations suggest that the metallicity of this galaxy is solar (Nagao et al., 2012). ALESS65.1 has , which is consistent with low metallicity, but it has an extent of several kpc so therefore the enhanced [CII] emission is more likely to be due to the extended star forming region. An extended (or less-dense) interstellar medium would have an increased fraction of UV photons available to ionize and excite gas, increasing the relative intensity of fine structure lines (e.g. Graciá-Carpio et al., 2011).
We have assumed a single-phase ISM in this work. Multi-phase ISMs are commonly required to explain the 12CO line ratios observed in local galaxies (e.g. Guesten et al., 1993; Ward et al., 2003). In some cases a single-component ISM is unable to explain the 12CO-excitation ladder (or spectral line energy distribution) observed in high redshift SMGs (Carilli et al., 2010; Harris et al., 2010; Danielson et al., 2011). These studies found that the ISM in such sources is best described by a warm compact component surrounded by a cooler more extended one. Support for such a multi-component geometry in high-redshift sources has recently been found in the spatially-resolved 12CO study of the gravitationally-magnified submm galaxy SMM J21350102 (Swinbank et al., 2011; Danielson et al., 2011). Future higher-resolution continuum and line studies with ALMA may uncover similar evidence in ALESS 65.1, but the current data provide no direct evidence.
4 Conclusion
We have observed ALESS65.1 for 20 hours to search for 12CO(2–1) emission in this submillimetre galaxy. We detect no 12CO(2–1) emission in a spectrum reaching a rms sensitivity of 0.08 mJy beam-1 per 200 km s-1 channel.
Adopting the FWHM from the ALMA detection of [CII] in ALESS65.1, we estimate a limit to the 12CO(2–1) luminosity of and a cold gas mass upper limit of . This implies a gas depletion timescale in ALESS65.1 of Myr, comparable to other SMGs and consistent with this high redshift population being the progenitors of red-and-dead galaxies.
We examine the physical conditions of the gas in ALESS65.1 using the versus diagram. We find ALESS65.1 has a strong FUV field comparable to local starbursts. The observed [CII] to FIR ratio, , is high compared to local ULIRGs (as noted by S12). Combined with , this high [CII] to FIR ratio is consistent with ALESS65.1 having more extended regions of intense star-formation than local ULIRGs. A possible, but less likely scenario, is ALESS65.1 has low metallicity gas.
Measurements of [CII] and 12CO of a larger sample are needed to confirm whether starbursts have enhanced [CII] emission compared to local galaxies, and whether this is because of metallicity effects, the relative size of PDR regions, a combination of the two, or other effects. Future surveys by ALMA will shed further light on the physical conditions of the gas in star forming galaxies in the early universe.
Acknowledgments
AK and IRS acknowledge support from the STFC and IRS also acknowledges support from the Leverhulme Trust. TRG acknowledges support from an STFC Advanced Fellowship. KC acknowledges support from the endowment of the Lorne Trottier Chair in Astrophysics and Cosmology at McGill and the Natural Science and Engineering Research Council of Canada (NSERC). NS is the recipient of an Australian Research Council Future Fellowship. KK thanks the Swedish Research Council for support. The Australia Telescope is funded by the Commonwealth of Australia for operation as a National Facility managed by CSIRO. This paper makes use of ALMA data from the project ADS/ JAO.ALMA#2011.1.00294.S. ALMA is a partnership of ESO (representing its member states), NSF (USA) and NINS (Japan), together with NRC (Canada) and NSC and ASIAA (Taiwan), in cooperation with the Republic of Chile. The Joint ALMA Observatory is operated by ESO, AUI/NRAO and NAOJ.
References
- Biggs & Ivison (2008) Biggs A. D., Ivison R. J., 2008, MNRAS, 385, 893
- Blain et al. (2002) Blain A. W., Smail I., Ivison R. J., Kneib J.-P., Frayer D. T., 2002, Phys. Rep., 369, 111
- Bothwell et al. (2012) Bothwell M. S. et al., 2012, ArXiv e-prints
- Bothwell et al. (2013) Bothwell M. S. et al., 2013, MNRAS, 563
- Capak et al. (2008) Capak P. et al., 2008, ApJ, 681, L53
- Capak et al. (2011) Capak P. L. et al., 2011, Nature, 470, 233
- Carilli et al. (2010) Carilli C. L. et al., 2010, ApJ, 714, 1407
- Carilli et al. (2011) Carilli C. L., Hodge J., Walter F., Riechers D., Daddi E., Dannerbauer H., Morrison G. E., 2011, ApJ, 739, L33
- Chapman et al. (2005) Chapman S. C., Blain A. W., Smail I., Ivison R. J., 2005, ApJ, 622, 772
- Chapman et al. (2004) Chapman S. C., Smail I., Windhorst R., Muxlow T., Ivison R. J., 2004, ApJ, 611, 732
- Cimatti et al. (2008) Cimatti A. et al., 2008, A&A, 482, 21
- Combes et al. (2012) Combes F. et al., 2012, A&A, 538, L4
- Coppin et al. (2010) Coppin K. E. K. et al., 2010, MNRAS, 407, L103
- Coppin et al. (2009) Coppin K. E. K. et al., 2009, MNRAS, 395, 1905
- Cox et al. (2011) Cox P. et al., 2011, ApJ, 740, 63
- Crawford et al. (1985) Crawford M. K., Genzel R., Townes C. H., Watson D. M., 1985, ApJ, 291, 755
- Daddi et al. (2009a) Daddi E., Dannerbauer H., Krips M., Walter F., Dickinson M., Elbaz D., Morrison G. E., 2009a, ApJ, 695, L176
- Daddi et al. (2009b) Daddi E. et al., 2009b, ApJ, 694, 1517
- Danielson et al. (2011) Danielson A. L. R. et al., 2011, MNRAS, 410, 1687
- De Breuck et al. (2011) De Breuck C., Maiolino R., Caselli P., Coppin K., Hailey-Dunsheath S., Nagao T., 2011, A&A, 530, L8
- Downes & Solomon (1998) Downes D., Solomon P. M., 1998, ApJ, 507, 615
- Emonts et al. (2011) Emonts B. H. C. et al., 2011, MNRAS, 415, 655
- Gooch (1996) Gooch R., 1996, in Astronomical Society of the Pacific Conference Series, Vol. 101, Astronomical Data Analysis Software and Systems V, Jacoby G. H., Barnes J., eds., p. 80
- Graciá-Carpio et al. (2011) Graciá-Carpio J. et al., 2011, ApJ, 728, L7
- Greve et al. (2005) Greve T. R. et al., 2005, MNRAS, 359, 1165
- Guesten et al. (1993) Guesten R., Serabyn E., Kasemann C., Schinckel A., Schneider G., Schulz A., Young K., 1993, ApJ, 402, 537
- Hailey-Dunsheath et al. (2010) Hailey-Dunsheath S., Nikola T., Stacey G. J., Oberst T. E., Parshley S. C., Benford D. J., Staguhn J. G., Tucker C. E., 2010, ApJ, 714, L162
- Hainline et al. (2009) Hainline L. J., Blain A. W., Smail I., Frayer D. T., Chapman S. C., Ivison R. J., Alexander D. M., 2009, ApJ, 699, 1610
- Harris et al. (2010) Harris A. I., Baker A. J., Zonak S. G., Sharon C. E., Genzel R., Rauch K., Watts G., Creager R., 2010, ApJ, 723, 1139
- Heiles (1994) Heiles C., 1994, ApJ, 436, 720
- Hodge et al. (2012) Hodge J. A., Carilli C. L., Walter F., de Blok W. J. G., Riechers D., Daddi E., Lentati L., 2012, ApJ, 760, 11
- Ivison et al. (2011) Ivison R. J., Papadopoulos P. P., Smail I., Greve T. R., Thomson A. P., Xilouris E. M., Chapman S. C., 2011, MNRAS, 412, 1913
- Ivison et al. (2010a) Ivison R. J., Smail I., Papadopoulos P. P., Wold I., Richard J., Swinbank A. M., Kneib J.-P., Owen F. N., 2010a, MNRAS, 404, 198
- Ivison et al. (2010b) Ivison R. J. et al., 2010b, A&A, 518, L35
- Karim et al. (2012) Karim, A., et al. 2012, arXiv:1210.0249
- Kaufman et al. (1999) Kaufman M. J., Wolfire M. G., Hollenbach D. J., Luhman M. L., 1999, ApJ, 527, 795
- Kennicutt (1998) Kennicutt, Jr. R. C., 1998, ARA&A, 36, 189
- Knudsen et al. (2010) Knudsen K. K., Kneib J.-P., Richard J., Petitpas G., Egami E., 2010, ApJ, 709, 210
- Lehmer et al. (2005) Lehmer B. D. et al., 2005, ApJS, 161, 21
- Madden et al. (1993) Madden S. C., Geis N., Genzel R., Herrmann F., Jackson J., Poglitsch A., Stacey G. J., Townes C. H., 1993, ApJ, 407, 579
- Marchesini et al. (2010) Marchesini D. et al., 2010, ApJ, 725, 1277
- Menéndez-Delmestre et al. (2009) Menéndez-Delmestre K. et al., 2009, ApJ, 699, 667
- Middelberg et al. (2006) Middelberg E., Sault R. J., Kesteven M. J., 2006, PASA, 23, 147
- Mullaney et al. (2011) Mullaney J. R., Alexander D. M., Goulding A. D., Hickox R. C., 2011, MNRAS, 414, 1082
- Nagao et al. (2012) Nagao T., Maiolino R., De Breuck C., Caselli P., Hatsukade B., Saigo K., 2012, A&A, 542, L34
- Riechers et al. (2010) Riechers D. A. et al., 2010, ApJ, 720, L131
- Sault & Killeen (1999) Sault R. J., Killeen N. E. B., 1999, MIRIAD User’s Guide. Australia Telescope National Facility, Sydney, Ausdtralia
- Schinnerer et al. (2008) Schinnerer E. et al., 2008, ApJ, 689, L5
- Seymour et al. (2012) Seymour N. et al., 2012, ApJ, 755, 146
- Smolčić et al. (2011) Smolčić V. et al., 2011, ApJ, 731, L27
- Smolčić et al. (2012) Smolčić V. et al., 2012, ApJS, 200, 10
- Stacey et al. (1991) Stacey G. J., Geis N., Genzel R., Lugten J. B., Poglitsch A., Sternberg A., Townes C. H., 1991, ApJ, 373, 423
- Stacey et al. (2010) Stacey G. J., Hailey-Dunsheath S., Ferkinhoff C., Nikola T., Parshley S. C., Benford D. J., Staguhn J. G., Fiolet N., 2010, ApJ, 724, 957
- Swinbank et al. (2006) Swinbank A. M., Chapman S. C., Smail I., Lindner C., Borys C., Blain A. W., Ivison R. J., Lewis G. F., 2006, MNRAS, 371, 465
- Swinbank et al. (2012) Swinbank A. M. et al., 2012, MNRAS, 427, 1066
- Swinbank et al. (2011) Swinbank A. M. et al., 2011, ApJ, 742, 11
- Tacconi et al. (2006) Tacconi L. J. et al., 2006, ApJ, 640, 228
- Thomson et al. (2012) Thomson A. P. et al., 2012, MNRAS, 425, 2203
- Walter et al. (2012) Walter F. et al., 2012, Nature, 486, 233
- Ward et al. (2003) Ward J. S., Zmuidzinas J., Harris A. I., Isaak K. G., 2003, ApJ, 587, 171
- Wardlow et al. (2011) Wardlow J. L. et al., 2011, MNRAS, 415, 1479
- Weiß et al. (2009) Weiß A. et al., 2009, ApJ, 707, 1201
- Wolfire et al. (1990) Wolfire M. G., Tielens A. G. G. M., Hollenbach D., 1990, ApJ, 358, 116
- Yun et al. (2012) Yun M. S. et al., 2012, MNRAS, 420, 957