The frequency-dependence of nonlinear conductivity in disordered systems: an analytically solvable model
Abstract
For the hopping dynamics in a one-dimensional model, containing energy and barrier disorder, we determine the linear and nonlinear response to an external field for arbitrary external frequencies. The calculation is performed in analytical terms. We systematically analyze the parameter space and find three different regimes, corresponding to qualitatively different frequency dependencies of the nonlinear response. Two regimes agree with the results of recent conductivity experiments on inorganic ion conductors and ionic liquids, respectively. The ratio of the nonlinear and linear conductivity in the dc-regime can be explicitly expressed in terms of the disorder parameters. As a generic feature the nonlinear conductivity displays a minimum as a function of frequency which can be identified with forward-backward dynamics in a double-well potential. The magnitude and sign of the nonlinear conductivity around the minimum is a measure of the disorder, inherent in this model. Surprisingly, the frequency of the minimum is hardly influenced by the disorder.
I Introduction
Nonlinear ion transport in disordered systems, like glasses and liquids, is of interest for mainly two reasons: (i) In electrochemical devices, the integration of thin-film electrolytes reduces the overall electrical resistance. In thin films, even small voltage drops may lead to high electric fields and to a field-dependent ionic conductivity. (ii) From a basic science point of view, the study of nonlinear effects yields additional information about ion transport mechanisms.
When high dc electric fields are applied to isotropic ionic conductors, the field dependence of the nonlinear current density can be described in a first approximation by Vermeer56 ; Zagar69 ; Lacharme78 ; Hyde86 ; Barton96 ; Isard96 :
| (1) |
Here, denotes the ionic charge and the ’apparent jump distance’.
A experimental method for measuring nonlinear conductivities is the application of large ac electric fields . In the dc-limit can be identified with . Nonlinear conductivity then leads to the presence of higher order harmonic terms for the resulting current. For isotropic systems nonlinear effects are reflected in terms proportional to and higher harmonics. Taking into account only those terms which represent conductivity in phase with the electric field one can generally write Roling08 :
| (2) |
In general is frequency dependent for disordered systems. For the dc-limit the validity of Eq.1 translates into the following expressions: and .
Via the relation
| (3) |
it is possible to determine the apparent hopping distance from knowledge of and .
Typically, measured values for range between 1.5 nm and 3 nm Vermeer56 ; Zagar69 ; Lacharme78 ; Hyde86 ; Barton96 ; Isard96 . These values are much larger than the typical hopping distance of ion transport which, e.g., for alkali silicate systems is around to 0.25 nm Banhatti . It has been shown theoretically that, in a disordered potential landscape, the value of cannot be related to in a simple way Roling08 . Only in a regular potential, is identical to the hopping distance of the ions.
Experimentally, nonlinear ac measurements have been carried out on alkali-ion conducting glasses as well as on the ionic liquid HMIM-TFSI Roling08 ; Murugavel05 ; Heuer05 ; Staesche10 ; Staesche10a ; Feiten12 . In both cases, the nonlinear conductivity was positive in the dc regime and gradually decreased with increasing frequency. In the case of the alkali ion conducting glasses, became negative in the dispersive regime. Furthermore, the onset frequency for the linear and nonlinear conductivity, from which on deviations from the dc-regime become relevant, are nearly identical. In contrast, remained positive for the ionic liquid over the entire frequency range. Furthermore it turned out that the frequency-dependence already starts at lower frequencies for the nonlinear conductivity Feiten12 . Finally we mention that from general arguments it follows (see, e.g. Roling08 ) that one expects a positive high-frequency regime. This has been explicitly shown, e.g., for simulations of a one-dimensional hopping model Roling08 .
The theoretical understanding of the ion dynamics is complex due to the strong interaction among the mobile entities ingram:1987 ; dyre:2009 ; maass:1999 ; Funkerecent . Several groups have studied single-particle hopping motion in a discrete disordered energy landscape to learn about the linear conductivity; see, e.g., hunt:1991 ; baranovskii:1999 ; dyre:2000 ; dyrenew . Recently, this approach has found a numerical justification since to a good approximation the ion dynamics can be mapped on a single-particle vacancy dynamics between distinct sites lammert:2010 .
For 1D models it is possible to analytically calculate the linear and nonlinear dc-current Heuer05 ; Kehr97 ; Eimax . Interestingly, for periodic boundary conditions the conductivity displays non-analytic behavior at zero field in the thermodynamic limit Roling08 ; Eimax . From studying a disordered discrete 3D-energy landscape via computer simulations it turned out that for a Gaussian distribution of site energies the experimental relation can be recovered Rothel . Surprisingly, for box-type distribution is even negative, so that according to Eq.3 it is not possible to get a real value for . Thus, a priori the observation is non-trivial.
To understand the frequency-dependence of , the dynamics within a double-well potential were studied in Roling2002 . Except for the positive high-frequency plateau, is negative throughout the remaining frequency range. In general it is not evident whether the restriction to a double-well potential is sufficient to explain the frequency-dependence of .
Here we present a periodic 1D model which, on the one hand, displays typical behavior of disordered systems but, on the other hand, is simple enough so that the frequency dependence of the linear and the nonlinear conductivity can be calculated analytically. Discussion of this model will broaden the understanding of the experimental observations described above. This model contains three parameters, reflecting the typical barrier heights, the site disorder and the barrier disorder. Two questions are of particular relevance: (1) How do these parameters influence the qualitative frequency-dependence of the nonlinear conductivity? (2) To which degree can the theoretical description of the minimum in the nonlinear conductivity be reduced to the dynamics in local double-well potentials?
The paper is organized as follows. In Sect. II we introduce the model. The analytical results can be found in Sect. III. They will be discussed in Sect. IV. We conclude in Sect. V.
II Model

As a model we consider a periodic potential with two different wells. It is characterized by the three energy values , and ; see Fig.1. In what follows we always consider . A particle performs activated hopping between adjacent sites. We introduce the probabilities that the particle is in the left or the right well, respectively. In particular one has . The activation barriers are modulated by the external potential .
In case of a regular potential, i.e. and this simple model yields
| (4) |
Via comparison with Eq.1 we can relate to the experimental parameters, i.e.
| (5) |
As mentioned above, for this regular potential one has . For reasons of simplicity we will express all our results in terms of . Furthermore, we choose , i.e. we express all energies in terms of .
There are two possible transitions from well 1 to 2 and vice versa. This yields for the transition rate from well 1 to well 2
| (6) |
with
| (7) |
and
| (8) |
For simplification we choose the kinetic prefactor to be unity. Introducing the notation one can therefore write
| (9) |
In analogy one obtains
| (10) |
Now one can write the rate equation for as
| (11) | ||||
| (12) |
To simplify this rate equation we introduce the equilibrium population of , denoted as , given by the Boltzmann factor ()
| (13) |
and define as the difference to the equilibrium population, i.e.
| (14) |
Then a straightforward calculation Bachelor yields from Eq.12
| (15) |
Here we used the abbreviations and as well as
| (16) |
III Analytical solution
III.1 Non-equilibrium population
The general solution of can be written as a sum over the different harmonics and , i.e.
| (19) |
Formally, the individual and can be written as a Taylor series in . One can easily show that the lowest-order terms of and , respectively, are proportional to .
To calculate the current which is in phase with the external field only the cosine-terms, i.e. the , are of relevance. In what follows we define
| (20) |
Since for small fields , the are independent of and characterize the nonlinear dynamics in the experimentally relevant case of weak nonlinear effects. Similarly, one can define the as new coefficients for the sine terms.
After inserting Eq.19 into Eq.15, and expanding the exponential terms in terms of the different harmonics (, , obtained after application of appropriate addition theorems) one can set all terms, belonging to the same harmonics and the same exponent in , to zero. This yields a system of linear equations in the and which can be solved iteratively, starting with . After a tedious but straightforward calculation one ends up with
| (21) |
| (22) |
and
| (23) |
Here we use the abbreviations
| (24) | ||||
| (25) |
III.2 Calculation of the conductivity
The dynamics of a charged particle in the periodic potential can be characterized by a current. Based on the time-dependent populations as determined in the previous section one can generally write for the current
| (26) |
which can be rewritten with as
| (27) |
Here we have used the abbreviations and . From now on we will choose again .
For the subsequent calculations the exponential-terms have to be expanded with respect to . Furthermore, for the population the expression from Eq.19 combined with Eq.14 can be inserted. Then one needs to combine again all terms which scale with the same harmonics and the same exponent in in analogy to the calculation of the . This results in an expression for the current which contains terms proportional to or for all integer , as well as the coefficients .
Macroscopic disordered systems behave isotropically, i.e. the reversal of an electric field leads to a reversal of the current. In contrast, the present model is anisotropic for . To enable a direct comparison with the experimental situation, we therefore average over two opposite directions of the field. As a consequence only the odd harmonics (i.e. ) and only terms which are uneven with respect to remain. All other terms cancel. Thus, one can finally write
| (28) |
where the lowest order term of is proportional to . In analogy to the discussion of the populations we define the conductivities via
| (29) |
thereby capturing the effect of the external potential in lowest order.
Via comparison with Eq.2 one can identify and . The experimentally relevant quantity can thus be expressed as (also using Eq.5)
| (30) |
More generally we define
| (31) |
In what follows we give the results of the lengthy but straightforward calculations described above Bachelor . The in-phase terms read
| (32) |
and
| (33) | |||||
These equations are the key result of this work because all conclusions, discussed below, follow from them.
Of particular interest are the limits at vanishing or infinite frequency. After some algebra one obtains
| (34) |
| (35) |
| (36) |
and
| (37) |
Furthermore, it is also possible to express the whole frequency-dependence of the linear conductivity by a simple expression. It is given by
| (38) |
Naturally, this expression is consistent with the two limiting cases, given above.
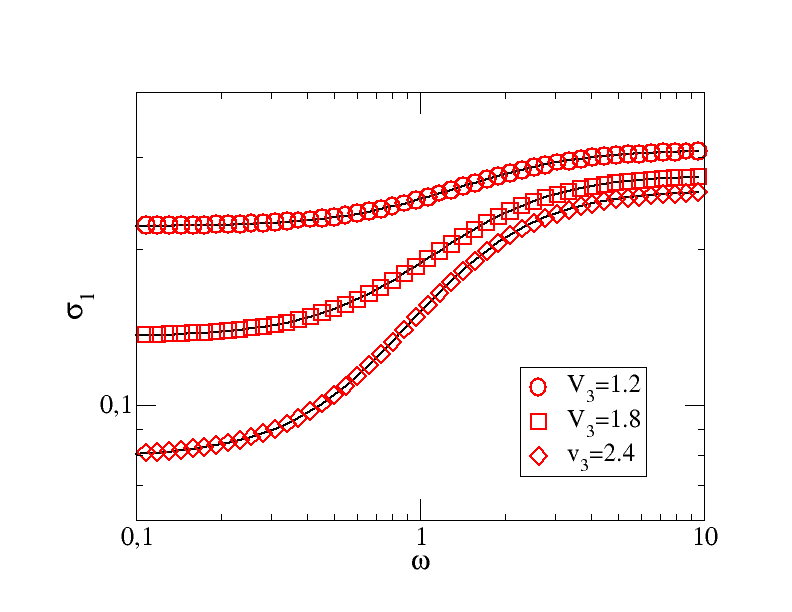

Due to the complexity of the expressions we first check that straightforward numerical simulations of the corresponding rate equations and subsequent determination of the current via Fourier transformation agree with the analytical expressions. This is shown in Fig.2. Indeed, one can find an excellent agreement (also, for other values of and not shown here) which strongly supports the correctness of our algebraic calculations.
IV Discussion
First, we discuss as introduced in Eq.31. For the special case of an ordered potential (i.e. ), one obtains . Generally, in the high-frequency limit all values disappear, i.e. the populations of the two wells do not differ from the Boltzmann distribution. As a consequence, is unity. One can also see from Eqs.21 -23 that for the specific case all disappear for all finite frequencies. As a consequence, both the linear and the nonlinear conductivity are frequency-independent and thus trivially display the same ratio for all frequencies. This limit corresponds to the case of vanishing barrier disorder, i.e. . A prototype model for this scenario is the trap model Bouchaud .
Of particular interest is the zero-frequency limit of . Based on Eqs.32 and 33 one obtains
| (39) |
Thus, for or , equivalently or , the proportion between the nonlinear and linear part of the conductivity becomes minimal. For large values of the asymmetry and the barrier disorder, can approach values as large as 7. Thus, for this model any disorder generally leads to in agreement with the experimental observation. Interestingly, for the dc-behavior the impact of the asymmetry is the same as the impact of the barrier disorder. Naturally, if expressing these results in terms of temperature one would expect an increase of with decreasing temperature.
It turns out that in the whole parameter space displays one minimum as a function of frequency. However, as shown in Fig.2 , two other properties , i.e. existence of negative values and sign of initial slope of strongly depend on the specific values of and as shown by variation of for fixed (here: =2). First, for the nonlinear conductivity does not acquire negative values whereas for negative values are observed. Second, the low-frequency slope of is negative for and positive else. This shows that, for certain , all possibilities can be realized through variation of . Via a numerical analysis we have analyzed each parameter pair with respect to these two properties. We have identified three different regimes: (I) Positive initial slope and presence of a negative frequency regime; (II) Negative initial slope and presence of negative frequency regime; (III) Negative initial slope and only positive values. The remaining possible option does not occur. The experimental data for ion conductors correspond to regime (II), those for ionic liquids to regime (I). A systematic identification of all three regimes can be found in Fig.3.
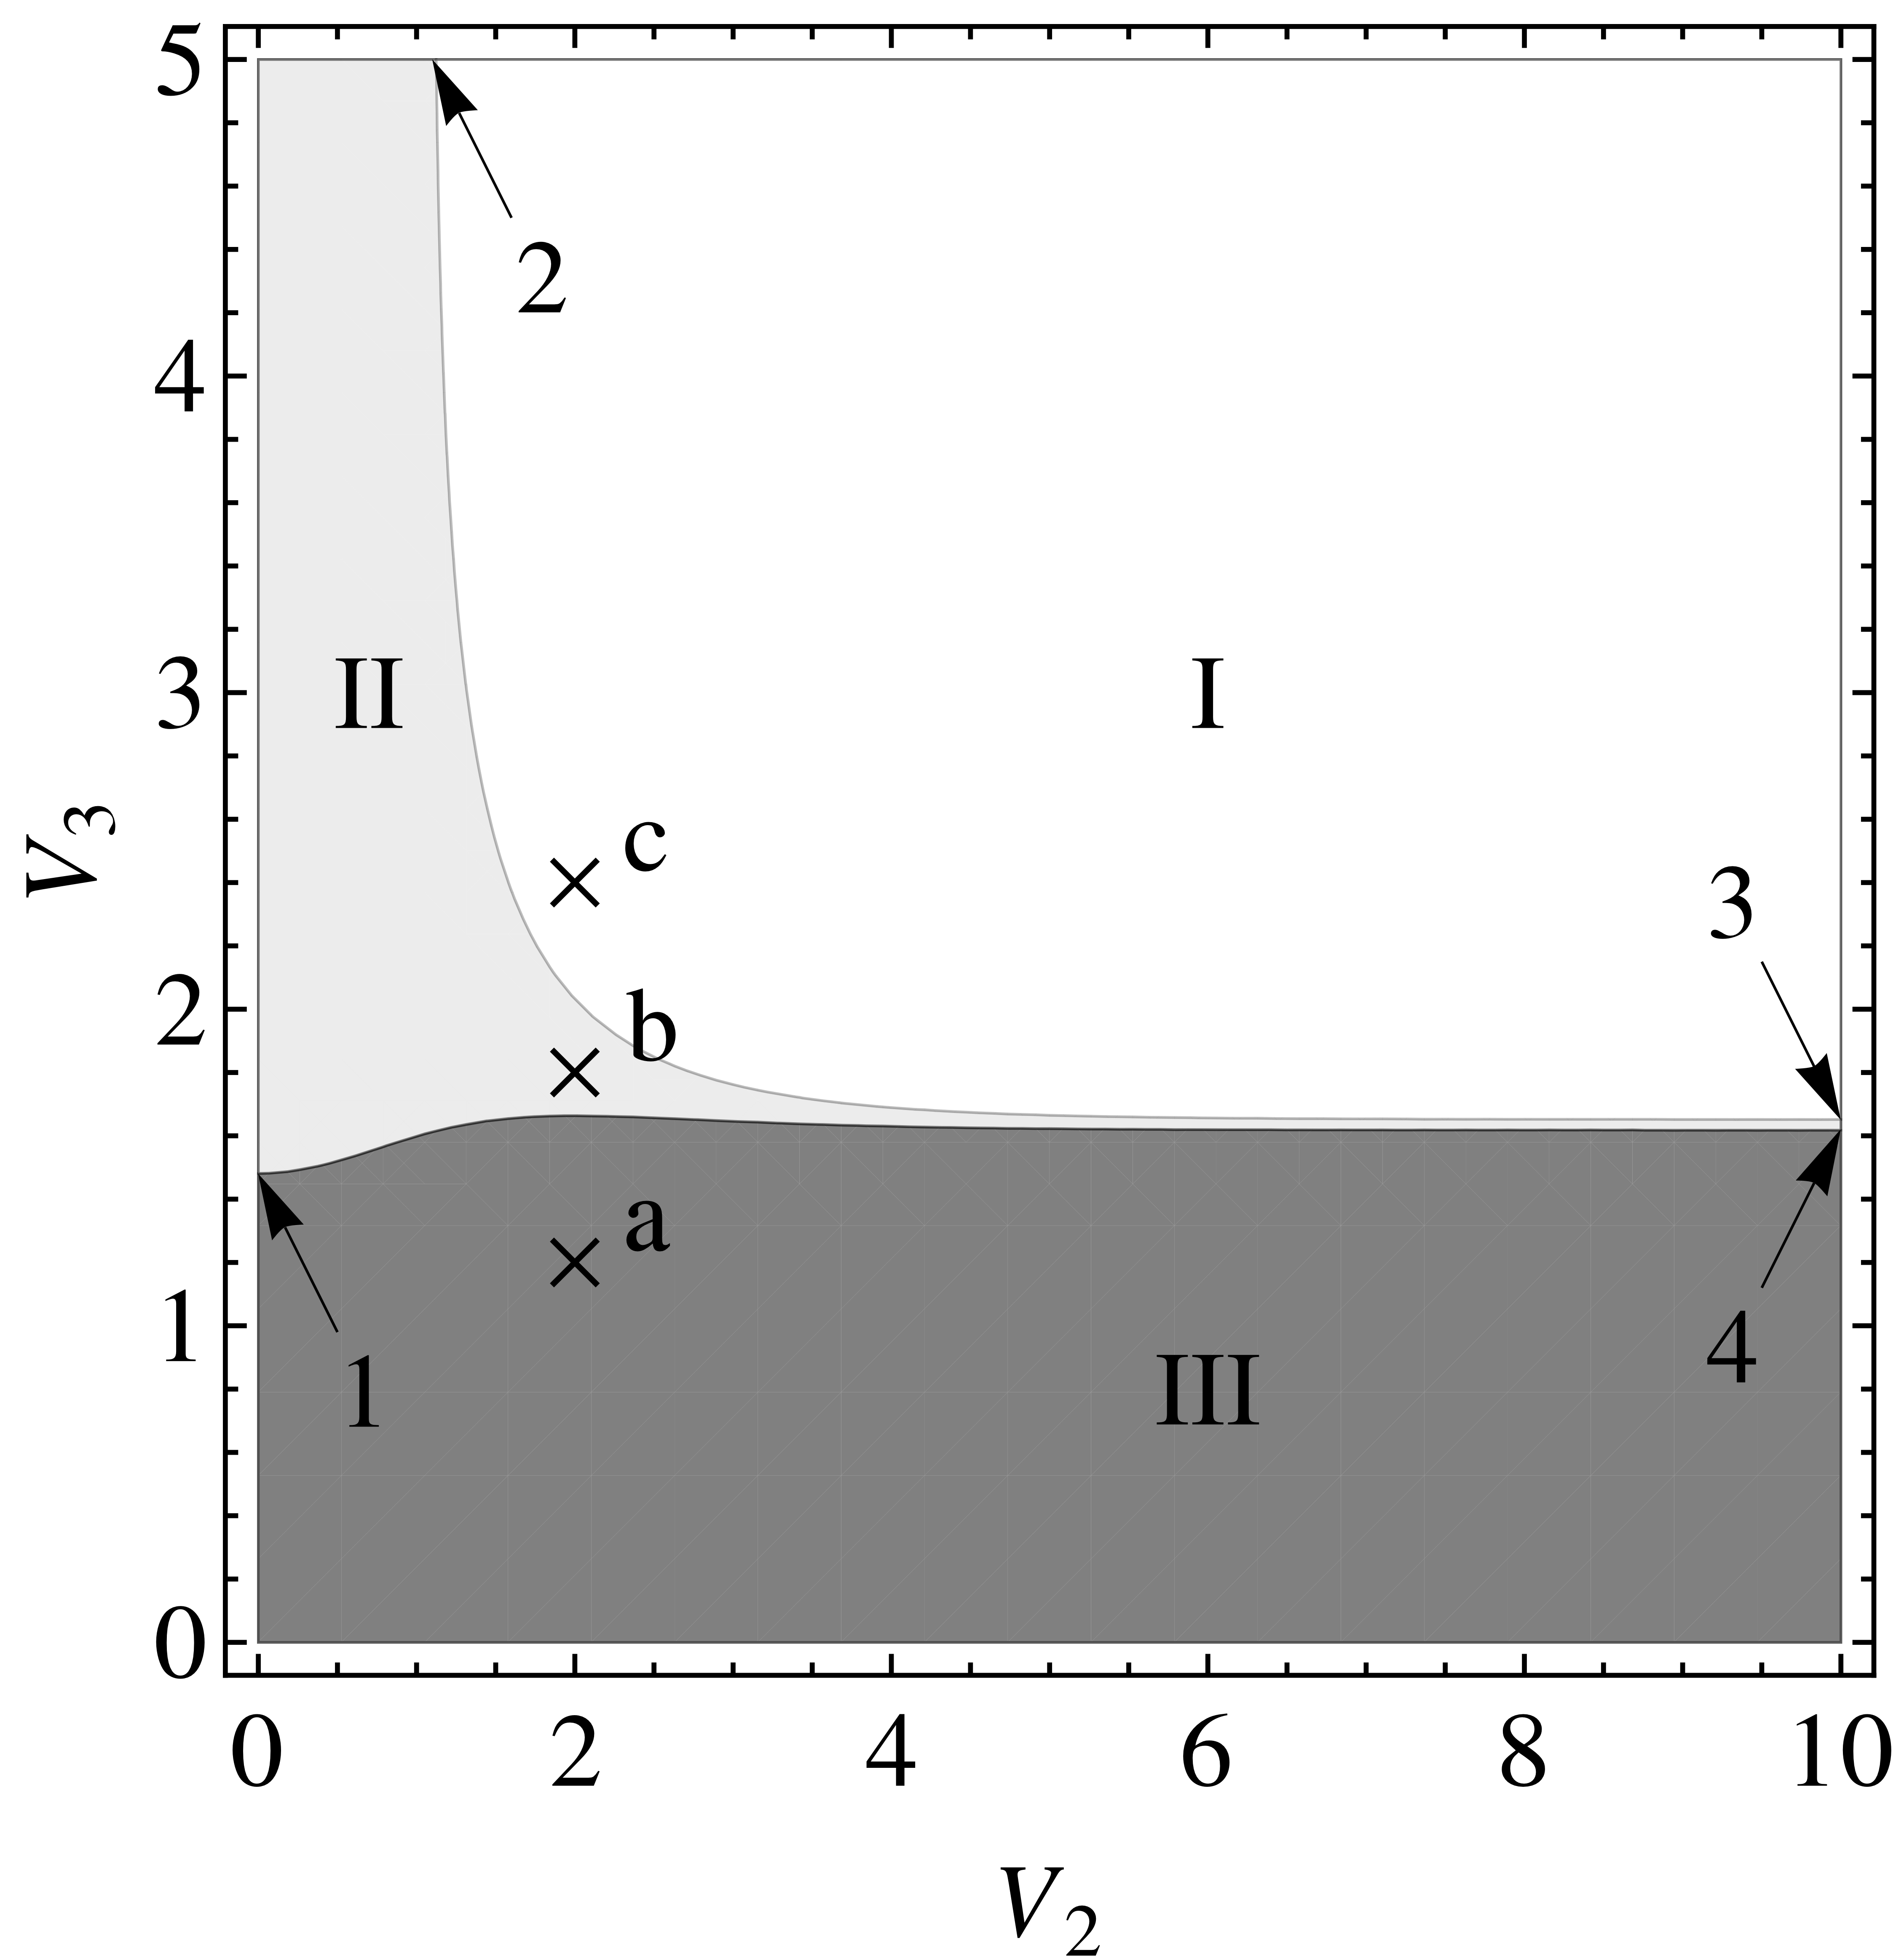
Interestingly, the presence of a negative regime hardly depends on the specific value of the asymmetry but rather on the difference of the barrier heights . In contrast, regime I is approximately symmetric with respect to the values of and .
Some of the limiting values of this phase diagram can be predicted even analytically. Due to the complexities of the resulting algebraic equations we have employed an algebra program (Mathematica). The following results were obtained: (1) The transition between regime II and III for occurs for . (2) The transition between regimes I and II for large , i.e. for vanishing slope of , occurs for . (3) The transition between both regimes for large occurs for . (4) The transition between regimes II and III for large occurs for . This last value emerges from solving a polynomial equation of 12th order and was determined only numerically.
In the limit , i.e. , the periodic potential transforms into a double-well potential DWP with vanishing dc-conductivity, so . In this case the system can either be described by regime I or by regime II. In both cases becomes negative for intermediate frequencies. Most importantly, upon variation of (mainly) the nonlinearity does acquire negative values (large , regime I or II) or only positive values (small , regime III). Thus, variation of the sign of at its minimum does not necessarily reflect different physical mechanisms. In this sense the different experimental results for inorganic ion conductors and ionic liquids mentioned in the Introduction may just reflect a different degree of disorder.
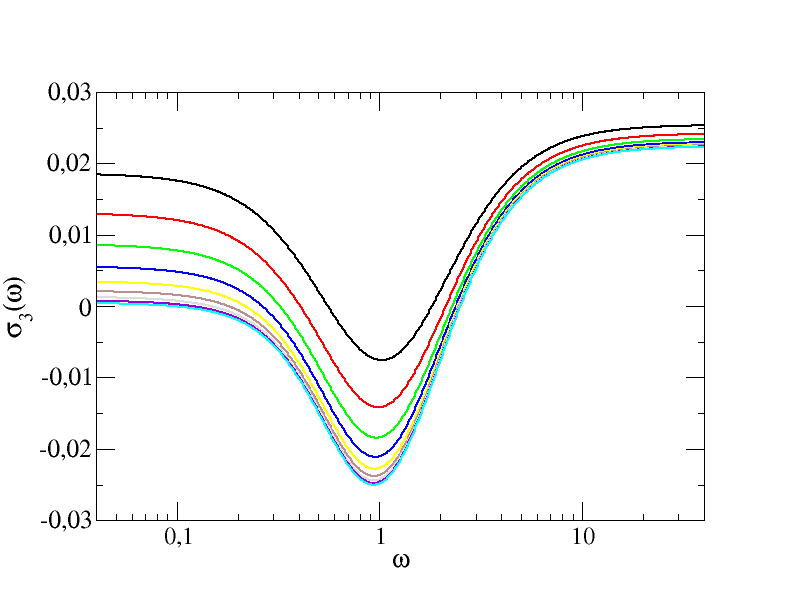
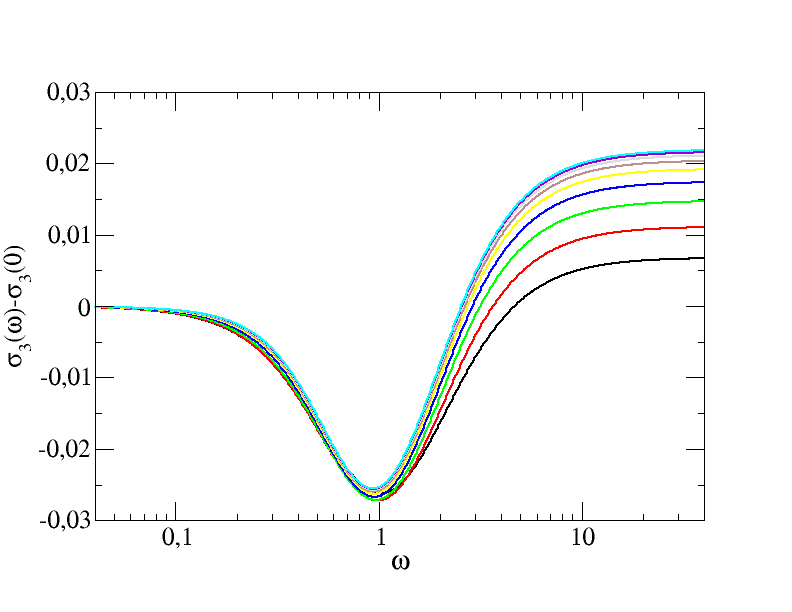
One may wonder whether the occurrence of the minimum in can be related to forward-backward motion in a local double-well potential , which would not contribute to an overall conductivity. If this were the case, the limit would already contain the relevant information about this frequency regime. In order to elucidate this aspect , we have calculated for a fixed value of and various values of . In order to stay in the experimentally relevant regime II we have chosen . The resulting graphs are shown in Fig.4 (left). Interestingly, the high-frequency plateau is nearly unchanged by and thus indeed just reflects the properties of the local DWP, governed by the asymmetry . This can be directly read off from the analytical expression Eq.37. However, also the frequency regime left of the minimum displays some specific properties. If one subtracts , the dc-value of the nonlinear conductivity, one finds a very similar behavior for different values of in this low-frequency regime ; see Fig.4 (right). Thus, in this frequency regime the nonlinear conductivity is basically a sum of the dc-value and the contribution of the double-well potential, described by . It turns out , though, that this simple superposition principle becomes worse in regime I or for .
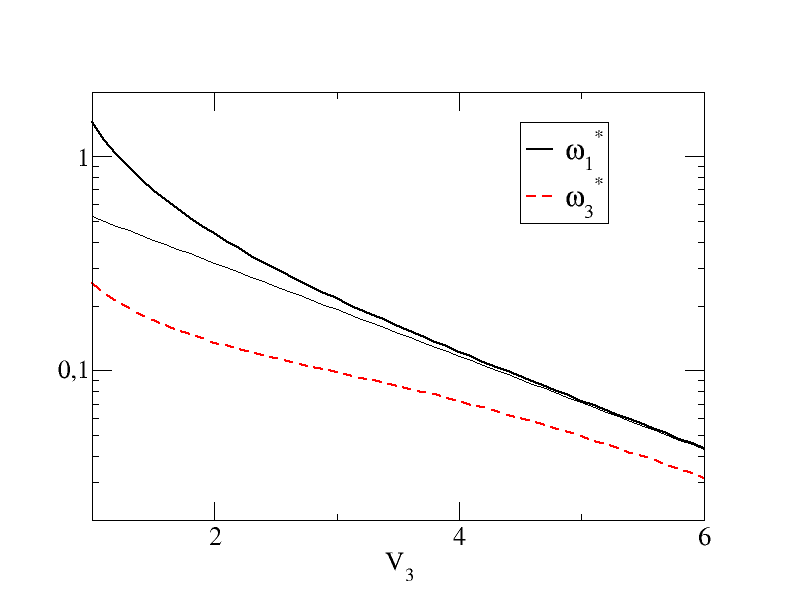
For a closer understanding of the nonlinear conductivity it may be of interest to compare its characteristic frequencies with those of the linear conductivity. We start by comparing the two onset-frequencies and which characterize the frequencies from which on deviations from the dc-regime are relevant, i.e. where the conductivity increases or decreases, respectively. Here we consider an increase and decrease of 10%, respectively, i.e. and . The qualitative behavior does not depends on this specific choice of 10%. can be calculated analytically from Eq.38. One obtains
| (40) |
which for large (i.e. ) can be approximated as
| (41) |
For the numerical analysis we restrict ourselves again to in order to avoid the regime III for better comparison with the experimental situation. We have varied over a broad range, encompassing the regimes I and II. As shown in Fig.5 there exists a significant dependence of on . The approximation Eq.41, i.e. the scaling with , roughly works for .
Due to the complexity of one cannot write down a simple analytical expression for . Therefore we restrict ourselves to the numerical determination of ; see Fig.5. Two important observations can be made: (1) The -dependences of and are identical for large (regime II). Both frequencies only differ by a constant factor close to unity. (2) For small , i.e. in regime I, one observes . We would like to stress that this is fully compatible with the experimental observations as reviewed in the Introduction (inorganic ion conductors: regime II; ionic liquids: regime I).
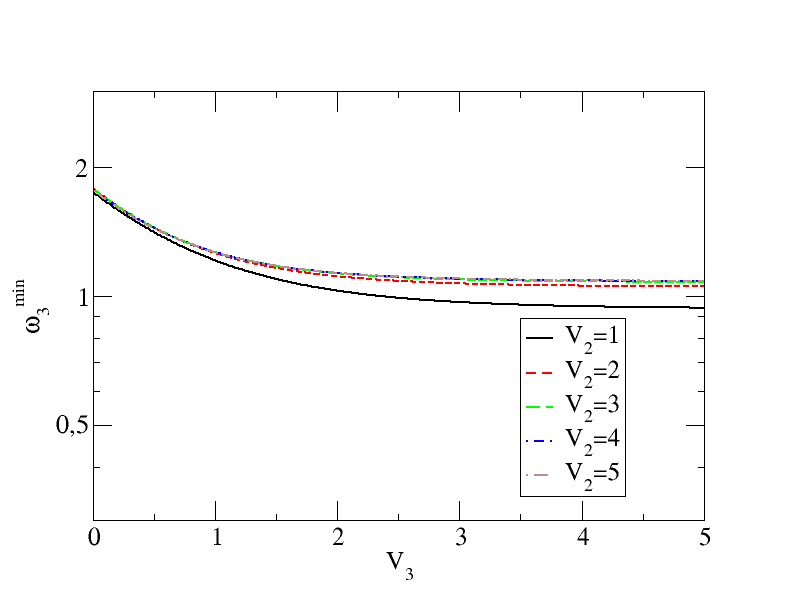
Another characteristic feature of is its minimum, occurring at a frequency . The data in Fig.2 already suggest that has no strong dependence on . We have analyzed its dependence on and . In Fig.6 we show more systematically, how depends on and . Obviously, the dependence is very minor; less than a factor of two if taking into account all possible parameter pairs ().
This has several interesting implications: (1) Whereas variation of and does not modify significantly, this is not true for variation of . As discussed above consideration of the -dependence gives rise to a trivial factor for all rates and all characteristic frequencies such as . This exponential dependence on thus has a significant impact on the frequency scales of the conductivity. Thus, the minimum frequency of the nonlinear conductivity is mainly sensitive to the typical barrier height between adjacent minima rather than the asymmetry or the barrier disorder. (2) Comparison of the linear and the nonlinear conductivity in Fig.2 leads to the assumption that the appropriate counterpart to is the frequency where the slope of is maximum in the double-logarithmic-representation. We denote this frequency by . Starting from Eq.38 it can be calculated analytically. One obtains
| (42) |
Since the dependence on is only via the factor , the dependence on vanishes for large in agreement with . In contrast to the frequency exponentially depends on for large values of via . However, due to the factor in the exponent, the dependence is significantly weaker than for . Thus, if at all, the minimum of the nonlinear conductivity is related to the region of maximum slope of the linear conductivity as evaluated in a double-logarithmic representation.
V Conclusion
The analyzed 1D hopping model may be considered as a minimum model, which captures the non-trivial frequency dependence of the nonlinear conductivity. Despite its simplicity, the algebraic calculations are quite lengthy and some results required the help of an algebra software. A key result was the presence of a minimum of the nonlinear conductivity for all parameters except for the trivial ordered case. The scaling properties of the different characteristic frequencies of the linear and nonlinear response allow one to see how the disorder influences the shape of the frequency-dependent conductivities. In comparison with the experimental results on inorganic ion conductors and ionic liquids it seems that the disorder effects are more pronounced in the first case.
Of course, this model mimics the true experimental system only in a very simple way. First, one has to consider that in reality one has a 3D rather than a 1D energy landscape. For example it turns out that for a random barrier landscape, here corresponding to one has in the 1D system as discussed above but for the 3D system Roling2002 . Second, in reality a disordered system is likely to be described by a distribution of energy parameters rather than by well-defined values. Of course, a natural next step would be to average the present results over appropriately chosen parameter distributions as performed, e.g., in Roling2002 .
Despite these limitations one may expect that important general features of the model may also hold for more complex systems. In particular the observation that the frequency dependence close to the minimum of the nonlinear conductivity in the experimentally relevant regime is to a large extent related to the dynamics in a local DWP may justify the use of the present model for a qualitative understanding of experimental systems.
Acknowledgements
We gratefully acknowledge the support by the DFG (FOR 1394) as well as very helpful discussions with M. Löwe.
References
- (1) J. Vermeer, Physica 22, 1257 (1956).
- (2) L. Zagar, E. Papanilolau, Glastechn. Ber. 42, 37 (1969).
- (3) J. P. Lacharme, J. O. Isard, J. Non-Cryst. Solids 27, 381 (1978).
- (4) J. M. Hyde, M. Tomozawa, Phys. Chem. Glasses 27, 147 (1986).
- (5) J. L. Barton, J. Non-Cryst. Solids 203, 280 (1996).
- (6) J. O. Isard, J. Non-Cryst. Solids 202, 137 (1996).
- (7) B. Roling, S. Murugavel, A. Heuer, L. Lühning, R. Friedrich, S. Röthel, Phys. Chem. Chem. Phys. 10, 4211 (2008).
- (8) R.D. Banhatti, A. Heuer, Phys. Chem. Chem. Phys. 3, 5104 (2001).
- (9) S. Murugavel, B. Roling, J. Non-Cryst. Solids 351, 2819 (2005).
- (10) A. Heuer, S. Murugavel, B. Roling, Phys. Rev. B. 72, 174304 (2005).
- (11) H. Staesche, B. Roling, Phys. Rev. B 82, 134202 (2010).
- (12) H. Staesche, B. Roling, Z. Phys. Chem. 224, 1655 (2010).
- (13) F. Feiten, B. Roling, Solid State Ionics 226, 59 (2012).
- (14) M.D. Ingram, Phys. Chem. Glasses 28, 215 (1987).
- (15) J.C: Dyre, P. Maass, B. Roling, D.L. Sidebottom, Rep. Prog. Phys., 72, 046501 (2009).
- (16) P. Maass, J. Non-Cryst. Solids 255, 35 (1999).
- (17) R.D. Banhatti, K. Funke, Solid State Ionics 177, 1551 (2006).
- (18) A.G. Hunt, J. Phys. Cond. Mat. 3, 7831 (1991).
- (19) S.D: Baranovskii, H. Cordes, J. Chem. Phys. 111, 7546 (1999).
- (20) J.C. Dyre, T.B. Schrøder, Rev. Mod. Phys. 72, 873 (2000).
- (21) T.B. Schrøder, J.C. Dyre,Phys. Rev. Lett. 101, 025901 (2008).
- (22) H. Lammert, A. Heuer, Phys. Rev. Lett. 104, 125901 (2010).
- (23) K.W. Kehr, K. Mussawisade, T. Wichmann, W. Dieterich, Phys. Rev. E 56,R2351 (1997).
- (24) M. Eimax, M. Koerner, P. Maass, A. Nitzan, Phys. Chem. Chem. Phys. 12, 645 (2008).
- (25) S. Röthel, R. Friedrich, L. Lühning, and A. Heuer, Z. Phys. Chemie 224, 1855 (2010).
- (26) B. Roling, J. Chem. Phys. 117, 1320 (2002).
- (27) C. Mattner, BSc Thesis, University of Münster (2012).
- (28) J.P. Bouchaud, A. Comtet, C. Monthus, J. Phys. I France, 5, 1521 (1995).