Performances of a GEM-based Time Projection Chamber prototype for the AMADEUS experiment
Abstract
A large number of high-energy and heavy-ion experiments successfully
used Time Projection Chamber (TPC) as central tracker and particle
identification detector. However, the performance requirements on TPC for new
high-rate particle experiments greatly exceed the abilities of traditional
TPC read out by multi-wire proportional chamber (MWPC). Gas Electron
Multiplier (GEM) detector has great potential to improve TPC performances
when used as amplification device.
In this paper we present the R&D activity on a new GEM-based TPC
detector built as a prototype for the inner part for AMADEUS, a new
experimental proposal at the DANE collider at Laboratori Nazionali di
Frascati (INFN), aiming to perform measurements
of the low-energy negative kaons interactions in nuclei.
In order to evaluate the GEM-TPC performances, a 10x10 cm2 prototype with a
drift gap up to 15 cm has been realized. The
detector was tested at the M1 beam facility of the Paul Scherrer
Institut (PSI) with low momentum pions and protons, without magnetic field.
Drift properties of argon-isobutane gas mixtures are measured and
compared with Magboltz prediction.
Detection efficiency and spatial resolution as a function of a large
number of parameters, such as the gas gain, the drift
field, the front-end electronic threshold and particle momentum, are
illustrated and discussed. Particle identification capability and the
measurement of the energy resolution in isobutane-based gas mixture are
also reported.
keywords:
Micro-Pattern Gas Detectors ; TPC; Tracking detectors; Particle Identification Detectors1 Introduction
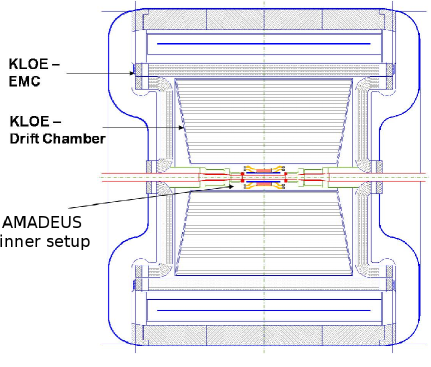
The AMADEUS experiment [1],[2] aims to perform
measurements of low-energy
charged kaons interaction in nuclear matter, in particular to search for the
so-called “kaonic nuclear clusters”. The AMADEUS setup is going to be
installed inside the KLOE detector [3] in the free space inside the
drift chamber (Fig. 1). The experiment will then use the
drift chamber (DC) and the calorimeter of the KLOE detector, together with a
dedicated setup consisting of a target cell to be filled with deuterium or
helium (3 and 4), a trigger system, which will trigger on the back-to-back
K+ K- pairs emitted from the decay of the
particles produced at the DANE e+ e- collider of the
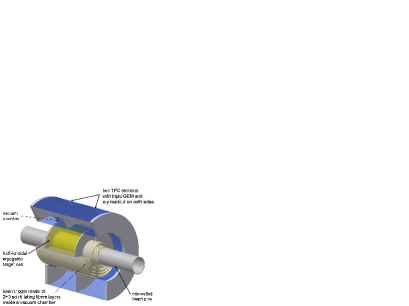
LNF-INFN [4],[5],[6] and an inner tracker,
namely a Time Projection Chamber, TPC, equipped with Gas Electron
Multiplier [7] (Fig. 2).
The GEM-based TPC (TPG) will be 20 cm long with an inner diameter of 8 cm and
an outer one of 40 cm.
The required performances for the TPG AMADEUS are: a spatial
resolution better than 200 m in X-Y and 300 m in Z in order to
achieve together with the KLOE DC a momentum resolution better than 1 in a magnetic
field of 0.5 T; a detector material budget lower than 0.5 of X0; a rate
capability of 1 kHz/cm2 [9]. In addition, the detector must
operate in continuous mode, which means an ion feedback below
10-3 [10], and it must tolerate, without performance losses, an
integrated charge of 0.05 in 1 year of operation at a gas
gain of 6000 and an average particle flux of 1 kHz/cm2 [11].
Since most of the above requirements are easily fulfilled by a TPG,
the R&D activity at the Laboratori Nazionali di Frascati (INFN) is
mainly focused on
the choice of the gas mixture, in order to achieve the highest spatial
resolution with a 0.5 T value of magnetic field, and on the design of the
detector readout.
A prototype of the AMADEUS TPG detector was built and tested both in laboratory
and at Paul Scherrer Institut (PSI).
The technique used in the prototype construction is described in
Sec. 2, while the experimental setup
is briefly reported in
Sec. 3. The choise of the gas mixtures is described in
Sec. 4 together with the estimate of the primary ionization
and the measurement of the gas gain. In Sec. 5
the overall detector performances obtained at the PSI, in terms of
detection efficiency, spatial resolution, PID capability and energy resolution,
are presented and discussed. The paper ends with the conclusions.
2 AMADEUS TPG prototype production
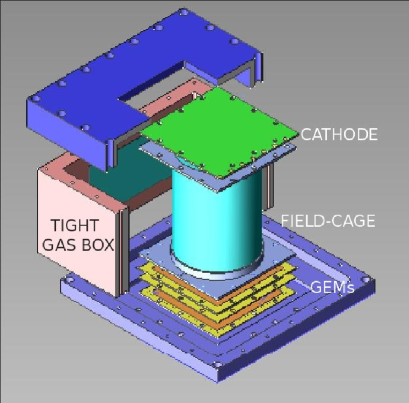
The TPG prototype construction has been performed in a class 1000 clean room. The detector is composed by three GEM foils glued on Fiberglass (FR4) frames, defining the gaps between GEM themselves, then sandwiched between a cathode and anode PCBs. The exploded view of the detector is shown in Fig. 3.
The GEM foils, manufactured by CERN-EST-DEM workshop,
have an active area of 10x10 cm2. Severe criteria have been adopted for GEM
foils acceptance: the defects, detected by means of microscope
inspection, must have an area smaller than 1 mm2;
a maximum leakage current of 1 nA at 600 V,
measured with a residual humidity of about 20%, is required.
To ensure high stability of detector operation without
requiring a grid spacer inside the active area, a stretching
technique of the GEM foil before the frame gluing has been
used [8].
This technique was developed for the R&D of the GEM for the LHCb Muon Chamber.
In Fig. 4 the home-made tool used for the production
is shown.
In Ref. [9] the extensive campaign of measurements is reported,
such as the maximum sag due to electrostatic forces between GEMs,
the kapton creep and radiation effects, which
have been performed in order to avoid electrostatic instability
and to achieve a good uniformity response.
The electric field uniformity in the drift volume is provided by a
cylindrical field cage, which consists of two sets of copper strips
(2.5 mm wide) on both sides of an insulating Kapton foil (15 cm height),
where the outer strips cover the gaps between the inner strips.
The potential on each ring is defined by a precision
resistor chain located outside the gas volume.
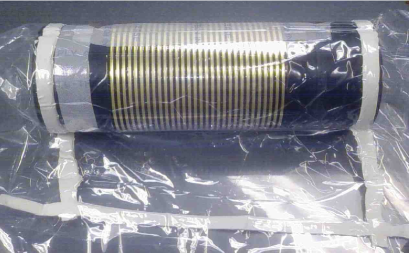
The cylindrical shape has been obtained by exploiting
the vacuum bag technique [12] and rolling the copper-kapton foil
onto machined Polytetrafluorethylene (PTFE) cylinders that act as molds
(Fig. 5).
The edges of the foil are glued together with bi-component epoxy
along the axial millimetric overlap (23 mm wide).
After the curing cycle, the field-cage foil is easily removed from
the cylindrical mold: the results is a perfectly cylindrical field-cage.
To ensure a mechanical support, two fiberglass flanges are glued on the
edges with Araldite 2011.
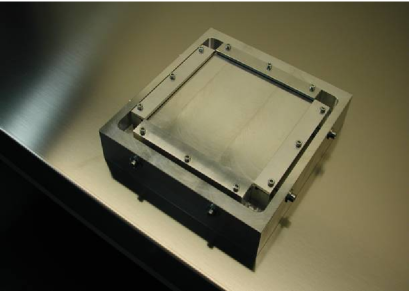
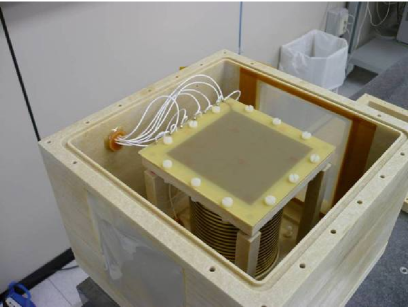
In this R&D phase, the detector has been encapsulated inside a tight gas
box which has been provided by two 14x12 cm2 windows, covered by
10 m Mylar film, in order to reduce as much as possible the radiation
length for a particle crossing the detector (Fig. 6).
The gas tightness of the detector has been measured and it is lower than
2 mbar per day, corresponding to less than 100 ppmV of residual humidity with
a gas flux of 100 cc/min.
3 Experimental test setup and data taking
The performance of the TPG prototype
has been studied at the M1 beam facility of the Paul Scherrer Institut
(PSI) without magnetic field. The M1 beam is a quasi-continuous
high-intensity secondary beam providing pions or protons with very precise
momentum resolution.
The study of the detection efficiency, spatial and energy resolution of the
detector has been performed with a beam rate
of 200 Hz.
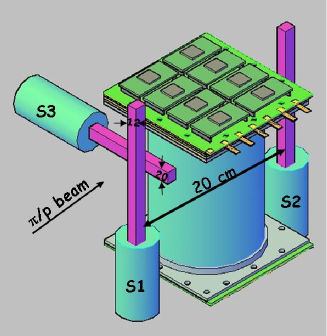
The trigger consisted of the coincidence of three
scintillators S1S3S2, centered on the beam axis.
The distance between the two scintillators S1S3
and the S2 scintillator was about 20 cm as shown in Fig. 7.
The area covered by the intersection of these 3 scintillators is
approximately 12x20 mm2.
The horizontal size (12 mm) of S1 and S2 was chosen in order to completely
cover the width of the detector readout as described in the following section,
while the 20 mm width of the S3 scintillator was used in order to limit
the vertical size of the beam. Such effect will be
illustrated in Sec 5.1.
The coincidence of the discriminated S1, S2, S3 signals
was delayed to give the common stop to a 17-bit multihit CAEN TDC,
with 0.1 ns resolution and 5 ns double edge resolution.
Moreover, another scintillator, about 5 m far from the S1, S2, S3 cross, was
acquired in order to perform a measurement of the particle momentum crossing
the setup by means of time of flight. The measured momentum resolution for
pion and proton beams
in the momentum range between 100 and 440 MeV/c was less then 1%.
In the following, unless otherwise stated, the beam was directed
perpendicular to the drift axis of the TPG prototype.
The discriminator threshold on the front-end electronics
of the TPG signal was set to 3.5 fC and 5 fC.
3.1 The readout electronics
The prototype readout is composed by 4 rows of 32 pads for a total of 128 pads. Each pad of 3x3 mm2 was connected to a front-end board based on CARIOCA-GEM chip [13]. Such chip was developed for the GEM readout in the LHCb Muon Apparatus and it allows to readout half of a pad row. The discriminated and digitized signals were sent to the 17-bit multihit CAEN TDC. For each electronics channel the leading edge (time hit) and the trailing edge, which allow to measure the Time Over Threshold (TOT) with respect to leading edge, were recorded. This TOT technique has been investigated in order to study the possibility to perform a charge measurement needed for particle identification, taking into account the advantage of a faster data acquisition, pattern recognition and a better compression into track segment.
4 Gas Mixture Choice
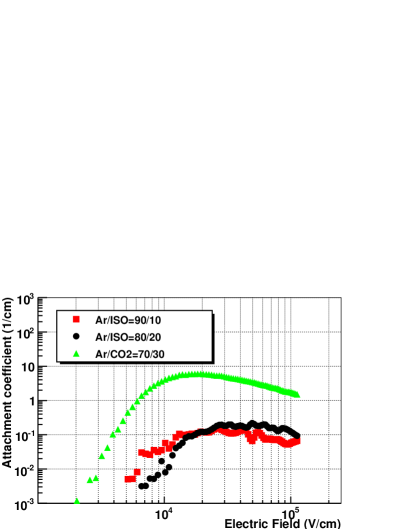
During this R&D phase we decided to use isobutane-based gas mixtures since they are characterized by a large primary ionization (see Sec. 4.1), a high drift velocity (see Sec. 5.1), a high Townsend coefficient, which allow to work at lower HV values (see Sec. 4.2), a moderate longitudinal and transversal diffusions ( 400 m/ for a drift field of 150 V) and last but not least a very low attachment coefficient as shown in Fig. 8.
4.1 Primary Ionization
The primary ionization of the gas mixtures used during the beam test
has been estimated with GARFIELD [15] simulation tool, which
is the common framework used for the simulation of gas detectors.
In Tab. 1 have been reported the number of clusters per cm
and the number of electrons per cluster for different momentum beam and for
the tested gas mixtures. It is worth noticing that the use of isobutane-based
gas mixtures allow to reach a larger primary ionization with respect to
the Ar/CO2=70/30 gas mixture.
| Gas | 170 MeV/c | 440 MeV/c | MIPs | |
|---|---|---|---|---|
| Mixture | Pion | Proton | ||
| clu/cm | 45.22.1 | 96.63.5 | 40.02.0 | |
| Ar/C4H10 | ||||
| 80/20 | e-/clu | 2.130.12 | 2.120.11 | 2.110.11 |
| clu/cm | 37.21.9 | 79.62.8 | 32.81.8 | |
| Ar/C4H10 | ||||
| 90/10 | e-/clu | 2.140.12 | 2.120.11 | 2.120.10 |
| clu/cm | 32.21.8 | 68.82.6 | 28.41.6 | |
| Ar/CO2 | ||||
| 70/30 | e-/clu | 2.190.13 | 2.200.13 | 2.210.14 |
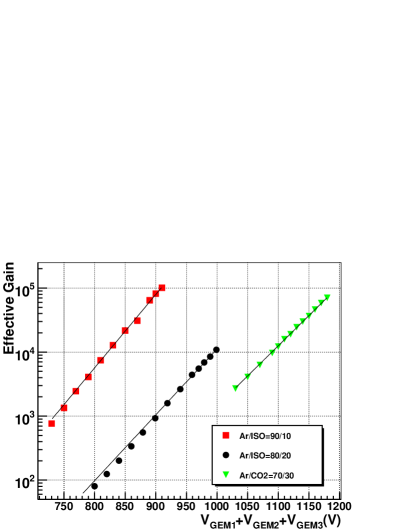
4.2 Gas Gain Measurement
The effective gain of a triple-GEM detector has been measured for different gas mixtures using a high intensity 5.9 keV X-ray tube. Effective gain value were obtained from the ratio of pad current with high voltage on the GEM foils, to current on the first GEM, with no high voltage on the GEM foils as shown in Fig. 9. For each gas mixture the detector has been operated with field configurations optimising the electron transparency [14] and the ion feed-back.
5 Detector Performances
5.1 Drift Velocity
The measurement of the drift velocity of the primary electrons
in the drift gap for a fixed gas mixture is needed for
the time-space relationship.
For this measurement the beam was shot perpendicular to the field cage.
Since it was not possible to measure with great accuracy the distance of
the impact point of the beam on the detector field-cage with respect to
the upper face of the first GEM,
the drift velocity
has been calculated as the ratio between the S3 scintillator height
(201 mm)
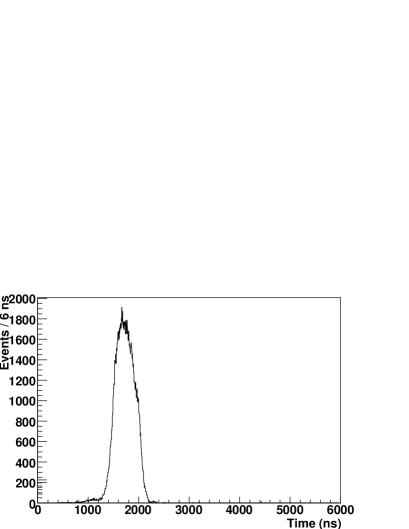
and the full width at half maximum of the drift-time distribution. The relative
error on the drift velocity is less than 2 m/ns.
Fig. 10 shows an example of the drift-time distribution.
It should be noted that the edge
of that distribution is cut by the finite size of the S3 scintillator height.
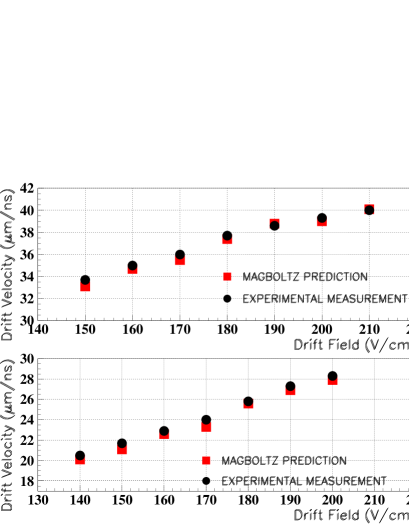
The drift velocity has been measured for different values of drift
field and for
the Ar/C4H10= 90/10 and Ar/C4H10=80/20 gas mixtures,
respectively.
The measurements are shown in Fig. 11, along with the
corresponding Magboltz prediction [16]. For comparison the
drift velocity of the Ar/CO2=70/30 is 3.5 m/ns with a drift
field of 150 V/cm.
In the following data analysis, the measured drift velocity has been
used for the determination of the z-coordinate of
the hits along the axis of the detector.
5.2 Efficiency
The single pad row detection efficiency has been evaluated considering
the fraction of the hits in a single pad row with respect to a selected track.
An example of the single pad efficiency for the full detector and for each
row is shown Fig. 12.
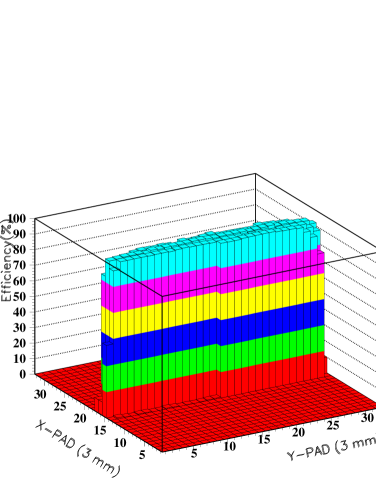
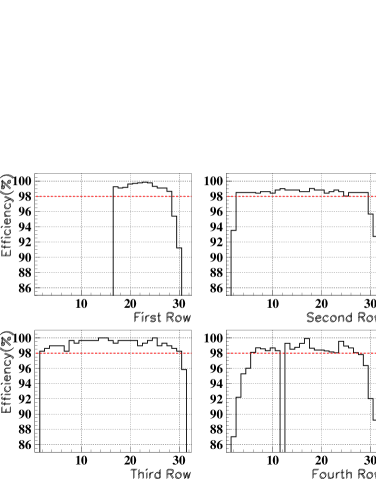
It is worth noticing that most
of the pads have a detection efficiency larger than 98% except for
the first 16 channels of the first row and the 11st channel of
the fourth row that are dead. A low and/or not full detection efficiency
in the first and last pads of each rows and a parabolic behaviour are clearly
visible.
These effects will be discussed more in detail in Sec. 5.6.
Moreover, the first and the fourth rows suffer of a geometrical
misalignment of the detector
with respect to the trigger system which causes a small loss of hits.
In the following, unless otherwise stated, the first and the last two pads
of each row have been not considered in the selection of a track.
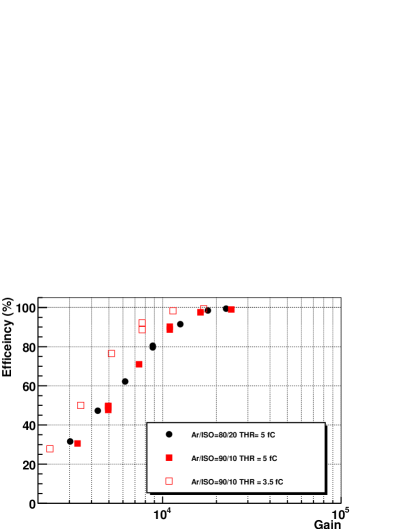
In Fig. 13 the detection efficiency for the
Ar/C4H10= 80/20 and Ar/C4H10= 90/10 gas mixtures
as a function of the gas gain with a drift field of 150 V/cm and 170 MeV/c
pions is shown.
As expected the use of 3.5 fC front-end electronics threshold allows to
reach a full efficiency at lower values of gain
with respect to the measurements performed with 5 fC of threshold.
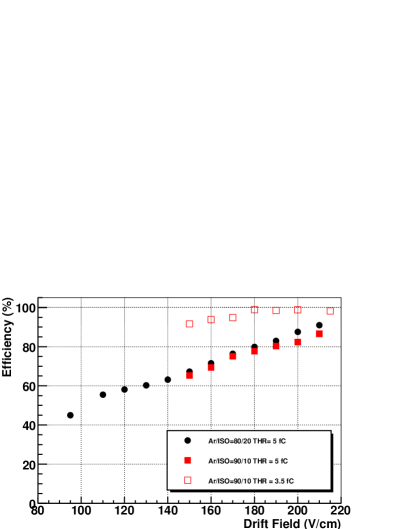
The increasing of drift field from 150 V/cm to 210 V/cm with a fixed
gain of 8103 allows to increase the
detection efficiency from 70% to 90% for both gas mixtures at
5 fC threshold and from 90% to a full efficiency for
Ar/C4H10= 90/10
gas mixture at 3.5 fC threshold as shown in Fig. 14.
This effect is due a greater
collection efficiency of primary electrons in the first GEM when the drift
field is increased.
Moreover, the different level of detection efficiency
between the two curves at 5 fC threshold is due to the higher number
of primary electrons produced in the drift gap in the Ar/C4H10= 80/20
gas mixture with respect to the Ar/C4H10= 90/10 one
(see Tab. 1).
In Fig. 15 is shown the detection efficiency for 440 MeV/c proton and 170 MeV/c pion beams crossing the detector. As expected, due to the higher ionization, protons allow to reach an efficiency plateau at lower values of gas gain with respect to pions. The high value of primary ionization obtained with protons does not seem to affect the detection efficiency for the two threshold values, while for pions such effect does not occur, as explained before.

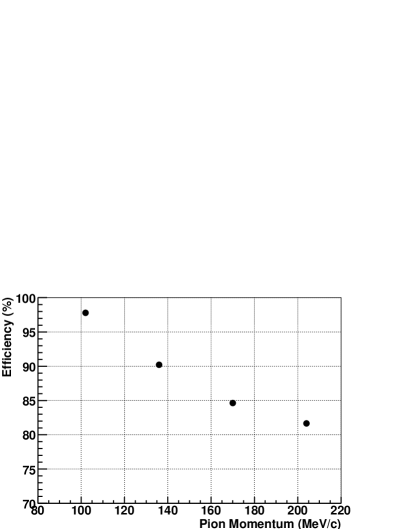
The primary ionization effect has been also evaluated measuring the detector efficiency as a function of the pion beam momentum in the range between 100 and 200 MeV/c (Fig. 16). As expected a higher efficiency value is obtained with a pion momentum of 100 MeV/c.
5.3 Spatial Resolution
The spatial resolution in the drift direction was evaluated by the residuals between the hit position in a single pad row and a selected track. The best spatial resolution obtained during the beam test is shown in Fig. 17.
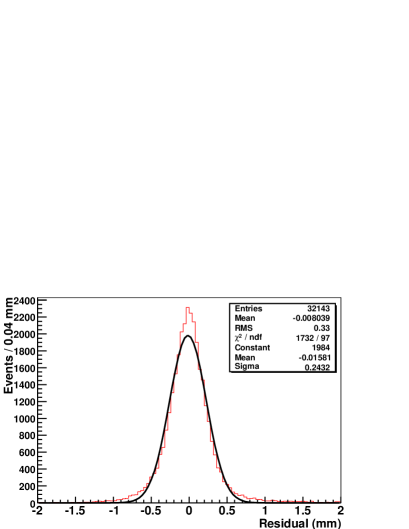
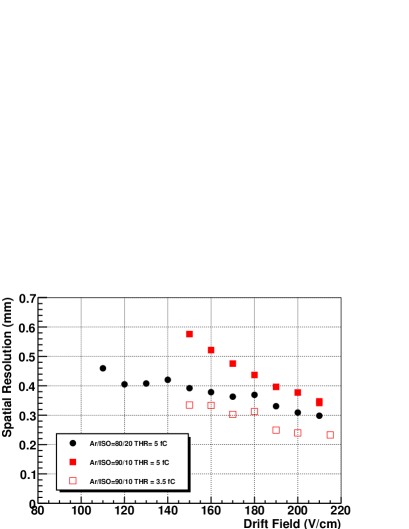
Fig. 18 shows the spatial resolution in the drift direction
for 170 MeV/c pions as a function of the drift field.
Since both the diffusion coefficient decreases and
the collection efficiency of primary electrons in the first GEM increases
by increasing the drift field, a better spatial resolution is achieved
for high drift field and low value of threshold.
Moreover, it should be noted that for 5 fC threshold value a better spatial
resolution is reached with Ar/C4H10= 80/20 with respect to the
Ar/C4H10= 90/10 gas mixture due to a lower diffusion coefficient.
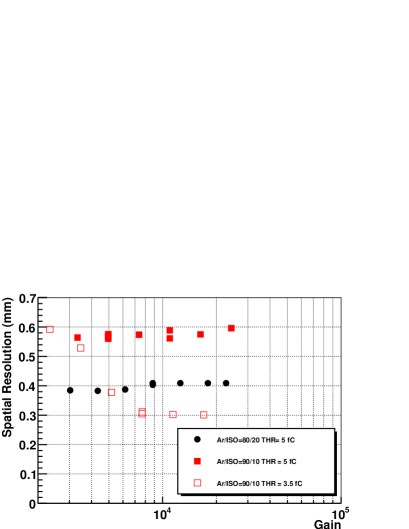
The spatial resolution for 170 MeV/c pions as a function of the gas
gain at fixed
drift field is shown in Fig. 19.
For the 3.5 fC threshold value, the spatial resolution
decreases by increasing the detector gain due to a higher collection
efficiency in the
first GEM until it reaches a plateau region. On the contrary, for a high
value of
threshold and for both gas mixtures the spatial resolution seems to be not
affected by the detector gain.
A possible explanation is that the collection efficiency in the first GEM
increases as the detector gain increases until the signal is above the
discrimination
threshold. When this happens a better spatial resolution is achieved
reaching a plateau
when the signal is comparable with the electronic threshold.
Such explanation is confirmed by the fact that at very low gains
(3103),
the Ar/C4H10= 90/10 gas mixture reaches the same value of
spatial resolution
regardless of the used threshold.
The effect of the ionizing particle on the spatial resolution has been
evaluated comparing 440 MeV/c proton with 170 MeV/c pion as shown in
Fig. 20. As explained above,
the spatial resolution seems not so sensible to a gain change with
5 fC threshold
value and regardless of ionization particle. Moreover, the larger
ionization
produced by protons with respect to pions allows to reach a better
spatial resolution
of about a factor 2.
At 3.5 fC of threshold, the spatial resolution for pions reaches
at high gain the same
level obtained with protons. This indicates that, together with the
fact that there
are no differences in the measurement of spatial resolutions with
protons at different
threshold values , the spatial resolution has reached a limit value for the
Ar/C4H10= 90/10 gas mixture.
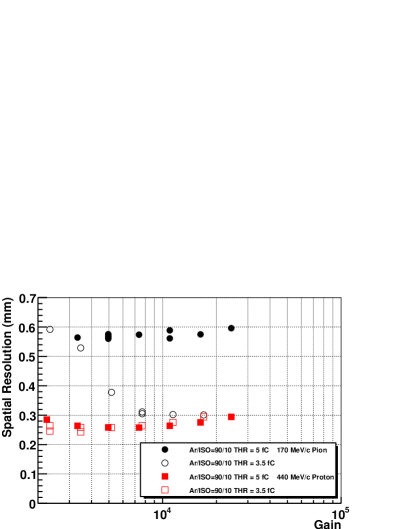
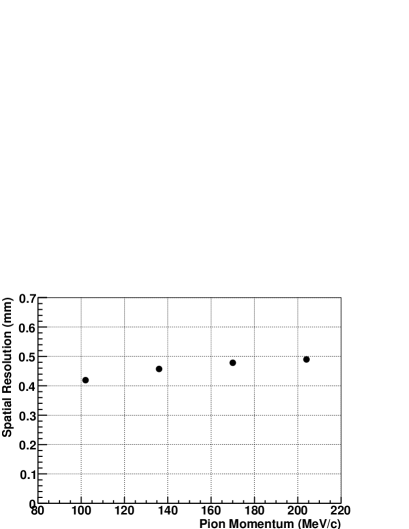
Fig. 21 shows the spatial resolution as a function of pion beam momentum in the range between 100 MeV/c and 200 MeV/c. As expected, the spatial resolution results to be effected by low value of pion momentum.
5.4 Time Over Threshold measurement
Timing functionality in the CARIOCA-GEM chip allows also the
measurement of charge, and therefore of ionization, for
individual channels. The measurement of signal pulse
width above a preset discriminator threshold may be used
to a good approximation as a determination of the charge
on each channel. From the collection of all channel measurements
the track ionization can be well determined.
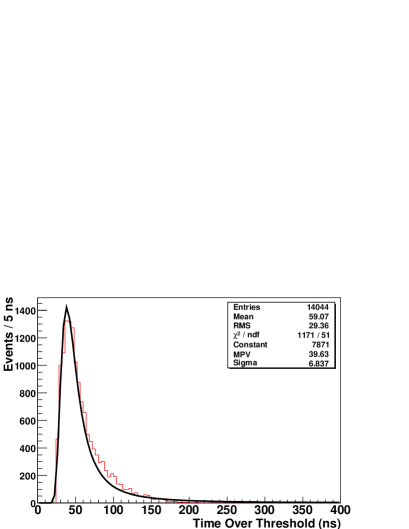
As a confirmation of the ability of the CARIOCA-GEM chip to
measure simultaneously timing and ionization, the charge density
along tracks has been determined using the Time Over Threshold (TOT)
measurement as shown in Fig. 22.
It should be noted that the distribution of Fig. 22 follows
a Landau distribution as expected. Moreover, the analysis has shown that this
distribution is essentially independent of the track orientation.
5.5 Particle Identification using dE/dx
Energy loss, dE/dx, were measured for pions and protons to
evaluated the PID capability of our TPG prototype.
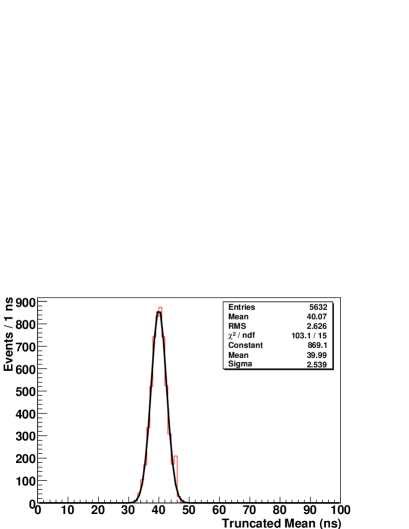
The dE/dx resolution was measured using the truncated technique.
We observe that by accepting the 40% lowest dE/dx values of the hits
in the track we obtain the best resolution and we correctly reproduce the most
probable value of the single pad charge distribution. For higher values of the
accepted fraction, the resolution gets worse due to inclusion of hits
from the Landau distribution tail, while for smaller values the effect is
related to the loss in statistics.
Fig. 23 shows the Gaussian behaviour of the
resulting distribution when a cut of 60% is applied.
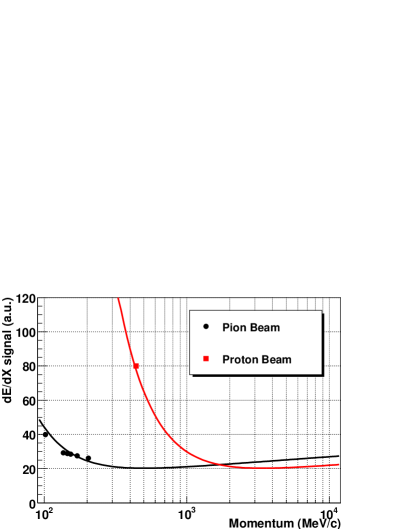
By simultaneously measuring the momentum for proton and pion beams, by means of the time of flight (see Sec. 3), and the deposited energy, by means of the mean value of the truncated distribution, an estimation of the TPG prototype ability to identify the particle crossing the detector can be performed as shown in Fig. 24.
For a fixed particle momentum, the dE/dx resolution function is usually parametrized [17] as:
| (1) |
where N the number of samples and x their length which in our case is
the pad dimension (Fig. 25).
In the used Ar/C4H10= 80/20 gas mixture at atmospheric pressure, we
measured a=-0.400.02 and b=-0.260.05.
Assuming an average track length corresponding to 100 hits
in the TPG-AMADEUS, with 100 MeV/c pion and 40% of accepted fraction,
we expect to measure a dE/dx resolution of about 9%. This energy resolution
is comparable with that obtained with STAR TPC with a track length of more than
67 cm [18].
Moreover we expect to achieve, with such energy resolution and with
a 100 MeV/c particle momentum, a K/ and /p separation power
of 75 and 260, respectively.

5.6 Edge Effect due to the Field Cage
Low and/or not full detection efficiency has been measured on
the edge of each pad rows as clearly visible in
Fig. 12.
Such effects are due to different reasons:
-
•
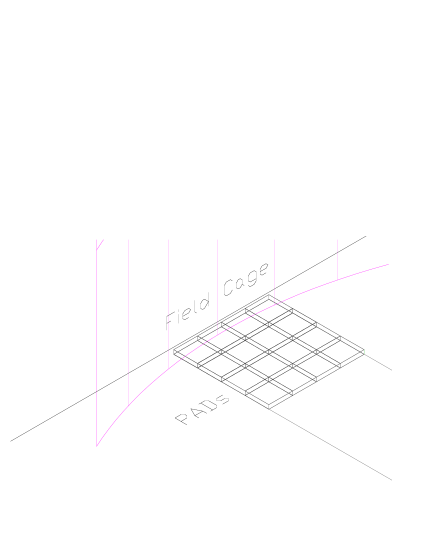
the length of each pad row is 102 mm while the effective diameter of the cylindrical field-cage is 100 mm. This means that the first and the last pad of each rows collect about 2/3 of the charge with respect to the other pads of the row (Fig. 26);
-
•
electric distortion of the field in the drift gap mainly near the field-cage are not completely cured;
-
•
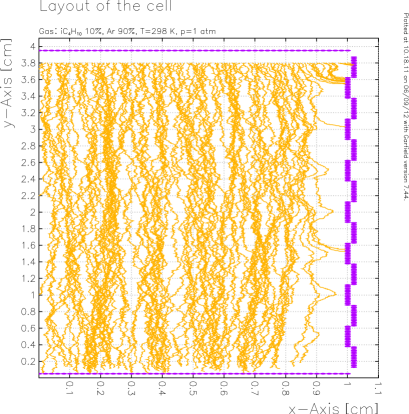
the primary electrons produced in the drift gas and drifting toward the first GEM can be collected by the internal strips of the field-cage (Fig. 27).
In any case all these effects are fully reduced drifting away from the field-cage by 5 mm.
6 Conclusion
The R&D activity on TPG detector for the inner part of
the AMADEUS experiment has started at Laboratori Nazionali di Frascati (INFN).
A TPG prototype, with a drift gap up to 15 cm, has been successfully
produced and tested at the M1 beam facility of the Paul
Scherrer Institut with low momentum pion and proton beams.
The drift properties
of various argon-isobutane gas mixtures have been measured and they result
compatible with those simulated with Magboltz.
The measurement of the detector performances, in terms of detection
efficiency and spatial resolution, as a function of the gas gain, drift field,
front-end electronics threshold and particle momentum has been reported and
discussed in detail.
A detection efficiency of 99% and a resolution along the drift direction of
240 m have been achieved.
The dE/dx resolution has been measured for isobutane-based gas mixture
applying a truncated mean of 60%.
A good energy resolution, of about 25% on a single measurement,
will allow to reach an overall resolution of about 8% for an average
track length in AMADEUS-TPC.
Finally, the effect of the field-cage on the detector performances has been
also measured showing that it is necessary to move about 5 mm away from the
field-cage.
Acknowledgements.
The authors would like to thank the coordinator of the PSI beam lines, Dr. Konrad Deiters, for the excellent cooperation and support; M. Pistilli for his suggestions during the prototype design phase and for his highly qualified technical assistance during its assembly.Part of this work was supported by the European Community-Research Infrastructure Integrating Activity “Study of Strongly Interacting Matter” HadronPhysics 2 (HP2), Grant Agreement No. 227431, and HadronPhysics 3 (HP3), Contract No. 283286, under the Seventh Framework Programme of EU.
References
- [1] AMADEUS Collaboration, \hrefhttp://www.lnf.infn.it/lnfadmin/direzione/roadmap/LOI_MARCH_AMADEUS.pdfAMADEUS Letter of Intent.
- [2] AMADEUS Collaboration, \hrefhttp://www.lnf.infn.it/sis/preprint/pdf/getfile.php?filename=LNF-07-24(IR).pdfAMADEUS Phase-1: Setup and Roll-in Proposal, LNF-07/24(IR) 2007.
- [3] D. Adinolfi et al., Nucl. Instr. and Meth. A 461 (2001) 25.
- [4] D. Alesini et al., \hrefhttp://www.lnf.infn.it/sis/preprint/pdf/getfile.php?filename=LNF-06-33(IR).pdfDAFNE upgrade for SIDDHARTA RUN, LNF-06/33(IR) 2006.
- [5] C. Milardi,\hrefhttp://arxiv.org/abs/0803.1450v1DANE Interaction Regions Upgrade.
- [6] M. Bazzi et al., Nucl. Instr. and Meth. A 671 (2012) 125.
- [7] F. Sauli, Nucl. Instr. and Meth. A 386 (1997) 531.
- [8] M. Alfonsi et al., Nucl. Instr. and Meth. A 518 (2004) 106.
- [9] M. Poli Lener, Triple-GEM detectors for the innermost region of the muon apparatus at the LHCb experiment, Ph.D Thesis, \hrefhttp://cdsweb.cern.ch/record/940631/files/thesis-2006-013.pdfCERN-THESIS-2006-13.
- [10] F. Sauli et al., Nucl. Instr. and Meth. A 560 (2006) 269, \hrefhttp://cdsweb.cern.ch/record/921935/files/phep-2005-056.pdfCERN-PH-EP/2005-056.
- [11] P. de Simone et al., IEEE Trans. Nucl. Sci. 52 (2005) 2872.
- [12] G. Bencivenni et al., Nucl. Instr. and Meth. A 572 (2007) 168.
- [13] M. Poli Lener et al., IEEE NSS MIC Vol. 6 (2007) 4671.
- [14] G. Bencivenni et al., Nucl. Instr. and Meth. A 488 (2002) 493.
- [15] R. Veenhof, Nucl. Instr. and Meth. A 419 (1998) 726.
- [16] S.F. Biagi, Nucl. Instr. and Meth. A 412 (1999) 234.
- [17] W. Allison, J.H. Cobb., Ann. Rev. Nucl. Part. Sci 30 (1980) 253.
- [18] M. Anderson et al., Nucl. Instr. and Meth. A 499 (2003) 569.