The Properties of the Large Magellanic Cloud Based on OGLE III Photometry of RR Lyrae Stars
Abstract
We present results from a study of ab-type RR Lyrae variables in the Large Magellanic Cloud using the extensive dataset from phase III of the Optical Gravitational Lensing Experiment (OGLE). The metallicities of the RR Lyraes, determined from the periods and amplitudes of their light curves, reveal a statistically significant radial abundance gradient that is approximately one-half of what is seen in the disks of the Milky Way and M33. The RR Lyrae abundance gradient agrees with that of the old and metal-poor LMC globular clusters. The reddenings of the OGLE RR Lyraes have been calculated using their minimum light colors and reveal a mean value of E(V–I) = 0.12 0.05, where the quoted uncertainty represents the standard deviation of the mean. The distribution of RR Lyrae extinctions across the face of the LMC is well-correlated with the distribution and emission intensity of CO clouds based on recent millimeter wave surveys. In addition, we find that the old LMC globulars tend to be located in regions of low extinction. This underscores the need to survey the higher extinction regions with the specific aim of increasing the sample of old LMC globular clusters. Finally, we examine the distance distribution of the RR Lyraes in order to probe the structure of the LMC and investigate the possibility that some of the RR Lyraes may reside in a kinematically hot halo population. In addition to calculating a mean LMC distance of = 18.55 0.10 mag, we conclude that some fraction of the RR Lyraes in our sample could be members of the LMC halo.
keywords:
stellar populations – RR Lyrae – LMC – dwarf galaxies.1 Introduction
The ancient stellar population of the Large Magellanic Cloud (LMC) is one of the keys to unlocking the formation and early evolution of this very important dwarf irregular galaxy. For decades, the metal-poor globular clusters in the LMC have been used to study its early history because they represent distinct points in space and time (van den Bergh 2004; Colucci et al. 2011). Knowledge of the ages, chemical abundances, and kinematical properties of these clusters has led to a great many advances in our understanding of the LMC’s early evolution. However, based on the latest census, the LMC only contains 12 globular clusters (NGC 1466, 1754, 1786, 1898, 2210, 2257, 2005, 2019, 1835, 1841, Hodge 11, and Reticulum, excluding ESO121-SC09, Olsen et al. 1998; Johnson et al. 1999) with ages comparable to those of the oldest Milky Way globulars. This relatively small number of objects limits their utility and applicability for the study of galaxy-wide properties.
There is another tool at our disposal for studying the formation and early evolution of the LMC - RR Lyrae variables (Smith 1995; Sarajedini 2011). These pulsating stars that are located on the horizontal branch are ubiquitous in the LMC with tens of thousands having been identified and characterized by recent surveys (Alcock et al. 2000; Soszynski et al. 2009, see below). They are well known as distance indicators, and, in addition, their mere presence necessitates the existence of a stellar population with an age greater than 10 Gyr. Their periods and amplitudes are useful for measuring the metal abundance of the star cluster or galaxy in which they reside. Furthermore, their minimum light colors can be used to measure the line-of-sight reddening.
There are three principal types of RR Lyrae variables; those pulsating in the fundamental mode exhibit sawtooth-like light curves and are referred to as ab-type or RR0 variables. The first overtone pulsators generally show sine-curve shaped light curves, have shorter periods and typically lower amplitudes than the ab-types, and are referred to as c-type or RR1 variables. Lastly, RR Lyraes that pulsate in both the fundamental and first overtone modes (i.e. double mode pulsators) carry the d-type moniker (RRd).
The most recent survey of RR Lyraes in the LMC is represented by the Optical Gravitational Lensing Experiment (OGLE, Udalski et al. 1992). We describe the detailed properties of this survey in the next section. For now, we note that at least four studies have been published utilizing the vast number of LMC RR Lyraes from OGLE. Pejcha & Stanek (2009) used 9393 ab-type RR Lyraes in the OGLE-III catalog to investigate the structure of the LMC stellar halo. After adopting a median distance of 50 kpc for their sample of RR Lyraes, Pejcha & Stanek (2009) construct a reddening map of the LMC and use it to study the line of sight distribution of the RR Lyraes. They find that the RR Lyraes define a triaxial ellipsoid with axes ratios of 1:2.00:3.50 providing further evidence that the LMC does indeed possess a halo distribution of RR Lyrae variables (Kinman et al. 1991; Minniti et al. 2003; Borissova et al. 2006).
The series of papers by Haschke et al. (2011), Haschke et al. (2012a), and Haschke et al. (2012b) used the OGLE-III RR Lyrae data to explore the reddening, metallicity, and structure of the LMC, respectively. The first study noted above presented reddening maps of the LMC using the red clump stars and the RR Lyrae variables and compared these maps with several previous studies. The second paper, Haschke et al. (2012a), used the Fourier properties of the RR Lyrae light curves to study their metallicity distribution in the LMC and compared the results with spectroscopy-based abundance values from previous studies. The third paper, Haschke et al. (2012b), used the line-of-sight distance distribution of the RR Lyraes and Cepheids to investigate the structural properties of the LMC. We will refer to these studies later as we compare our results with theirs.
In the present work, we seek to study the reddening, metallicity, and spatial distribution of the OGLE-III RR Lyraes using complementary techniques to those employed in the previous studies of Pejcha & Stanek (2009) and Haschke et al. (2011, 2012a, 2012b). We will compare our results with those of previous investigations in order to test the veracity of the techniques and the results they yield. We also include the relevant properties of the old LMC globular clusters in our analysis to gain some insight into their relationship with the RR Lyraes. This paper is organized as follows. The next section provides a brief description of the OGLE-III RR Lyrae database. Section 3 presents our results on the metallicity, extinction, and spatial distribution of the ab-type RR Lyraes and compares them with previous studies. Lastly, Section 4 presents the conclusions of this study.
2 Data
The OGLE experiment began its initial observations in 1992 with OGLE I. Since then, two additional datasets have been released (Udalski et al. 1992). The most recent one, from OGLE III, was taken from July 2001 to March 2008 on the 1.3 meter Warsaw telescope at Las Campanas Observatory (Soszynski et al. 2009). The imaging camera is composed of eight CCDs each with 2048 by 4096 pixels providing a field of view of 35 by 35 arcmin on the sky (Udalski et al. 2003). Images were taken in the V and I filter passbands. The full photometric catalog including the variable objects is available online.
The reduction procedures, photometric calibrations, and astrometric transformations are detailed in Udalski et al. (2008). The raw light curves of suspected variables were subjected to a period search algorithm based on Fourier analysis. From this, 24,906 RR Lyrae variables were identified and characterized. For each object, the catalog provides right ascension, declination, mean magnitudes in I and V, period, I-band amplitude, along with the Fourier parameters , , , and (Soszynski et al. 2009).
In the present work, we are mainly interested in the 17,693 ab-type RR Lyraes. We have excluded those stars that were flagged as foreground objects and those with uncertain or missing V-band photometry leaving 17,221 ab-type RR Lyraes, which constitute the dataset we will analyze herein.
3 Results
3.1 Metallicities
Metallicities for our sample are determined using the relationship from Alcock et al. (2000) shown in equation 1, wherein Pab represents the period of the ab-type variables and Vamp is the light curve amplitude in the V-band:
| (1) |
To use equation 1, which is on the Zinn and West (1984) abundance scale, we need to convert the I-band amplitudes from the OGLE III catalog to those in the V-band; for this, we make use of equation 1 in Dorfi & Feuchtinger (1999). They find
| (2) |
where Vamp and Iamp are the light curve amplitudes in the V- and I-band, respectively. This empirical relation exhibits a R2 correlation coefficient of 0.904 according to Dorfi & Feuchtinger (1999), where R2 = 1 is a perfect correlation.
We note that Alcock et al. (2000) quote an error of 0.31 dex per star in their metallicity-period-amplitude relation (equation 1). There is evidence that the actual error may be slightly less than this value and closer to 0.25 dex (Jeffery et al. 2011). There are at least two additional sources of error inherent in equation (1). First, some RR Lyrae stars exhibit the Blazhko effect which results in a modulation of their amplitude by as much as 0.2 mag (e.g. Kunder et al. 2010). This leads directly to an uncertainty of 0.03 dex in their metal abundance. Second, there is the conversion of the I-band amplitude to the V-band value. To estimate the error inherent in this, we have examined the original data that were used to construct equation (2) from Dorfi & Feuchtinger (1999). We have calculated the root-mean-square (rms) deviation of the fitted points from the fit (i.e. equation 2) and find a value of rms = 0.09 mag in the V band amplitude. Propagating this through the Alcock et al. equation yields a contribution of 0.014 dex to the total metal abundance error. Both of these sources of uncertainty are negligible and do not add significantly to the uncertainty of 0.31 dex originally quoted by Alcock et al. (2000).
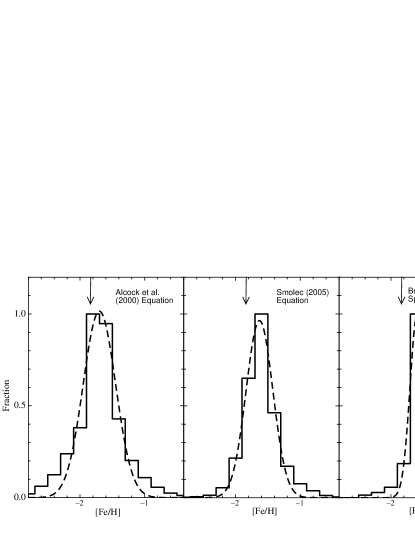
The histogram of the resultant metallicities from the Alcock et al. (2000) relation is shown in the left panel of Fig. 1 as the solid line. The middle panel of Figure 1 shows the metallicity histogram derived using the methodology of Haschke et al. (2012a). Their study utilized the relationship derived by Smolec (2005) applied to the Fourier coefficients of OGLE RR Lyraes. The Smolec (2005) relation is
| (3) |
but it should be noted that a phase change must be accounted for in this equation, as the OGLE data uses a cosine Fourier series for their light curve fit while Smolec (2005) used a sine Fourier series. Equation 3 is on the Jurcsik (1995) metallicity scale. This was transformed to the Zinn & West 1984 scale (ZW).
| (4) |
which is taken from the paper by Papadakis et al (2000). The histogram of metallicties resulting from equation 4 is plotted in the middle panel of Figure 1 as the solid line.
The right panel of Fig. 1 illustrates the histogram of LMC RR Lyrae metallicities from Table 9 in the spectroscopic study of Borissova et al. (2006). These data were transformed from the Harris (1996) scale to the Zinn & West scale (ZW) by adding –0.06 dex (Gratton et al. 2004; Borissova et al. 2006).
| Cluster | Suntzeff | Grocholski | Mucciarelli | Colucci |
|---|---|---|---|---|
| Name | et al. (1992) | et al. (2007) | et al. (2010) | et al. (2011) |
| NGC 1466 | –1.85 | … | … | … |
| NGC 1754 | –1.54 | … | … | … |
| NGC 1786 | –1.87 | … | –1.75 | … |
| NGC 1898 | –1.37 | … | … | … |
| NGC 2210 | –1.97 | … | –1.65 | … |
| NGC 2257 | –1.80 | –1.59 | –1.95 | … |
| NGC 2005 | –1.92 | … | … | –1.50 |
| NGC 2019 | –1.81 | –1.31 | … | –1.61 |
| NGC 1835 | –1.79 | … | … | … |
| NGC 1841 | –2.11 | … | … | … |
| Hodge 11 | –2.06 | –1.84 | … | … |
| Reticulum | –1.71 | –1.57 | … |
| Cluster | Suntzeff | Grocholski | Mucciarelli | Colucci | Average |
|---|---|---|---|---|---|
| Name | et al. (1992) | et al. (2007) | et al. (2010) | et al. (2011) | [Fe/H] |
| NGC 1466 | –1.85 | … | … | … | –1.85 |
| NGC 1754 | –1.54 | … | … | … | –1.54 |
| NGC 1786 | –1.87 | … | –1.86 | … | –1.86 0.01 |
| NGC 1898 | –1.37 | … | … | … | –1.37 |
| NGC 2210 | –1.97 | … | –1.78 | … | –1.87 0.12 |
| NGC 2257 | –1.80 | –1.86 | –2.00 | … | –1.89 0.07 |
| NGC 2005 | –1.92 | … | … | –1.81 | –1.87 0.07 |
| NGC 2019 | –1.81 | –1.60 | … | –1.92 | –1.78 0.11 |
| NGC 1835 | –1.79 | … | … | … | –1.79 |
| NGC 1841 | –2.11 | … | … | … | –2.11 |
| Hodge 11 | –2.06 | –2.07 | … | … | –2.06 0.01 |
| Reticulum | –1.71 | –1.85 | … | … | –1.79 0.09 |
Fitting a Gaussian function to each metallicity distribution in Figure 1, we find the following peak values: –1.70 0.25, –1.63 0.21, –1.62 0.10, for the present sample, the Haschke et al. (2012a) sample, and that of Borrisova et al. (2006), respectively. The quoted uncertainties represent the 1- standard deviations in each case. Given the errors, these values are in statistical agreement, but it should be noted that the Fourier method of Haschke et al. (2012a) yields metallicities with a slightly smaller dispersion as compared with the Alcock et al. (2000) method that uses periods and amplitudes, which we have adopted.
In order to compare the metallicities of the RR Lyrae variables with those of the old globular clusters in the LMC, we have assembled abundance values from the literature for these 12 clusters as shown in Table 1. In order to combine abundance values for the same clusters from different studies, we need to ensure that they are on the same abundance scale. As such, we have converted all of the metallicities to the Zinn & West (1984) scale and furthermore offset them to a common zero point. Since Suntzeff et al. (1992) presents metallicities for all of the clusters, we have offset the values from the other sources onto the system of Suntzeff et al. (1992) and averaged the abundances for clusters in common between the various studies. These adjusted values and the averages are shown in Table 2. The errors in each average value have been calculated using the small sample statistical formulae of Keeping (1962).
The vertical arrow in Fig. 1 shows the mean metal abundance of the 12 old globular clusters in the LMC taken from Table 2. This value equals [Fe/H] = –1.82 0.06 (standard error of the mean, sem). We see that this mean value is 0.3 dex more metal-poor than the field RR Lyrae variables. However, given the uncertainties in both values, it is unclear whether this difference of 0.3 dex is statistically significant. If it is significant, then it could reflect a slight age difference between the old globular clusters and the field RR Lyrae variables, in the sense that the former would be older than the latter.
3.2 Metallicity Gradient in the LMC
It is instructive to examine the radial metallicity variation among the stellar populations of the LMC. For each RR Lyrae variable in our sample, we calculate its angular distance from the center using equation (5),
| (5) | |||
which is taken from van der Marel & Cioni (2001). In this equation, and are the right ascension and declination of the LMC center from van der Marel & Cioni (2001), while and are the right ascension and declination of each OGLE RR Lyrae star. A mean absolute LMC distance modulus of 18.55 (see Sec. 3.4) was used to calculate the radial location of each RR Lyrae from the center of the LMC. The metallicity data were then binned using 0.5 kpc bins and plotted in Fig. 2. The binned averages are plotted as squares along with a best fit line in Figure 2. This linear regression fit to the RR Lyrae data has a slope of –0.027 0.002 dex/kpc, which is steeper than the slope of –0.015 0.003 dex/kpc found in Feast et al. (2010), who used the periods of the OGLE RR Lyraes along with equation (1) of Sarajedini et al. (2006) in order to calculate metallicities. The open circles in Fig. 2 are the old globular clusters in the LMC as shown in the last column of Table 2. A least squares fit to these globular cluster points yields a slope of –0.022 0.013 dex/kpc. When the student’s T-test is applied to this latter value, we find a 93% probability of significance suggesting that, given the data in Table 2, the radial metallicity slope of the LMC globular clusters is not likely to be statistically significant. We note that the open triangles in Fig. 2 represent the data from Haschke et al. (2012a) binned in an identical manner to our data. The least squares fit to these stars yields a slope of –0.019 0.002 dex/kpc, which lies between the values from the present study and that of Feast et al. (2010). It’s not immediately clear why the techniques applied by Feast et al. (2010), Haschke et al. (2012a), and the present work yield different radial metallicity gradients. Further insights on which of these results is closest to reality will require further spectroscopic metallicity measurements of individual RR Lyraes in the LMC.
Also plotted in Fig. 2 are the metallicity gradients in the disk of the Milky Way and M33 from Friel et al. (2002) and Tiede et al. (2004), respectively. The former is based on the mean relation for all of the open clusters in the study of Friel et al. (2002) while the latter is the mean metallicity of RGB stars in an outer disk field of M33. These are meant to illustrate a comparison between the disk metallicity gradients of these three galaxies. In particular, it would appear that the LMC relation is significantly shallower than those of the Milky Way and M33, which are both very similar.
One reason for the different metallicity gradients in the disks of these galaxies could be related to the ages of the stellar populations used to measure these gradients. Friel et al. (2002) found that older open clusters in the Milky Way’s disk exhibit a significantly steeper radial metallicity gradient as compared with younger clusters. This trend seems to be reversed in the present case where the oldest stars in the LMC have a shallower metallicity gradient as compared with generally younger populations in the Milky Way (open clusters) and M33 (RGB stars).
Another factor that could influence the slope of the radial metallicity gradient in a galaxy is the presence or absence of a stellar bar. As Zaritsky et al. (1994, see also Grocholski et al. 2007, Sharma et al. 2010) point out, barred spiral galaxies are more likely to possess shallower metallicity gradients as compared with non-barred spirals. As such, this would explain the appearance of Fig. 2, which suggests that the strong bar structure of the LMC has acted to diminish the extent of its disk metallicity gradient as compared with M33, which has no measurable stellar bar, and the Milky Way, which possesses a relatively small stellar bar.

| Cluster | E(B–V) | E(V–I) | Reference |
|---|---|---|---|
| NGC 1466 | 0.09 | 0.12 | Johnson et al. (1999) |
| NGC 1754 | 0.09 | 0.12 | Olsen et al. (1998) |
| NGC 1786 | 0.07 | 0.09 | Brocato et al. (1996) |
| NGC 1898 | 0.07 | 0.09 | Olsen et al. (1998) |
| NGC 2210 | 0.06 | 0.08 | Brocato et al. (1996) |
| NGC 2257 | 0.04 | 0.05 | Johnson et al. (1999) |
| NGC 2005 | 0.10 | 0.13 | Olsen et al. (1998) |
| NGC 2019 | 0.06 | 0.08 | Olsen et al. (1998) |
| NGC 1835 | 0.08 | 0.10 | Olsen et al. (1998) |
| NGC 1841 | 0.18 | 0.23 | Brocato et al. (1996) |
| Hodge 11 | 0.08 | 0.10 | Johnson et al. (1999) |
| Reticulum | 0.05 | 0.07 | Mackey & Gilmore (2004) |
3.3 Extinction Mapping
In order to determine the reddening for each RR Lyrae in our sample, we make use of the results of Guldenschuh et al. (2005) who found that the minimum light color of ab-type RR Lyrae variables is equal to = 0.58 0.02 regardless of their intrinsic properties. As a result, we can calculate the reddening of an individual RR Lyrae via equation 6 as
| (6) |
To estimate the minimum light colors of the ab-type RR Lyraes in the OGLE III database, we proceed as follows. If the light curves were symmetric sine-like curves, we could calculate the minimum light color via the following equation:
| (7) |
However, because the shapes of ab-type RR Lyrae light curves are asymmetric, we need to determine the correction to be applied to the minimum light colors derived using equation (7). In order to calculate this correction, we have used the ab-type RR Lyrae light curve templates of Layden & Sarajedini (2000) to calculate the quantity
| (8) |
The mean value of for the 6 ab-type templates is = -0.061 0.017. As a result, we can correct the minimum light colors derived from equation (7) by adding –0.061 mag to each of our values.
This corrected apparent minimum light color is then coupled with the results of Guldenschuh et al. (2005) shown in equation (6) above to calculate the line-of-sight reddening. Figure 3 illustrates the resultant reddening distribution for the LMC RR Lyraes in our sample. The number of RR Lyraes exhibiting a negative reddening in Fig. 3 represents only 5% of the total, which is a testament to the robustness of our method (Sarajedini et al. 2006). The error in each reddening is composed of =0.02 mag from the uncertainty in the value of and =0.017 mag from the correction applied to the minimum light colors. Taken together, these combine to produce an uncertainty of =0.026 mag in E(V–I).
In order to test our method for reddening estimation, we have extracted the V and I band time-series photometric data for 200 RR Lyraes from the OGLE III survey. We have performed light curve fitting on these data (Layden & Sarajedini 2000) using the known periods in order to derive the minimum light colors of these stars. These were then used to calculate reddenings using equation 6 above. When we compare these reddenings to the results of applying our method (equations 7 and 8), we find a mean difference of 0.0291 0.005 (sem) mag in E(V–I). This is consistent with the error we have quoted for our reddening determinations of 0.026 mag thus providing support for the technique we have used to calculate the line of sight reddening to the LMC RR Lyraes.
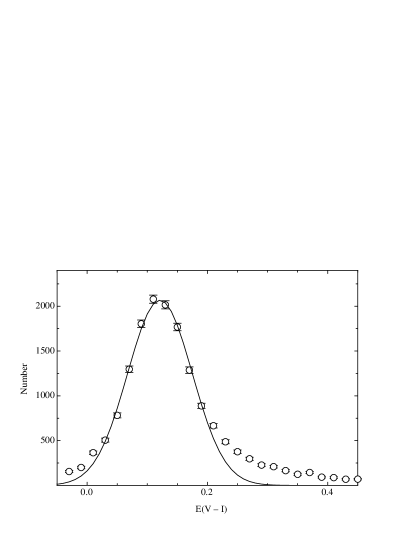
A Gaussian profile was fit to the distribution of reddening values for the RR Lyrae. The peak of this distribution is at E(V–I) = 0.12 with = 0.05, which corresponds to E(B–V) = 0.09. This value is in good accord with the work of Haschke et al. (2011), who found a mean LMC reddening of E(V – I ) = 0.09 0.07 mag from their analysis of red clump stars in the LMC and E(V – I ) = 0.11 0.06 mag based on the OGLE RR Lyrae stars. In fact, we can perform a star-by-star comparison of our reddenings with those from Haschke et al. (2011). Doing this, we find a mean difference of -0.021 0.041, which suggests that the two datasets are statistically indistinguishable. This offset is also consistent with the quoted error of 0.026 in our values of E(V–I). It should be noted that Haschke et al. (2011) utilized a completely different method than we have to estimate the RR Lyrae reddenings. In particular, they rely on RR Lyrae metallicities derived from the Fourier coefficients, which are then used in conjunction with theoretical light curve models to infer the intrinsic color of each RR Lyrae star in their sample.
It is also interesting to note that the mean reddening of the 12 old globular clusters in the LMC is E(V–I) = 0.11 0.06 (see Table 3), which is consistent with that of the RR Lyraes. All of these reddening values are, in turn, consistent with the range of values published in Table 2 of Imara & Blitz (2007), which extends from E(V-I) 0.03 to E(V-I) 0.26 with a mean value of E(V-I) 0.16.
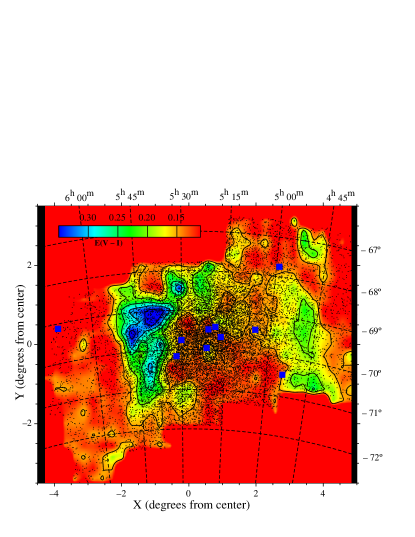
With reddenings for over 17,000 ab-type RR Lyraes in hand, we can also investigate the extinction map of the LMC. This is shown in Fig. 4, wherein the squares represent the locations of the old globular clusters in the LMC from Table 1 of Soszynski et al. (2009). There are a number of features of note in this diagram. First, the area around 30 Doradus and the southern CO ridge are prominent sources of extinction in the case of the RR Lyraes. There is an additional extinction ridge extending north-south along the western edge of the LMC surveyed area at RA4h50m. It is also important to note that there is an extinction “hole” in the central region of the LMC. Generally speaking, the oldest globular clusters in the LMC (blue squares in Fig. 4) tend to lie in areas of reduced extinction. This phenomenon brings forth the question of whether undiscovered old clusters may exist in areas where high extinction has prevented their identification. If so, it is vitally important for these old clusters to be identified and characterized because the overall dearth of old clusters in the LMC has made it challenging to study its early formation epochs using these clusters.
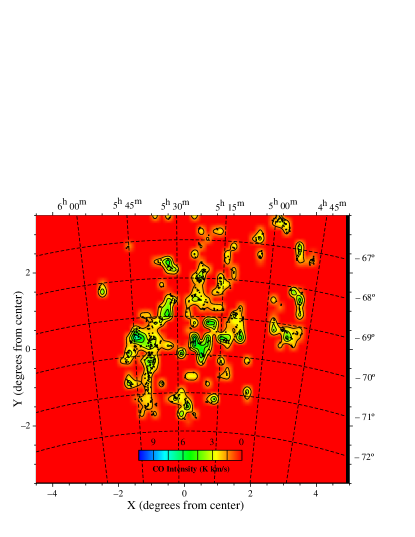
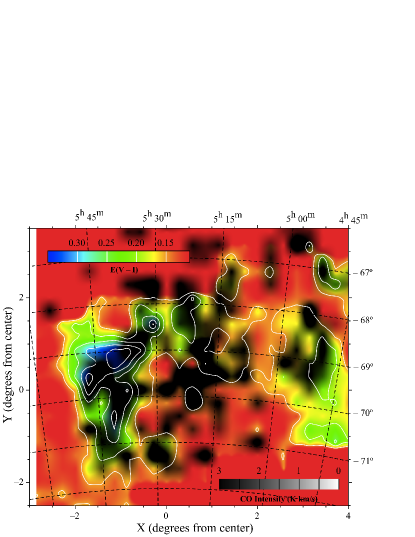
With a reddening map for the LMC in hand, it is of interest to compare it with maps of the CO emission from the LMC. The latest version of such a map is from the work of Wong et al. (2011) representing results of the Magellanic MOPRA Assessment (MAGMA) survey. This survey builds upon the previous work by Fukui et al. (2008) who used the 4.0m NANTEN radio telescope. Fig. 5 shows the intensity in units of K km/s of the CO emission from the clouds studied by Wong et al. (2011) from their Table 6. This figure is plotted to the same scale as Fig. 4, which represents the RR Lyrae reddening map.
A casual comparison of Fig. 5 and Fig. 4 suggests a high degree of correlation between the extinction as revealed by the RR Lyrae variables and the intensity of CO present in the line of sight. Further insight into this correlation can be gained by overplotting the two distributions as shown in Fig. 6. Once again, this figure emphasizes that the RR Lyrae reddenings and the CO intensity distributions are well correlated in their on-sky distribution. This suggests that the colors of the RR Lyraes are influenced by dust in the line of sight further indicating that some of the RR Lyraes are located behind and within the CO dust clouds. The one area that seems to be an exception to this assertion is the central region of the LMC, where we see emission from CO clouds but where the RR Lyrae reddenings are all relatively small (see Fig. 6). It is possible that, in this area, the CO clouds are predominantly on the far side of the LMC and/or the RR Lyraes are on the near side so that the dust extinction does not influence the colors of the RR Lyrae stars.
3.4 Distances
With metallicities, reddenings, and mean magnitudes in hand, it is a simple matter to calculate the distance to each of the over 17,000 ab-type RR Lyraes in the OGLE sample. First, we estimate the absolute magnitude of each RR Lyrae using from Chaboyer (1999), and calculate the extinction using from Schlegel et al. (1998).
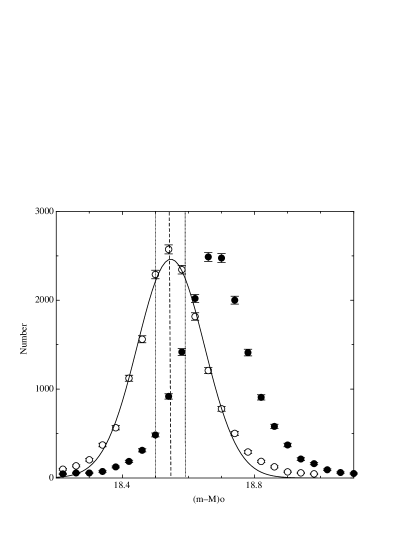
The resulting distribution of RR Lyrae distance moduli is shown as the open circles in Fig. 7. A Gaussian profile fit to this distance distribution yields a peak value of = 18.55 with a 1- standard deviation of 0.10 mag. This translates to a distance of 51.3 2.4 kpc. This value is well within the range of values for the distance to the LMC presented in the compilation of Clementini et al. (2003). Alternatively, we can perform this calculation using the Benedict et al. (2011) calibration between RR Lyrae absolute magnitude and metal abundance - . This yields the binned histogram shown by the filled circles in Fig. 7, which has a peak value of = 18.68 with a 1- standard deviation of 0.10 mag, as yielded by a Gaussian fit. Given the errors, this distance modulus is consistent with the one derived from the Chaboyer (1999) RR Lyrae relation, but it is on the high end of the distribution of LMC distances from Clementini et al. (2003).
The question arises as to whether the line-of-sight dispersion in distance is statistically significant or simply the result of measurement errors. To address this question, we note that Alcock et al. (2000) estimate metallicity errors of 0.31 dex from equation (1) above. This translates to an error of =0.071 mag in the absolute magnitude of each RR Lyrae. However, it is important to keep in mind that the 1- dispersion of the RR Lyrae metallicity distribution derived from the Alcock et al. (2000) relation (Fig. 1) is 0.25 dex, which is smaller than the error of an individual measurement of 0.31 dex. This suggests that 0.31 dex may be an overestimate of the error in equation (1). In any case, as discussed above, the reddening error is equal to 0.026 mag in E(V–I) leading to an uncertainty of =0.062 mag in the determination of the interstellar extinction. Ignoring for the moment the uncertainties in the measured V-band magnitudes, we find a distance modulus error of =0.094 mag. This error is consistent with the dispersion measured in the distance histogram shown in Fig. 7 suggesting that this line of sight dispersion in distance is dominated by the measurement errors in metallicity and reddening. We return to this point in the next section.
3.5 Distance Along Line of Maximum Gradient
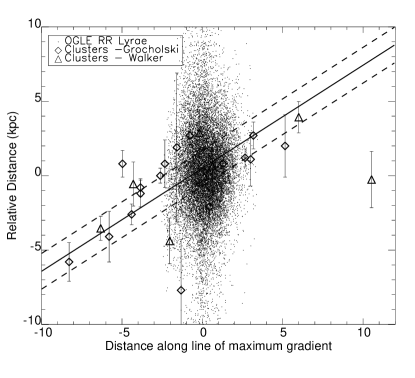
To examine the structure of the LMC as revealed by the ab-type RR Lyraes, we can use the“kinematic circular disk method” as detailed in van der Marel & Cioni (2001) and revisited by Grocholski et al. (2007). In this method, one assumes a model of a circular disk with stars in circular and non-spherical orbits. Then, when plotting the line-of-sight distance versus the distance along the line of the maximum velocity gradient, objects following circular orbits should fall along a distinct line. The slope of this line should indicate the inclination of the disk. Thus, objects which deviate from this slope likely have non-circular orbits.
In Figure 8, we show our derived distances for the RR Lyrae stars as a function of the distance along the line of maximum velocity gradient. Also plotted are the clusters from Grocholski et al. (2007) and Walker (1992). Figure 8 is modeled after Fig. 5 of Grocholski et al. (2007), except that here we plot the line-of-sight distances relative to the mean distance of the LMC. While the vast majority of the clusters in Figure 8 are found to reside within 1 kpc of the LMC disk (as indicated by the dashed lines), the RR Lyrae variables do not appear to follow this trend. The distribution of RR Lyraes shows no indication of being oriented along the slope of the line (i.e. the inclination of the LMC disk). In addition, a significant number of the RR Lyraes (45%) are found in the region beyond the 1 kpc thick disk (see Fig. 7) assumed for the LMC (Grocholski et al. 2007). One interpretation of this result is that the RR Lyraes in the OGLE sample populate a kinematically hot halo around the LMC, consistent with the findings of Minniti et al. (2003) and Pejcha & Stanek (2009, for a contrasting view, see Subramaniam & Subramanian 2009). However, as discussed in the previous section, the line-of-sight distance distribution of the RR Lyrae seems to be dominated by the measurement errors. As a result, the value of 45% is likely to be an upper limit for the fraction of the OGLE ab-type RR Lyraes that are members of the LMC halo.
4 Conclusions
In this paper, we present metallicities, reddenings, and distances of RR Lyrae stars in the LMC based on the OGLE III database. These stars are used to examine the metallicity gradient of the LMC, its extinction profile, and the line-of-sight distribution of the RR Lyrae as a proxy for the LMC’s halo population. From this investigation, we draw the following conclusions:
1. There appears to be a radial metallicity gradient of the RR Lyraes in the LMC. The significance of the gradient depends on how the properties of the RR Lyrae light curves (e.g. periods, amplitudes, Fourier coefficients) are converted to metallicity. Given this apparent dependence, it is important to measure spectroscopic metal abundances for a large sample of LMC RR Lyraes with a substantial radial extent.
2. The extinction of the RR Lyraes in the LMC is correlated with the location and emission of the CO clouds detailed by previous studies. However, the CO clouds do not appear to be correlated with the density of RR Lyraes across the face of the LMC. In addition, the old LMC globulars tend to be located in regions of low extinction. This underscores the need to survey the regions of higher extinction searching specifically for more old globular clusters.
3. Our analysis of the OGLE III ab-type RR Lyraes is inconclusive with regard to whether these stars belong to the halo or disk of the LMC. The RR Lyraes appear to have a line-of-sight distribution that is not consistent with the expected behavior of the LMC disk. However, the uncertainties inherent in our analysis and the distribution of the OGLE RR Lyraes in the LMC render this a tentative conclusion. In any case, previous work, such as Minniti et al. (2003), does suggest that there are RR Lyraes in the LMC that belong to a kinematically hot halo.
Acknowledgments
We thank Tony Wong for assistance with the MAGMA CO maps. We are also grateful to Aaron Grocholski for help with various aspects of the analysis presented in this paper. Both Raoul Haschke and Karen Kinemuchi provided valuables comments on an early version of this manuscript that greatly improved its clarity and presentation. We also thank an anonymous referee whose comments and suggestions were very helpful.
References
- Alcock et al. (2000) Alcock, C. J. et al. 2000, AJ, 119, 2194
- Benedict et al. (2011) Benedict, G. F. et al. 2011, AJ, 142, 187
- Borissova et al. (2006) Borissova, J., Minniti, D., Rejkuba, M., & Alves, D. 2006, A&Ap, 460, 459
- Brocato et al. (1996) Brocato, E., Castellani, V., Ferraro, F. R., Piersimoni, A. M. & Testa, V. 1996, MNRAS, 282, 614
- Carretta & Gratton (1997) Carretta, E. & Gratton, R. 1997, A&AS, 121, 95
- Chaboyer (1999) Chaboyer, B. 1999, in Post- Hipparcos Cosmic Candles, ASSL, Vol. 237, edited by A. Heck and F. Caputo (Dordrecht: Kluwer Academic Publishers) p.111
- Clementini et al. (2003) Clementini, G., Gratton, R., Bragaglia, A., Carretta, E., Di Fabrizio, L., & Maio, M. 2003, AJ, 125, 1309
- Colucci et al. (2011) Colucci, J. E., Bernstein, R. A., Cameron, S. A., & McWilliam, A. 2011, ApJ, 735, 55
- Dorfi & Feuchtinger (1999) Dorfi, E. A. & Feuchtinger, M. U. 1999, A&A, 348, 815
- Feast et al. (2010) Feast, M. W., Abedigamba, O. P., & Whitelock, P. A. 2010, MNRAS, 408, L76
- Friel et al. (2002) Friel, E. D., Janes, K. A., Tavarez, M., Scott, J., Katsanis, R., Lotz, J., Hong, L., & Miller, N. 2002, AJ, 124, 2693
- Fukui et al. (2008) Fukui, Y. et al. 2008, ApJS, 178, 56
- Gratton et al. (2004) Gratton, R., Bragaglia, A., Clementini, G., Carretta, E., Di Fabrizio, L., et al. 2004, A&A, 421, 937
- Grocholski et al. (2007) Grocholski, A. J., Sarajedini, A., Olsen, K.A. G., Tiede, G. P. & Mancone, C. L. 2007, AJ, 134, 680
- Guldenschuh et al. (2005) Guldenschuh, K. et al. 2005, PASP, 117, 721
- Haschke et al. (2011) Haschke, R., Grebel, E. K., & Duffau, S. 2011, AJ, 141, 158
- Haschke et al. (2012a) Haschke, R., Grebel, E. K., Duffau, S., & Jin, S. 2012a, AJ, 143, 48
- Haschke et al. (2012b) Haschke, R., Grebel, E. K., & Duffau, S. 2012b, AJ, in press (arXiv:1207.5791)
- Imara & Blitz (2007) Imara, N., & Blitz, L. 2007, ApJ, 662, 969
- Jeffery (2011) Jeffery, E. J., Smith, E., Brown, T. M., Sweigart, A. V., Kalirai, J., Ferguson, H. C., Guhathakurta, P., Renzini, A., & Rich, R. M. 2011, AJ, 141, 171
- Johnson et al. (1999) Johnson, J., Bolte, M., Stetson, P. B., Hesser, J. E., & Somerville, R. S. 1999, ApJ, 527, 199
- Jurcsik (1995) Jurcsik, J. 1995, AcA, 45, 653
- Keeping (1962) Keeping, E. S. 1962, Introduction to Statistical Inference (Princeton: Van Nostrand)
- Kinman et al. (1991) Kinman, T. D., Stryker, L. L., Hesser, J. E., Graham, J. A., Walker, A. R., Hazen, M. L., & Nemec, J. M. 1991, PASP, 103, 1279
- Kunder et al. (2010) Kunder, A., Chaboyer, B., & Layden, A. C. 2010, AJ, 139, 415
- Layden & Sarajedini (2000) Layden, A. C. & Sarajedini, A. 2000, AJ, 119, 1760
- Mackey & Gilmore (2004) Mackey, A. D. & Gilmore, G. F., 2004, MNRAS, 352, 153
- Minniti et al. (2003) Minniti, D., Borissova, J., Rejkuba, M., Alves, D. R., Cook, K. H., & Freeman, K. C. 2003, Science, 301, 1508
- Mucciarelli et al. (2010) Mucciarelli, A., Origlia, L., & Ferraro, F. 2010, ApJ, 717, 277
- Olsen et al. (1998) Olsen, K. A. G., Hodge, P. W., Mateo, M., Olszewski, E. W., Schommer, R. A., Suntzeff, N. B., & Walker, A. R. 1998, MNRAS, 300, 665
- Olszewski et al. (1991) Olszewski, E. W., Schommer, R. A., Suntzeff, N. B., & Harris, H. C. 1991, AJ, 101, 515
- Papadakis et al. (2000) Papadakis, I., Hatzidimitriou, D., Croke, B. F. W., & Papamastorakis, I. 2000, AJ, 119, 851
- Pejcha (2009) Pejcha, O. & Stanek, K. Z. 2009, ApJ, 704, 1730
- Sarajedini (2001) Sarajedini, A. 2011, ”RR Lyraes in M31 and M33,” in RR Lyrae Stars, Metal-Poor Stars, and the Galaxy, Carnegie Observatories Astrophysics Series, Vol. 5. Edited by A. McWilliam. Pasadena, CA: The Observatories of the Carnegie Institution of Washington, p.181
- Sarajedini et al. (2006) Sarajedini, A., Barker, M. K., Geisler, D., Harding, P., & Schommer, R. 2006, AJ, 132, 1361
- Sharma et al. (2010) Sharma, S., Borissova, J., Kurtev, R., Ivanov, V. D., & Geisler, D. 2010, AJ, 139, 878
- Smith (1995) Smith, H. A. 1995, RR Lyraes, Cambridge Astrophysics Series, Vol. 27 (Cambridge, UK)
- Smolec (1005) Smolec, R. 2005, AcA, 55, 59
- Soszyński (2009) Soszyński, I., Udalski, A., Szymański, M. K., Kubiak, M., Pietrzyński, G., Wyrzykowski, L., Szewczyk, O., Ulaczyk, K., & Poleski, R. 2009, AcA, 59, 1
- Subramaniam & Subramanian (2009) Subramaniam, A. & Subramanian, S. 2009, A&A, 503, L9
- Suntzeff (1992) Suntzeff, N. B., Schommer, R. A., Olszewski, E. W., & Walker, A. R. 1992, AJ, 104, 1743
- Tiede et al. (2004) Tiede, G. P., Sarajedini, A., Barker, M. K. 2004, AJ, 128, 224
- Udalski (1992) Udalski, A., Szymański, M., Kaluzny, J., Kubiak, M., & Mateo, M. 1992, AcA, 42, 253
- Udalski (2003) Udalski, A., Pietrzynski, G., Szymański, M., Kubiak, M., Zebrun, K., Soszynski, I., Szewczyk, O., & Wyrzykowski, L. 2003, AcA, 53, 133
- van der Marel & Cioni (2001) van der Marel, R. P. & Cioni, M. -R., L., 2001, AJ, 122, 1807
- van den Bergh (2004) van den Bergh, S. 2004, AJ, 127, 897
- Walker (1992) Walker, A. R. 1992, ApJ, 390, L81
- Wong et al. (2011) Wong T. et al. 2011, ApJS, 197, 16
- Zaritsky et al. (1994) Zaritsky, D., Kennicutt, R. C., Huchra, J. P. 1994, ApJ, 420, 87
- Zinn & West (1984) Zinn, R. J. & West, M. J. 1984, ApJS, 55, 45