Fine structures in the atmosphere above a sunspot umbra
We present simultaneous photospheric and chromospheric observations of the trailing sunspot in NOAA 10904, obtained with the Swedish Solar Telescope (SST) La Palma, Canary Islands. Time series of high resolution Ca ii images show transient jet-like structures in sunspot umbrae are elongated, which we call umbral microjets. These jets are directed roughly parallel to nearby penumbral microjets, suggesting that they are aligned with the background magnetic field. In general, first a bright dot-like structure appears, from which a jet later emerges, although some jets appear without an associated chromospheric dot. Bright photospheric umbral dots are associated with umbral microjets arising in the outer umbra. Nevertheless, a one-to-one correspondence between jet-like events and underlying umbral dots is not seen. They are typically less than 1″ long and less than 03 wide. The typical lifetime of umbral microjets is around one minute. The brightness of these structures increases from the center of the umbra towards the umbra-penumbra boundary along with the brightness of the local background.
Key Words.:
Sun: convection – sunspots – Sun: chromosphere1 Introduction
Fine-scale jet-like features are observed at the edges of penumbral filaments and referred to as penumbral microjets (Katsukawa et al., 2007). They represent one of the most exciting and enigmatic additions to sunspot dynamic features. These jets are associated with transient brightening. They are aligned with the the background magnetic field (Jurčák & Katsukawa, 2008). So far, observations of these jets have been restricted to the penumbra.
The chromosphere above sunspot umbrae shows other dynamic phenomena, mainly umbral flashes, bright patches appearing with a 3-min periodicity . They are thought to be the chromospheric counterparts of photospheric umbral oscillations that steepen with height due to the lower density and produce hot shocks (Kneer et al., 1981; Turova et al., 1983; Socas-Navarro et al., 2000; López Ariste et al., 2001; Tziotziou et al., 2002; Rouppe van der Voort et al., 2003; Nagashima et al., 2007; Tziotziou et al., 2007; Socas-Navarro et al., 2009). It has been suggested that they have the same origin as running penumbral waves, ring-like disturbances moving from the edge of the umbra towards the penumbra (Tsiropoula et al., 2000; Rouppe van der Voort et al., 2003; Bloomfield et al., 2007). Recent observations in the Ca ii line obtained with Hinode show a fine filamentary structure in umbral flashes having a similar size-scale as the penumbral jets (Socas-Navarro et al., 2009). This encourages us to look at the umbral chromosphere with even higher resolution data for possible counterparts of penumbral jets. Further motivation for such a study is provided by the underlying similarity (at photospheric layers) between umbral dots and penumbral filaments revealed by stat-of-the-art MHD simulations (e.g. Schüssler & Vögler, 2006; Rempel et al., 2009). According to these simulations the difference in appearance is driven basically by the difference in inclination of the magnetic field: both features are manifestations of overturning convection. One idea for the origin of penumbral jets is that they are produced by magnetic reconnection between field twisted by roll-like convective motions and more laminar field lines (Magara, 2010). Similar process could also take place at the edges of umbral dots.
We use high resolution Ca ii observations obtained with the Swedish Solar Telescope to look for chromospheric jets in a sunspot umbra.
2 Observations
Multi-wavelength observations of the trailing sunspot of the active region NOAA 10904 were obtained at the Swedish Solar Telescope (SST) La Palma, Canary Islands on August 13, 2006. The center of the field of view was located at a heliocentric angle of (), bf which corresponds to solar disk coordinates x = −556″and y = −254″.
The sunlight was divided into a blue and a red channel close to the f/47 focus of the SST by using a dichroic mirror plate. The blue beam was further divided, passed through various interference filters and imaged on four Kodak Megaplus 1.6 CCD cameras. One of these cameras was fed with light from the bandhead of the CH molecule at = 4305 (6.5 Å FWHM, G-Band) formed in the photosphere. Two cameras, one of them slightly out of focus (for phase-diversity wavefront sensing), were fed with the light passing an 11 Å interference filter with a central wavelength of 4363 Å (G-continuum). In front of the 4th camera a tiltable narrow-band Ca ii filter (FWHM = 1.1 Å) sampled the line at two wavelength positions: (1) in the line center and (2) in the blue wing at 0.6 Å from the line center, probing the lower chromosphere and mid-upper photosphere respectively. For these two wavelength positions, four frames at a time were recorded alternatingly. The frame rate was between 3 and 4 frames per second (G-continuum) and the exposure time was 13 ms for all four cameras in the blue beam. The size of one pixel corresponds to 0041 in the blue beam.
The G-continuum and the Ca ii data were reconstructed by means of speckle interferometric techniques (see Hirzberger et al., 2009, who analysed the same observations, for more detail on the instrumental setup and image reconstruction). After reconstruction, a cadence of 19 s was achieved for these time series. For the present analysis we used only time series of G-continuum and Ca ii images, each of them containing 151 images.
Since umbral brightness varies from the dark nuclei toward the penumbral boundary and bright patches are often dominated by the highly variable umbral flashes, we selected the darkest parts of the umbra as the intensity reference used to normalize intensity in each image. To isolate bright features in the umbra, an intensity threshold of 5 of the mean local background was applied and a binary mask created, with all pixels below the threshold being set to zero and those above to 1. The selected threshold thus depends on the location of the jet in the umbra. The local background was selected by choosing a box (size twice the dimensions of feature) with the bright feature at its center. The mean intensity of the box excluding the bright feature is defined as the local background. We use mathematical morphological operations (MMO, Gonzalez & Woods, 2008) on binary images to enhance and extract the features of interest. Thus obtained binary images are then “opened” (Haralick et al., 1987) with a 3 pixel by 3 pixel square-shaped operator, using “dilation” and “erosion” operations (see Maurya & Ambastha, 2010, for more detail). The width of the jet is defined as the width measured at the middle point of the length of the segmented jet.
3 Analysis
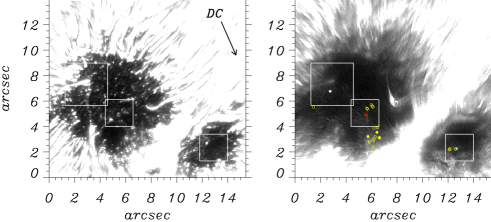
Figure 1 shows simultaneous images of the sunspot in the G-continuum and in the Ca ii line core. In both the images a gray-scale is chosen to better show the umbral features. The sunspot is divided into two umbrae by a broad lightbridge. In the larger umbra, besides umbral dots, a dark nucleus centered at x=5″and y=3″is visible. Also, penumbral filaments penetrate well into the larger umbra. The smaller umbra shows peripheral umbral dots and a dark nucleus in its center. The penumbral intrusions visible in the photosphere can also be identified in the Ca ii image, but with lower contrast. Central umbral dots are not visible in the umbral chromosphere. This suggests that due to the narrow width of the interference filter used in the observations, the photospheric contribution is efficiently blocked in these images. In addition, in the chromosphere many jet-like bright structures, located above penumbral filaments (penumbral microjets, cf. Katsukawa et al. (2007)) as well as above the lightbridge and several penumbral intrusions are visible.
An animation of the thresholded Ca ii images (see online mpeg movie attached to Fig. 1) reveals several dynamic phenomena in the umbral chromosphere. The well-known umbral flashes are visible throughout the umbra. They contain very fine filamentary structures, confirming the findings of Socas-Navarro et al. (2009). Apart from the bright patches produced by umbral flashes, several bright elongated jet-like structures can be recognized. In most cases first a bright dot-like structure appears and then an elongated jet-like feature becomes discernible in subsequent images, although sometimes the jet appears without the prior appearance of a dot-like structure. These jet-like structures are always oriented in a direction parallel to nearby penumbral microjets. When an umbral flash passes through these structures their brightness increases, but they are also clearly present outside umbral flashes. This implies that these elongated structures are quiet distinct from the fine filamentary structure of umbral flashes.
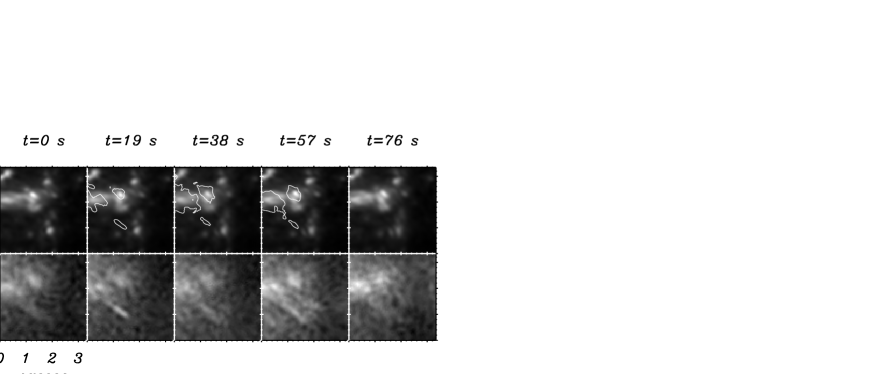
An example of the evolution of a jet-like event close to the umbra-penumbra boundary is illustrated in Fig. 2. In the Ca ii images (lower row), a prominent bright elongated structure becomes visible, starting at s. No dot-like structure is seen before the appearance of this jet. Due to the location of the limb towards the left the jet is expected to be expanding in the upper left direction although the expansion occurs too fast to be followed at our cadence. The jet’s brightness decreases in the subsequent frames, but due to the passage of an umbral flash, at s (the diffuse brightening in the upper part of the frame) its brightness is again enhanced. In the G-continuum images, shown in the upper row, a row of bright peripheral umbral dots is visible. Assuming a formation height difference of 500 km between these two spectral regions and due to the inclined viewing angle, we should expect the photospheric correspondent of this structure to be located along the jet’s major axis and shifted toward the lower right by 082. From the Ca ii intensity contours overplotted on the G-continuum images the footpoint of this jet is expected to lie close to the bright umbral dot at x=20 and y=07.
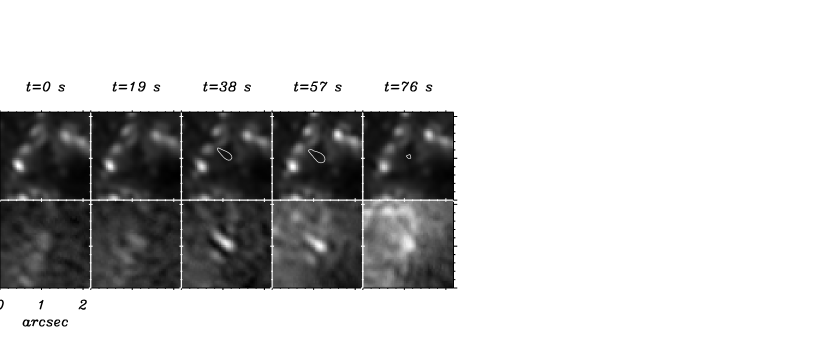
Figure 3 illustrates another example of the evolution of jets in the Ca ii images, now located in the central part of the umbra. In the beginning, a faint dot is visible that develops an elongated shape. At s it is brightest and most strongly elongated. From s on it starts to becoming a round again and begins to fade. From s to s the brightness of the background is enhanced due to the passage of an umbral flash. No clear relationship can be established between the supposed footpoint of the jet and the chain of umbral dots visible in the corresponding G-continuum images.
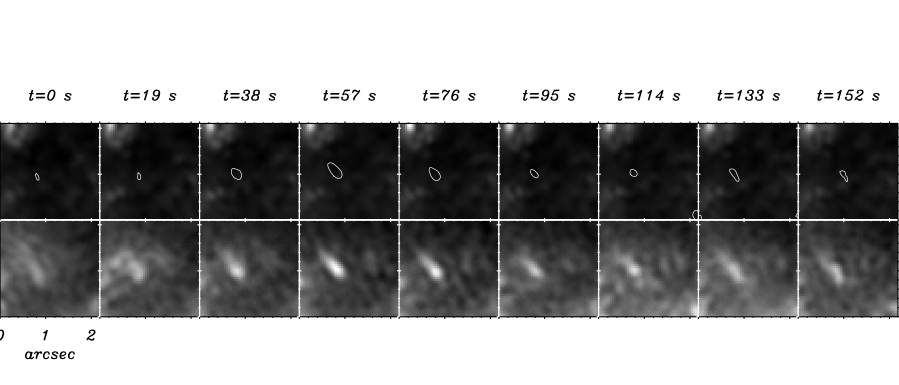
Figure 4 shows another example of the evolution of such an event, this one located in the central part of the smaller umbra. No UD is present along the major axis of this Ca ii jet in the G-continuum images.
In total, we have identified 19 and 4 events in the larger and the smaller umbra, respectively. The 10 events identified in the central region of both umbrae do not show a clear correlation with an underlying photospheric umbral dot, whereas all 13 events identified close to the umbra-penumbra boundary occur close to UDs. In 2 of 13 events, a photospheric UD is located close to where the footpoint of the chromospheric jet is expected to lie. The other 11 cases are observed over clusters of peripheral UDs so that it is difficult to assign them to a single UD in the cluster. However, better statistics are required to establish if there is any correspondence between UDs and jet-like events in different parts of sunspot umbra.
Histograms of various parameters associated with these events are illustrated in Fig. 5. The histogram of normalized intensities with respect to the darkest part of the umbra, integrated over the jet’s areas for each snapshot in which they are present (solid line) shows a broad range since their relative brightness depends on the location within the umbra. The events identified in the central part of the umbra display a lower brightness while events close to the umbra-penumbra boundary exhibit higher brightness. This might be partially due to straylight. The histogram of maximum normalized intensity of each jet is overplotted (dashed line).
The maximum width, of the umbral jets (Fig. 5b) is found to be 200 km which is half of the maximum width of penumbral microjets of about 400 km reported by Katsukawa et al. (2007). The lower widths found here may be due to the fact that the resolution of images presented here is higher, although umbral jets may also be narrower than their penumbral counterparts. This latter may well be the case since umbral jets are also significantly shorter than the penumbral ones (see panel c), where 1000-4000 km (Katsukawa et al., 2007). The histogram of the lengths of the structures shows a monotonic decreasing trend towards longer structures (for lengths >04). The umbral-microjets are less long than penumbral microjets. Finally, the histogram of lifetimes of 23 jet events shows that most of the jets live around 1 min ( i.e. 3 frames of our observations). Jets found in the smaller umbra show longer lifetimes of around 4 min. These values are not too different from the life times of penumbral microjets reported to be up to two minutes by Katsukawa et al. (2007).
Histogram of maximum local contrast for each jet is plotted in Fig. 6. The contrast of most umbral jet events is higher than the values reported by Katsukawa et al. (2007) (10 to 20 with respect to underlying penumbral structure).


4 Discussion and conclusion
We have presented the first high resolution observations of bright small-scale elongated and short-lived structures in the atmosphere above a sunspot umbra, which we call umbral microjets, in accordance with microjets observed by Katsukawa et al. (2007). These structures are elongated and in some cases appear as extensions of bright dot-like features. The brightness of these structures is higher than the brightness of penumbral microjets.
From H observations Kitai (1986) and Kilcik et al. (2012) found an association of photospheric umbral dots with chromospheric umbral dots. However, the width of the filter used for these observations was large enough (0.5 Å and 0.25 Å respectively) to allow a photospheric contribution in the case of H (Socas-Navarro & Uitenbroek, 2004) so that many of these observed ’chromospheric’ umbral dots may in fact have been photospheric ones. However, they observed chromospheric umbral dots, but given the difference in the filter widths and line formation characteristics, it is not possible to directly relate their chromospheric umbral dots to the umbral jets found in the present study. The filter width used in the present study is narrow enough (1.1 Å for Ca ii ) to suppress the photospheric contribution, which is evident from the fact that we cannot see photospheric umbral dots in the Ca ii core data. Only larger UDs are seen in Ca ii wing images obtained at 0.6 Å from the line core and no jet like events are visible in the Ca ii wing images (not shown here). This indicates that the jet-like structures visible in the Ca ii core images, are chromospheric or temperature minimum region phenomena. Due to the formation height difference of the Ca ii line core images and the G continuum images, as well as the inclined line of sight, it is difficult to find an accurate relationship with photospheric umbral dots. We cannot rule out, however, that some jet-like events might be associated with tiny UDs which are not resolved.
Simulated photospheric umbral dots are associated with upflows in their central parts and with downflows at their edges (Schüssler & Vögler, 2006). In these simulations jet-like outflows above the cusp are seen. Schüssler & Vögler (2006) proposed that “outflows occur above most upflow plumes and could possibly affect the chromospheric dynamics above sunspots”. The simulations of Schüssler & Vögler (2006) cannot predict effects to the chromosphere in detail due to closed top boundary. These simulations only cover the lower layers of the umbral atmosphere. Thus the observed umbral microjets may represent these upflow jets that escape from the photosphere.
An alternative scenario is suggested by the simulations reported by Bharti et al. (2010), who find that in larger UDs, strong downflows drag field lines downwards and produce hairpin-like structures causing regions of reversed magnetic polarity at the edges of umbral dots. Consequently the umbral microjet may be caused by reconnection of opposite polarity fields in the photosphere. A similar mechanism has also been proposed to explain penumbral microjets (see Katsukawa et al., 2007; Magara, 2010). However, reversed polarity regions were found only in larger UDs with strong downflows at the edges which could not explain those observed jets not found to be associated with UDs. Also, due to the limited spatial resolution of present observations it is difficult to verify this scenario and to demonstrate that reverse polarities really are present. The magnetic field above the sunspot umbra might be quite complicated (Solanki, 2003; Socas-Navarro, 2005; Tritschler et al., 2008), which could provide alternate topologies and mechanisms for impulsive dissipation above sunpot umbrae.
Acknowledgements.
The Swedish 1-m Solar telescope is operated on the island of La Palma by the Institute for Solar Physics of the Royal Swedish Academy of Sciences in the Spanish Observatorio del Roque de los Muchachos of the Instituto de Astrofísica de Canarias. This work has been partly supported by the WCU grant No. R31-10016 funded by the Korean Ministry of Education, Science and Technology. L.B. is grateful to the Inter University Centre for Astronomy and Astrophysics (IUCAA) Reference Center at the Department of Physics, Mohanlal Sukhadia University, Udaipur, India, for providing computational facilities.References
- Bharti et al. (2010) Bharti, L., Beeck, B., & Schüssler, M. 2010, A&A, 510, A12
- Bloomfield et al. (2007) Bloomfield, D. S., Solanki, S. K., Lagg, A., Borrero, J. M., & Cally, P. S. 2007, A&A, 469, 1155
- Choudhuri (1986) Choudhuri, A. R. 1986, ApJ, 302, 809
- Gonzalez & Woods (2008) Gonzalez, R. C. & Woods, R. E. 2008, Digital image processing (Prentice Hall, New Delhi), –
- Haralick et al. (1987) Haralick, R. M., Sternberg, S. R., & Zhuang, X. 1987, IEEE Trans. Pattern Anal. Mach. Intell., 9, 532
- Hirzberger et al. (2009) Hirzberger, J., Riethmüller, T., Lagg, A., Solanki, S. K., & Kobel, P. 2009, A&A, 505, 771
- Jurčák & Katsukawa (2008) Jurčák, J. & Katsukawa, Y. 2008, A&A, 488, L33
- Katsukawa et al. (2007) Katsukawa, Y., Berger, T. E., Ichimoto, K., et al. 2007, Science, 318, 1594
- Kilcik et al. (2012) Kilcik, A., Yurchyshyn, V. B., Rempel, M., Abramenko, V., Kitai, R., Goode, P. R., Cao, W., Watanabe, H. 2012, ApJ, 745, 163
- Kitai (1986) Kitai, R. 1986, Sol. Phys., 104, 287
- Kneer et al. (1981) Kneer, F., Mattig, W., & v. Uexkuell, M. 1981, A&A, 102, 147
- López Ariste et al. (2001) López Ariste, A., Socas-Navarro, H., & Molodij, G. 2001, ApJ, 552, 871
- Magara (2010) Magara, T. 2010, ApJ, 715, L40
- Maurya & Ambastha (2010) Maurya, R. A. & Ambastha, A. 2010, Sol. Phys., 262, 337
- Nagashima et al. (2007) Nagashima, K., Sekii, T., Kosovichev, A. G., et al. 2007, PASJ, 59, 631
- Rempel et al. (2009) Rempel, M., Schüssler, M., & Knölker, M. 2009, ApJ, 691, 640
- Rouppe van der Voort et al. (2003) Rouppe van der Voort, L. H. M., Rutten, R. J., Sütterlin, P., Sloover, P. J., & Krijger, J. M. 2003, A&A, 403, 277
- Schüssler & Vögler (2006) Schüssler, M. & Vögler, A. 2006, ApJ, 641, L73
- Socas-Navarro (2005) Socas-Navarro, H. 2005, ApJ, 631, L167
- Socas-Navarro et al. (2009) Socas-Navarro, H., McIntosh, S. W., Centeno, R., de Wijn, A. G., & Lites, B. W. 2009, ApJ, 696, 1683
- Socas-Navarro et al. (2000) Socas-Navarro, H., Trujillo Bueno, J., & Ruiz Cobo, B. 2000, Science, 288, 1398
- Socas-Navarro & Uitenbroek (2004) Socas-Navarro, H. & Uitenbroek, H. 2004, ApJ, 603, L129
- Solanki (2003) Solanki, S. K. 2003, A&A Rev., 11, 153
- Tritschler et al. (2008) Tritschler, A., Uitenbroek, H., & Reardon, K. 2008, ApJ, 686, L45
- Tsiropoula et al. (2000) Tsiropoula, G., Alissandrakis, C. E., & Mein, P. 2000, A&A, 355, 375
- Turova et al. (1983) Turova, I. P., Teplitskaia, R. B., & Kuklin, G. V. 1983, Sol. Phys., 87, 7
- Tziotziou et al. (2007) Tziotziou, K., Tsiropoula, G., Mein, N., & Mein, P. 2007, A&A, 463, 1153
- Tziotziou et al. (2002) Tziotziou, K., Tsiropoula, G., & Mein, P. 2002, A&A, 381, 279