∎
Tel.: +972-2-6586551
Fax: +972-2-5617805
11email: michael.golosovsky@mail.huji.ac.il
The transition towards immortality: non-linear autocatalytic growth of citations to scientific papers
Abstract
We discuss microscopic mechanisms of complex network growth, with the special emphasis of how these mechanisms can be evaluated from the measurements on real networks. As an example we consider the network of citations to scientific papers. Contrary to common belief that its growth is determined by the linear preferential attachment, our microscopic measurements show that it is driven by the nonlinear autocatalytic growth. This invalidates the scale-free hypothesis for the citation network. The nonlinearity is responsible for a dramatic dynamical phase transition: while the citation lifetime of majority of papers is 6-10 years, the highly-cited papers have practically infinite lifetime.
Keywords:
power-law distribution citations preferential attachment complex networks autocatalytic growthpacs:
01.75.+m, 02.50.Ga, 89.75.Fb, 89.75.Da1 General introduction
A lot of empirical evidence for the power-law degree distribution in natural networks has been amassed during last decade. This led to the conjecture that these networks are scale-free. It is widely believed that the growth of the scale-free networks is driven by the cumulative advantage mechanism Price which is commonly known as the preferential attachment Barabasi ; Newman_SIAM . This mechanism assumes that , the number of links acquired by a node during a short time interval is determined by the number of already acquired links ,
| (1) |
Here, is the node degree, is the ”initial attractivity” and is the attachment rate (aging function) which is time-dependent. Equation 1 yields the power-law degree distribution, , which is generally considered as a fingerprint of a scale-free network. The linear preferential attachment (Eq. 1) is believed to be one of the most important microscopic mechanisms that generates the scale-free complex networks which are so ubiquitous in nature.
This statement is often reversed and the power-law degree distribution in a growing network is considered as an evidence for the linear preferential attachment. The parameter is estimated from the exponent of the degree distribution Barabasi :
| (2) |
where is the mean degree. This approach meets several difficulties. First of all it yields unrealistically high . Second and most important- the validity of the power-law approximation for degree distribution in complex networks has been contested. Indeed, since the node degree is a discrete and non-negative number, the scale-free power-law function cannot provide a good fit for the nodes with small degree. At best, it can fit only the fat tail of the distribution. However, several recent studies showed that the degree distribution in complex networks can deviate from the power-law dependence even in the fat tail Redner ; Amaral ; Fortunato ; Petersen ; Golosovsky_EPL .
Krapivsky and Redner KRL showed that the deviation necessarily occurs if the attachment kernel is nonlinear,
| (3) |
In particular, for sublinear attachment kernel, the network is characterized by the stretched exponential degree distribution; while for the superlinear kernel, , the network organizes into a ”winner takes all” configuration KRL ; Dorogovtsev2002 . While for linear attachment kernel the network achieves stationary degree distribution, for the nonlinear case the degree distribution is nonstationary. In the sequel we call the dynamics governed by Eq. 3 as the ”nonlinear autocatalytic growth” Ofer99 ; Blank2000 and reserve the term ”preferential attachment” for Eq. 1 that generates the power-law degree distribution.
To what extent the growth mechanism of real networks deviates (Eq. 1) is an important question. Recent experimental studies Redner ; Jeong ; Eom2008 ; Eom2011 ; Valverde ; Csardi ; Wang ; Tomassini ; Newman ; Capocci ; Bingol ; Eisenberg ; Sheridan that measured microscopic growth of complex networks, came up with the conclusion that the attachment exponent is close to unity, in such a way that the growth mechanism is nearly linear (see Table I) and thus follows Eq.1. However, to which extent deviates from unity remained an open question until now. The above studies could hardly measure this deviation due to time-dependence of , finite precision limited by the size of their databases and, most important - due to uncertainty arising from the use of different methodologies. In particular, Ref. Sheridan applied four different methods to measure attachment kernel in the network of the US patent-to-patent citations and found different exponents ranging from 1.12 to 1.38.
| Network | Ref. | Attachment | Method |
| exponent | |||
| Citations | Jeong et al. Jeong | 0.95 | cumulation |
| of scientific papers | Eom Fortunato Eom2011 | 1 | cumulation |
| Redner Redner | 0.9-1.05 | running average | |
| Wang et al. Wang | 1 | running average | |
| Golosovsky Solomon Golosovsky_PRL | 1-1.25 | histogram | |
| (grows with time) | |||
| Citations | Csardi et al. Csardi | 1.2 | histogram |
| of US patents | Sheridan et al. Sheridan | 1.23-1.27 | Metropolis-Hastings |
| Valverde et al. Valverde | 1-1.25 | cumulation | |
| (grows with time) | |||
| Scientific | Jeong et al. Jeong | 0.8 | cumulation |
| collaboration | Tomassini Luthi Tomassini | 0.76 | cumulation |
| Newman Newman | 1 | histogram | |
| Movie actors | Jeong et al. Jeong | 1 | cumulation |
| Eom et al. Eom2008 | 1 | cumulation | |
| Wikipedia | Capocci et al. Capocci | 0.76 | histogram |
| Jeong et al. Jeong | 1.05 | cumulation | |
| Internet | Eom et al. Eom2008 | 1 | cumulation |
| Internet Dictionary | Herdagdelen et al. Bingol | 1 | histogram |
| Protein networks | Eisenberg Levanon Eisenberg | 1 | cumulation |
The goal of our present study is the high precision measurement of the microscopic growth rate of a complex network and the determination of the attachment exponent . Following the accepted practice Redner ; Jeong ; Eom2011 ; Wang , as an object of our research we chose one of the best-documented complex networks: citations to scientific papers. Here, the papers are nodes and citations to these papers are links. We performed high-statistics and time-resolved study of the citation dynamics of a very large and homogeneous set of papers. In what follows we compare two methods of measuring the microscopic growth rate of this network: averaging (histogram) and cumulation. We found that the former method is quite reliable and yields superlinear attachment kernel, , while the latter method is prone to quantization errors. We came to conclusion that the microscopic growth mechanism of the citation network follows nonlinear autocatalytic growth (Eq. 3) with .
We elaborate on a dramatic consequence of nonlinearity: if one considers a citations dynamics governed by the superlinear attachment kernel, one is led to conclusion that this network contains a subset of the papers that will be cited forever. Thus we witness a dynamical phase transition in which citation lifetime of a paper diverges to infinity. Our measurements provide experimental evidence for such runaway papers that have practically infinite citation lifetime.
2 Methodology
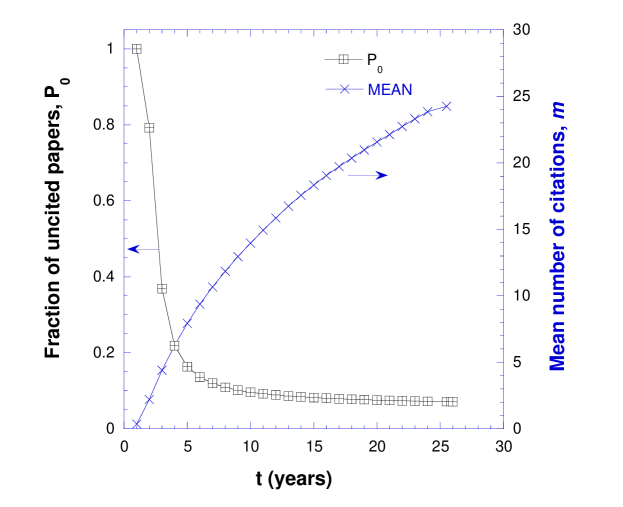
To assess the microscopic growth mechanism of the citation network we focussed on one discipline- Physics. We considered a cohort of papers published in the same year and measured the number of citations garnered by each paper in every subsequent year . To this end we used the Thomson-Reuters ISI Web of Science, chose 82 leading Physics journals, excluded review articles, comments, editorial, etc., and analyzed citation history of 40,195 original research papers published in these journals in . The cumulative citation distributions for this data set were demonstrated elsewhere Golosovsky_EPL . Figure 1 shows some aggregate characteristics of this set: the mean number of citations and the fraction of uncited papers.
In what follows we focus on two variables: (a) - the cumulative number of citations, i.e. the total number of citations accumulated by a paper in the period between and ; and (b) - the number of additional citations gained by the same paper in a short time window between and . Here, year and (if then , in such a way that measures the number of citations during the year when the paper was published). Figure 2 shows versus . (Specifically, is the number of citations garnered by a paper from 1984 to 1989 while is the number of citations garnered by the same paper in 1990.) While the trend of increasing versus is clearly visible, the fluctuations are so strong that Fig. 2 does not provide an obvious proof of the validity of Eq. 1.
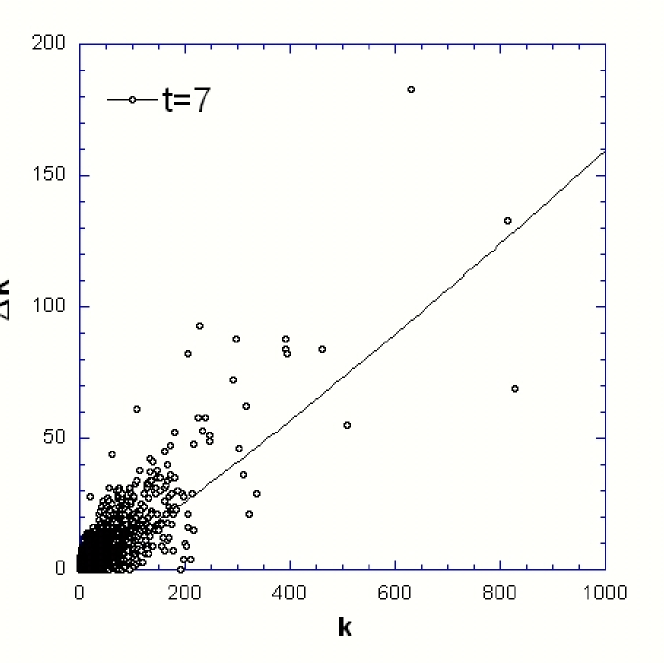
This is not unexpected since the actual number of newly acquired citations is a stochastic variable. We define which is the average citation rate over the ensemble of the nodes with the same . The autocatalytic growth model actually claims that , in such a way that
| (4) |
where is a random variable with zero mean and variance (for brevity we replace thereon by ). In contrast to which is a discrete variable, is a continuous one. To verify whether the noisy data, such as those shown in Fig. 2, are generated by the growth law suggested by Eq. 4, there have been developed two methods: averaging (histogram) and cumulation. The processing of our data using these methods yielded conflicting results. In what follows we compare these two methods and develop a control tool to check their internal consistency.
3 Comparison between different methods to measure the microscopic growth law of citation network
3.1 Histogram (Averaging) Method
To infer the microscopic growth law from the noisy data such as those shown in Fig. 2, one bins the data, finds the mean for each bin, and compares the resulting histogram to the prediction of Eq. 4. This approach was first used by Newman Newman to verify the linear preferential attachment hypothesis in real networks. The Refs. Csardi ; Capocci ; Bingol followed this approach as well, while Refs. Redner ; Wang used a very similar moving average procedure.
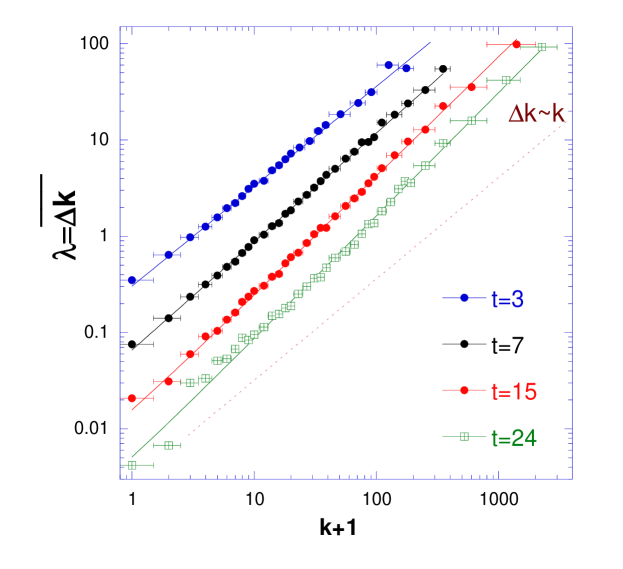
To process our data in such a way we chose a certain citing year , grouped all papers into 40 logarithmically-spaced bins, each bin containing the papers with close , found the mean number of next year citations for each bin and plotted it versus . Figure 3 shows such dependences. In particular, the black circles indicate the results of the averaging procedure applied to the data of the Fig. 2. The dependences are fairly well fitted by Eq. 4.
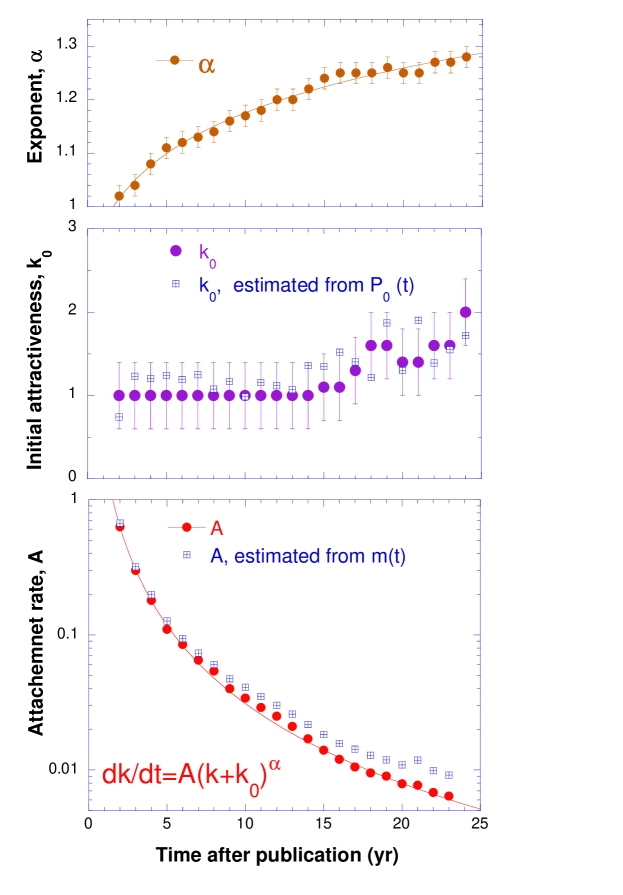
Figure 4 shows time dependence of the fitting parameters . The exponent gradually increases with time from to , indicating linear attachment kernel for ”young” papers and superlinear attachment kernel for ”old” papers. The initial attractiveness is almost time-independent and is surprisingly close to ad hoc assumption of de Solla Price Price . The time dependence of the attachment rate follows the empirical power-law dependence, . A similar power-law dependence can be inferred from the US patent citation data of Ref. Csardi .
3.2 Cumulation Method
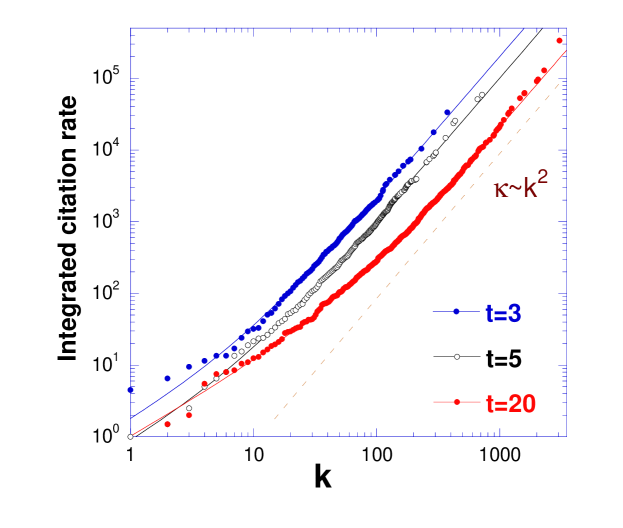
Jeong, Neda, and Barabasi Jeong were the first to measure the growth rate of evolving networks used the cumulation method. This method quickly became the most popular tool to assess the preferential attachment in real networks Eom2008 ; Eom2011 ; Valverde ; Tomassini ; Eisenberg ; Sheridan . It consists in calculation of the kernel where is the total number of citations garnered by a paper by year and is the number of citations accrued by this paper during time window between and where is usually 1 year. The integration is performed over all papers that garnered citations by year . The key assumption behind this scheme is that the fluctuations in are averaged out and the resulting integral is the same as if Eq. 4 were integrated directly over at fixed i.e.,
| (5) |
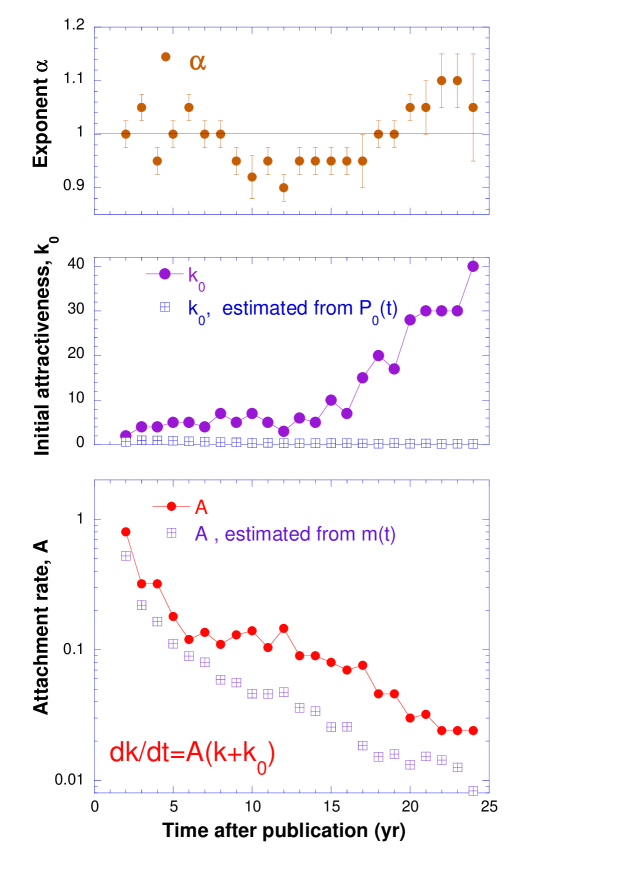
Figure 5 demonstrates application of this method to our data. The fluctuations have been dramatically reduced, as expected. Equation 5 fits well the data for high , while for low the fit is less satisfactory. Figure 6 shows the fitting parameters. We found that the deviation of the exponent from unity is within the experimental uncertainty, . Therefore, to find and we set in our fitting procedure.
Figure 6 shows that the fitting parameters found in such a way are notably different from those found by the averaging method (Fig. 4). Most important - the exponent is close to unity while that found from the averaging method is higher than unity. The initial attractivity is high and increases with time, while that found from the averaging method is close to unity and almost time-independent. The attachment rate exceeds that found from the averaging method, especially at long times. The discrepancy between the two methods calls for some control tool. In what follows we develop such tool and use it to decide which method: averaging or cumulation is more reliable.
3.3 Control Tool
We consider here an additional tool to estimate the microscopic growth parameters of a growing network. We have developed this indirect method to check the internal consistency of the histogram and cumulation methods. This control method is based on two assumptions: (i) the microscopic growth law given by Eq. 4 is valid for all papers including uncited ones, and (ii) the exponent is known. Then, the microscopic parameters and may be estimated from the dynamics of the macroscopic parameters: the mean number of citations , and the fraction of uncited papers .
The mean, , is the average number of citations garnered by a paper during the period between and , in such a way that the age is . The averaging here is performed over all papers. Differentiation with respect to time yields the average number of additional citations garnered by a paper between and , namely, . We average Eq. 4 over all papers and for we find (the last approximation holds because is close to unity). This yields the rate constant
| (6) |
For Eq. 4 reduces to where is the average citation rate of previously uncited papers. The latter can be recast through the fraction of uncited papers as follows, uncited . Equation 6 yields then
| (7) |
We solve Eqs. 6,7 for known and find and . If is found properly the parameters and obtained by this control method shall be consistent with those found directly.
For the histogram (averaging) method, the and found from Eqs. 6,7 are indeed consistent with those found by the direct procedure (Fig. 4). The difference in is within the measurement uncertainty, while a small difference in can be traced to the Jensen’s inequality, for . However, for the cumulation procedure, the and found from Eqs. 6,7 are clearly inconsistent with those found directly (Fig. 5): is substantially lower and is also much smaller than those found directly. This inconsistency calls for a deeper consideration of the validity of the cumulation method as applied to citations.
While the cumulation method works well for noisy continuous data with Gaussian fluctuations, its applicability to citations is problematic. Since the additional citations are discrete and non-negative, their fluctuations around the mean are non-symmetrical and their magnitude is on the order of the mean (see Fig. 2). It appears that the standard numerical integration procedure as implemented, for example, in MATLAB does not work well for discrete, wildly fluctuating data that have non-symmetrical distribution around the mean. The straightforward application of the numerical integration procedure (cumulation) for quantifying dynamics of growing networks is thus ineffective. This method shall be specially tailored for the discrete variables with the non-Gaussian and strongly skewed fluctuation spectrum.
We conclude that the microscopic parameters of the growing citation network obtained by the averaging (histogram) method are most reliable.
4 The effect of the exponential growth of publications on citation dynamics
Most theoretical studies consider networks that grow linearly in time. In fact, they define a ”network time” in such a way that new nodes are added to network at constant rate. It should be noted that citation networks grow exponentially with time. In what follows we define the network time for the citation network and recast our results in terms of the network time.
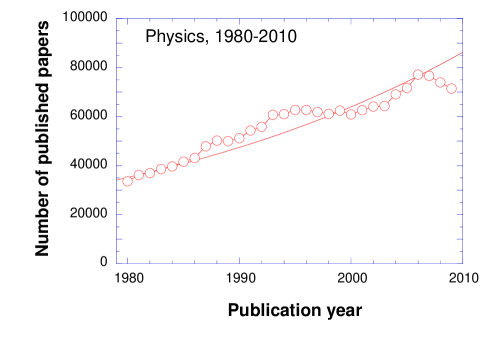
Figure 7 shows the annual growth of the number of original research papers and reviews in 82 leading Physical journals as covered by the ISI Thomson-Reuters Web of Science (excluding editorials, conference proceedings, etc.). The network growth is close to exponential, hence the difference between the physical time and network time is essential.
We define the ”network year” in such a way that the number of papers published during this time interval is equal to the number of papers published in 1984. (This is approximately equivalent to time rescaling, where is the physical time.) To determine microscopic parameters of the citation dynamics we use Eq. 4 where year is replaced by . The data shown in Fig. 3 are unaffected by this transformation although now they refer to network time which is different from physical time. The parameters and remain the same. The new rate constant is determined from the slope of the dependences shown in Fig. 3 divided by instead of .
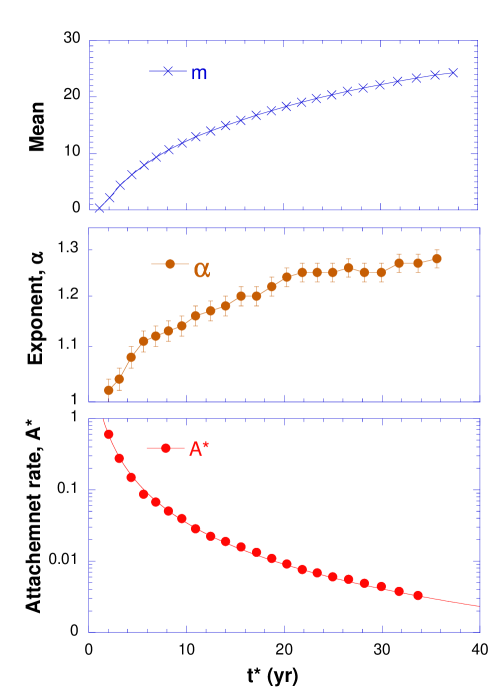
Figure 8 shows some citation parameters in this time frame. The saturation exhibited by and is clearly visible. This should be compared to Figs.1, 4a where the growth of and is more close to logarithmical. The attachment rate turns out to be almost the same as the dependence. This coincidence may be occasional.
We conclude that the growth of the citation network follows Eq. 4 with time-independent , time-dependent exponent which gradually increases from 1 to 1.28, and the rate constant that decays with time as . This conclusion remains the same if we replace the physical time by the network time. By the way, the studies of US patent-to-patent citations by the histogram method yielded similar attachment exponent Valverde ; Csardi ; Sheridan . All this indicates that the citation networks experience the autocatalytic growth with the superlinear attachment kernel. Although the nonlinearity is weak, it leads to far-reaching consequences which we analyze below.
5 Divergence of the citation lifetime - dynamical phase transition towards immortality
In what follows we analyze the consequences of the nonlinear growth mechanism of the citation network. In particular, we demonstrate that the nonlinearity is responsible for the enormous spread of citation lifetimes of scientific papers. To show this we consider citation dynamics of individual papers and distinguish between the initial period of 2-3 years when a paper makes an immediate impact and the subsequent period when the citation dynamics of this paper to some extent is built on its initial success. The time dependence of the total citation count of a paper during this later period can be crudely estimated by integrating Eq. 4 with respect to time as if were a continuous variable. In what follows we focus only on the papers with (moderately- and highly-cited papers), in such a way that the term in Eq. 4 can be neglected. We also neglect for a moment the stochastic component of . Assuming time-independent exponent we integrate Eq. 4 and find
| (8) |
Here, stands for the number of citations garnered by a paper during initial period (it shouldn’t be mixed with that appears in Eq. 4), and . For Eq. 8 reduces to a more transparent form
| (9) |
Consider two cases.
-
1.
-linear growth. The dependence can be factorized, , where the sets the scale and the factor sets the time dependence of the citation count. Citation dynamics of all papers should follow the universal dependence which is independent of .
-
2.
-nonlinear growth mechanism. In this case Eq. 9 can not be factorized and both the scale and the time dependence of the total citation count depend on .
Basing on these considerations we provide the experimental evidence for the nonlinear growth by analyzing various measures of the paper longevity. One of them is a nonparametric measure introduced by Redner Redner , namely, ”citation age” . It is defined with respect to the paper age which is the number of years that passed after its publication. The citation age of the paper is nothing else but the mean age of the papers that cite it,
| (10) |
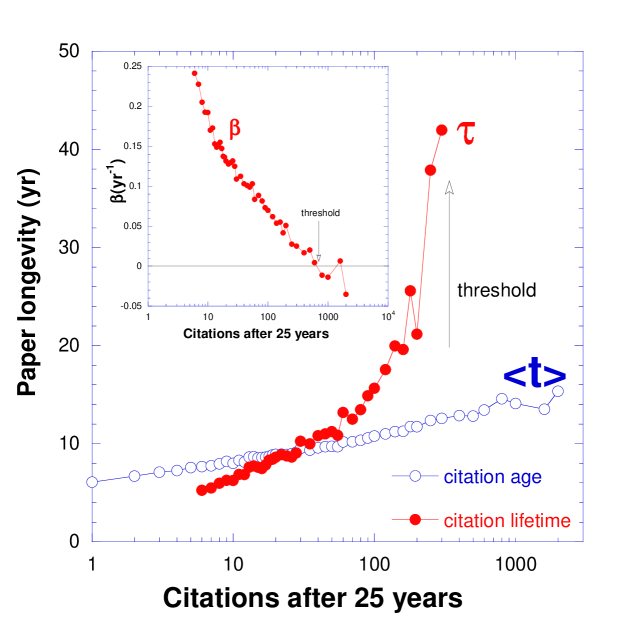
In the extreme case when the citations grow linearly in time, . Citation age exceeding indicates accelerating growth while citation age below indicates some kind of saturation. Figure 9 shows citation age of the papers for years. We observe that increases with the number of citations as expected for the nonlinear growth mechanism, and eventually achieves the critical value of years. This means that there is appreciable number of papers whose citation dynamics didn’t come to saturation and they are actively cited even 25 years after publication!
Another way to illustrate such exceptional behavior is to approximate Eq. 8 by the exponential dependence
| (11) |
where is some scale factor, is a (small) delay between the publication of the paper and the onset of citations, and is the rate. The latter is negative when accelerates with time and positive when comes to saturation. In this latter case has the meaning of citation lifetime. It is related to citation age (Eq. 10) as follows: for the exponential dynamics and in the long-time limit .
We measured for all papers in our dataset, approximated it using Eq. 11 and found microscopic parameters and . Since these microscopic parameters strongly fluctuate, we binned all data into 40 logarithmically-spaced bins and considered the average over the papers in each bin. The results are shown in Fig. 9. The rate changes sign and becomes positive for highly-cited papers indicating accelerating citation dynamics. This change of sign occurs at the same threshold where citation age becomes equal to (Eq. 10). The citation lifetime is years for low-cited papers, for moderately- and highly-cited papers citation lifetime increases and even diverges, as it is predicted by Eq. 8.
The divergence of the citation lifetime is a direct consequence of the nonlinear autocatalytic growth and it demonstrates the tendency of citation network to develop a few hubs that attract the majority of citations. In the cumulative citation distribution these hubs appear as ”runaways” Golosovsky_EPL . These most highly-cited papers have all chances to achieve infinite citation lifetime. This observation extends the well-known adage ”the rich get richer” to ”the rich live longer”.
6 Discussion
6.1 Why is the growth mechanism of citation networks so close to linear?
When viewed from the perspective of network dynamics, the preferential attachment mechanism does not favor any particular value of the attachment exponent. From such perspective the ubiquity of linear or nearly linear preferential attachment is enigmatic. However, if we consider network dynamics from the perspective of a single node, the ubiquity of nearly linear preferential attachment appears naturally.
Indeed the linear preferential attachment in the context of citations means that citation dynamics of the papers published in the same year has the same functional dependence and differs only in scale (we totally neglect here the stochastic character of the citation process). The difference between total number of citations of these papers is due to initial conditions, namely the number of citations that the papers garnered during first 2-3 years after publication. This is related to the number of readers which is determined by the journal’s circulation. Since the majority of readers are graduate students who tend to copy once prepared reference list in all their publications, the citation lifetime of a paper that some Ph.D. student came across, is the duration of his Ph. D. stay, namely 3-5 years. Therefore, the initial impact of a paper on research groups that undertook to cite it, usually continues for 1-2 generations of the Ph. D. students, namely for 6-10 years (see Fig. 9).
If the above scenario were true for all papers, then the growth of the citation network would follow linear preferential attachment and the citation lifetime of all papers would be more or less the same. Figure 9 shows that while the citation lifetime of the vast majority of papers is indeed 6-10 years, there are quite a few papers that have much longer lifetime. We believe that these are the papers that induce ”chain” reaction or cascade. Namely, the researchers can pick up such paper not by reading the journal where it was published but through the impact of this paper on other research groups. In this case the paper starts it citation career in a new research group and its citation lifetime increases by another 6-10 years. Such process of spreading the ideas is similar to epidemiological process Goffman ; Bettencourt and to the redirection (copying) mechanism copying ; Simkin . It seems that the papers whose impact propagates through the cascade process are responsible for the nonlinear growth of the citation network. The fraction of such papers in the whole pool of papers determines the degree of deviation of the attachment exponent from unity. The fact that this deviation is small, indicates that only a small fraction of papers ignites the chain reaction or cascade. Our measurements Golosovsky_PRL indicate that these are the papers that garnered at least citations at some moment in their citation career.
This cascade mechanism is specific for the citation network and it does not necessarily occurs in other networks. Therefore, the growth mechanism of the complex networks other than citation network (Table I) can still follow linear preferential attachment.
7 Conclusions
The dynamics of citation network is driven by the nonlinear autocatalytic growth with the attachment exponent . The small but appreciable deviation of the growth process from linearity leads to a dramatic dynamical phase transition: the papers that exceed at some stage a certain number of citations become practically immortal: their citation lifetime diverges. In the language of epidemiology these papers become endemic.
8 Acknowledgments
We are grateful to Filippo Radicchi, Alexander Petersen, Oleg Yordanov, and Andrea Scharnhorst for fruitful discussions.
References
- (1) D. de Solla Price, ”A General Theory of Bibliometric and Other Cumulative Advantage Processes”, J. Am. Soc. Inf. Sci. 27, 292 (1976).
- (2) R. Albert and A.L. Barabasi, ”Statistical mechanics of complex networks”,Rev. Mod. Phys. 74, 47 (2002).
- (3) M. E. J. Newman, ”The structure and function of complex networks”, SIAM review 45, 167 (2003).
- (4) S. Redner ”Citation Statistics from 110 Years of Physical Review”, Physics Today 58, 49 (2005).
- (5) M.J.Stringer, M. Sales-Pardo, L.A.N. Amaral ”Effectiveness of Journal Ranking Schemes as a Tool for Locating Information”. PLoS ONE 3, e1683 (2008).
- (6) F.Radicchi, S. Fortunato, C. Castellano, ”Universality of citation distributions: toward an objective measure of scientific impact” Proc. Natl. Acad. Sci. USA 105, 17268 (2008).
- (7) A.M. Petersen, F.Wang, H.E. Stanley ”Methods for measuring the citations and productivity of scientists across time and discipline”, Phys. Rev. E 81, 036114 (2010).
- (8) M. Golosovsky and S.Solomon, ”Runaway events dominate the heavy tail of citation distributions”, Eur. Phys. J 205, 303 (2012).
- (9) P. L. Krapivsky and S. Redner, ”Organization of growing random networks”, Phys. Rev. E 63, 066123(2001).
- (10) S.N. Dorogovtsev and J.F.F. Mendes, ”Evolution of networks”, Adv. Phys. 51, 1079 (2002).
- (11) O.Malcai, O. Biham, S. Solomon, ”Power-law distributions and Le vy-stable intermittent fluctuations in stochastic systems of many autocatalytic elements”, Phys. Rev. E 60, 1299 (1998).
- (12) A. Blank, S. Solomon, ”Power laws in cities population, financial markets and internet sites (scaling in systems with a variable number of components)”, Physica A 287, 279 (2000).
- (13) H. Jeong, Z. Neda, and A.L. Barabasi,”Measuring preferential attachment in evolving networks”, Europhys. Lett. 61, 567 (2003).
- (14) Y.-H. Eom, C. Jeon, H. Jeong, and B. Kahng, ”Evolution of weighted scale-free networks in empirical data”, Phys. Rev. E 77, 056105 (2008).
- (15) Y.-H. Eom and S. Fortunato, ”Characterizing and Modeling Citation Dynamics”, PLoS ONE 6, e24926 (2011).
- (16) S. Valverde, R. V. Sol , M. A. Bedau,and N. Packard, ”Topology and evolution of technology innovation networks”, Phys. Rev. E 76, 056118 (2007).
- (17) G. Csardi, K.J. Strandburg, L. Zalanyi, J.Tobochnik, and P. Erdi, Physica A 374, 783 (2007).
- (18) M. Wang, G. Yu, and D. Yu, ”Measuring the preferential attachment mechanism in citation networks ”, Physica A 387, 4692 (2008).
- (19) M. Tomassini, L. Luthi, ”Empirical analysis of the evolution of a scientific collaboration network”, Physica A 385, 750 (2007).
- (20) M.E.J. Newman, ”Clustering and preferential attachment in growing networks”, Phys. Rev. E 64, 025102 (2001).
- (21) A. Capocci, V.D.P. Servedio, F. Colaiori, L.S. Buriol, D. Donato, S. Leonardi, G. Caldarelli, ”Preferential attachment in the growth of social networks: The internet encyclopedia Wikipedia”, Phys. Rev. E 74, 036116 (2006).
- (22) A. Herdagdelen, E. Aygun and H. Bingol, ”A formal treatment of generalized preferential attachment and its empirical validation”, EPL 78 60007 (2007).
- (23) E. Eisenberg and E. Y. Levanon, ”Preferential Attachment in the Protein Network Evolution”, Phys. Rev. Lett. 91 , 138701 (2003).
- (24) P. Sheridan, Y. Yagahara, H. Shimodaira,”Measuring preferential attachment in growing networks with missing-timelines using Markov chain Monte Carlo”, Physica A 391 (2012) 5031.
- (25) C.P. Massen and J.P.K. Doye, ”A self-consistent approach to measure preferential attachment in networks and its application to an inherent structure network”, Physica A 377, 351 (2007).
- (26) R.Itzhack, L. Muchnik, T. Erez, L. Tsaban, J. Goldenberg, S. Solomon, Y. Louzoun, ”Empirical extraction of mechanisms underlying real world network generation”, Physica A 389, 5308 (2010).
- (27) F. Radicchi and C. Castellano, ”A Reverse Engineering Approach to the Suppression of Citation Biases Reveals Universal Properties of Citation Distributions”, PLoS ONE 7, e33833 (2012).
- (28) M. Golosovsky and S.Solomon, ”Stochastic Dynamical Model of a Growing Citation Network Based on a Self-Exciting Point Process”, Phys. Rev. Lett. 109, 098701 (2012).
- (29) Consider a cohort of papers published in the same year. After a couple of years, when the general interest to this cohort already decayed, the annual number of citations gained by previously uncited papers is either 0 or 1. Therefore, the mean annual number of additional citations gained by previously uncited papers is where is the number of uncited papers and is the number of uncited papers that got their first citation during recent year . If the total number of papers in the dataset is , then where is the fraction of uncited papers.
- (30) P. L. Krapivsky and S. Redner, ”Network growth by copying”, Phys. Rev. E, 71, 036118 (2005).
- (31) W. Goffman and V.A. Newill, ”Generalization of epidemic theory: An application to the transmission of ideas”, Nature 4953, 225 (1964).
- (32) L.M.A. Bettencourt, A. Cintron-Arias, D.I. Kaiser, C. Castillo-Chavez, ”The power of a good idea: Quantitative modeling of the spread of ideas from epidemiological models”, Physica A 364, 513 (2006).
- (33) M.V. Simkin and V.P. Roychowdhury, ”A mathematical theory of citing”, J. Am. Soc. Information Science and Technology 58, 1661 (2007).