Overview of MHz air shower radio experiments and results
Abstract
In this paper, I present a review of the main results obtained in the last 10 years in the field of radio-detection of cosmic-ray air showers in the MHz range. All results from all experiments cannot be reported here so that I will focus on the results more than on the experiments themselves. Modern experiments started in 2003 with CODALEMA and LOPES. In 2006, small-size autonomous prototypes setup were installed at the Pierre Auger Observatory site, to help the design of the Auger Engineering Radio Array (AERA). We will discuss the principal aspects of the radio data analysis and the determination of the primary cosmic ray characteristics: the arrival direction, the lateral distribution of the electric field, the correlation with the primary energy, the emission mechanisms and the sensitivity to the composition of the cosmic rays.
Keywords:
Cosmic rays, Radio-detection:
95.55.Jz,95.85.Ry,96.50.sd1 Introduction
In 1971, Allan Allan (1971) gave a review of the latest results, at that time, concerning the detection of extensive air showers initiated by high-energy cosmic rays. The initial motivations for studying the radio signal was the possibility to build an array of widely spaced receivers to detect extensive air showers at the highest energies (above 10 EeV), in a cheap way. It was also proposed to use the radio signal in conjonction with a particle array to get additional information on the longitudinal profile, providing valuable constraints on the nature of the primary cosmic ray. Using the data available at that time, Allan concluded that the main signal should be polarized in the direction of the vector , where is the direction of the shower axis and the direction of the geomagnetic field. The mechanism responsible for this specific polarization is the geomagnetic contribution due to the Lorentz force acting on each secondary charged particles, in particular the electrons and positrons. It was predicted that the charge excess contribution should be less important but still detectable, mainly for incoming directions close to the direction of the geomagnetic field. It is also stated that the electric field amplitude extrapolated on the shower axis, over the range 32-55 MHz, is proportional to the primary energy. Finally, for a given event observed by several detectors, the electric field amplitude decreases exponentially with the axis distance. The equation proposed to fully describe the electric field observed by a single detector at a distance of the shower axis is:
| (1) |
in , where is the primary energy, the angle between the shower axis and the geomagnetic field, the zenith angle, the distance between the detector and the shower axis and the attenuation length of the electric field. The lateral distribution function (LDF) proposed by Allan depends on the axis distance leading to an azimuthal invariance of the electric field with respect to the shower axis. This formula was used as a starting point at the beginning of the years 2000 for the design of the CODALEMA Ardouin et al. (2006) and LOPES Falcke et al. (2005) experiments. These first modern experiments were triggered by an array of particle detectors in order to search a posteriori for a radio counterpart to a shower candidate. The next challenge consisted in setting up fully autonomous and independent radio detectors to test the possibility to build a full stand-alone radio array. A first type of such radio array was installed in 2006 at the center of the surface detector (SD) of the Pierre Auger Observatory, in the scope of the Auger Engineering Radio Array (AERA), experiment which finishes its phase 1 in 2012. AERA benefits from the SD and FD (fluorescence detector) reconstructions, providing high-quality super-hybrid events. The LOFAR Corstanje et al. (2011) experiment also detects the radio emission of air showers. The complementary particle detector, LORA Thoudam et al. (2011), helps in triggering and identifying the cosmic rays detected by LOFAR.
We present in this overview the updated results of the field. We will discuss the lateral distribution function, the correlation with the primary energy and we will insist on the current situation concerning the emission mechanisms that can be determined through the polarization of the total electric field.
2 Detection of the electric field emitted by EAS
The secondary electrons and positrons created during the development of the air shower form a pancake-shape particle front moving at the speed of light. The thickness of the shower front is of the order of 1 m on the shower axis, up to m far from the axis. These particles suffer a systematic opposite drift caused by the Lorentz force due to the Earth’s magnetic field generating a coherent emission of electromagnetic waves in the 1-500 MHz range. The amplitude of the resulting macroscopic current and its variation depends on the number of charges particles of the shower and therefore, can provide information on the longitudinal profile. The electric field produced this way is expected to have a polarization following the direction of the Lorentz force, . This mechanism is known as the geomagnetic contribution as discussed in the introduction. Another mechanism is due to the variation of the excess of electrons due to the annihilation of positrons and knock-on electrons, known as the charge-excess contribution. This corresponds to the Askaryan Askaryan (1962) effect in the air, leading to a radially-polarized electric field, also in the MHz domain. It is therefore possible to disentangle these two contributions through the different polarizations of the associated electric fields. Various simulation codes are available, a review is given in this conference, see Huege (to be published). This electric field is usually detected by systems composed of antennas, precise time tagging system (GPS for instance) and the signal is digitized by fast ADCs in order to be able to compute the Fourier spectrum up to some hundreds of MHz. The electric field is filtered in a frequency band above the AM ( MHz) and below the FM (80 MHz). Following the antenna used, the filtering can be done in more restricted bands accordingly to the frequency response of the device used. In general, the electric field is measured in, at least, two horizontal orthogonal polarizations; this permits to reconstruct the polarization angle in the horizontal plane and to check for the underlying emission mechanism.
The two first modern radio experiments, CODALEMA and LOPES, led to many progresses in the understanding of the emission of the electric field by EAS. These experiments detect the EAS initiated by cosmic rays with an energy between and eV and follow the same principle: they use a particle array which triggers the radio array. The particle array for CODALEMA is an array of 17 scintillators and in the case of LOPES, the particle array is the KASCADE-Grande experiment. LOPES is installed close to the city of Karlsruhe which is an electromagnetically noisy environment. The solution adopted by LOPES is to use interferometric technics, using as an input the high-quality information provided by KASCADE-Grande. A digital beam-forming is applied to inter-phase the time series of all LOPES antennas using the arrival direction given by KASCADE-Grande. Then, a cross-calibration procedure is used to estimate the global amplitude of the electric field. For high signal-to-noise ratio events, the electric field can be estimated for each antenna, this permits to compute the LDF of these events. On the contrary, the CODALEMA experiment is installed in the radio observatory of Nançay which is a protected area in the sense that the electromagnetic emissions of the neighbourhood is controlled. This permits to use the data of the radio array of CODALEMA independently of the data of the particle array, once the EAS is clearly identified and validated by the particle array. Each radio detector provides the electric field as a function of time with a high sampling rate (typically 500 Ms/s or 1 Gs/s) so that it’s possible to measure the time of the maximum of the signal.
3 Arrival direction
From the measurements of the electric field by several detectors, it is possible, in the very same way than with a particle array, to reconstruct the incoming direction of the EAS. Provided the ground coordinates of at least three non-aligned detectors and the time of transit of the electromagnetic wave of the shower in these detectors has been measured, we can triangulate to estimate and , the zenith and azimuth angles of the shower, respectively. For higher multiplicity events, we can compute the radius of curvature of the electromagnetic wave assuming a spherical front. The time resolution of GPS receivers allow to reach an angular resolution of the order of a fraction of degree, even for low-multiplicity events. Artificial sources are commonly used to time-calibrate the radio detectors. For instance, the detection of airplane transients represents a gold mine because it’s possible to inter-calibrate the detectors, to study the antenna lobe sensitivity and also to compute the angular resolution. It has been proven that this angular resolution can reach , even for a small number of detectors spaced by 140 m only Revenu (2011). Octocopter flights have been used for instance in LOFAR, LOPES and AERA. The arrival direction estimation is important at two levels: it permits to identify – and suppress – anthropic events (mainly coming from the horizon, apart for airplanes) and to identify cosmic ray events by a comparison with the arrival direction given by the particle array. If the directions agree within a certain angle (typically less than ) and the time of the shower is the same within a certain time window (less than ns for instance), then the event is seen by both arrays.
4 Lateral distribution function
The LDF describes the electric field amplitude as a function of the distance to the shower axis. The starting point for the function describing the LDF is an exponential, as first proposed by Allan. Most of the radio-detected events are well described by an exponential profile (see Eq. 1). Nevertheless, a non-negligible fraction of events (of the order of 20%) present a flattening for detectors close to the shower axis, in particular for inclined showers, as reported by the LOPES collaboration in Apel et al. (2010). The same observation holds for the CODALEMA data and the LOFAR collaborations. A very nice example of such event is given in Corstanje et al. (2011). This event was detected by 5 LOFAR stations corresponding to more than 200 independent measurements of the electric field at different axis distances; the radio pulse power as a function of axis distance is presented in Figure 1. The flattening of the profile is very clear for antennas located at less than 100 m from the shower axis.
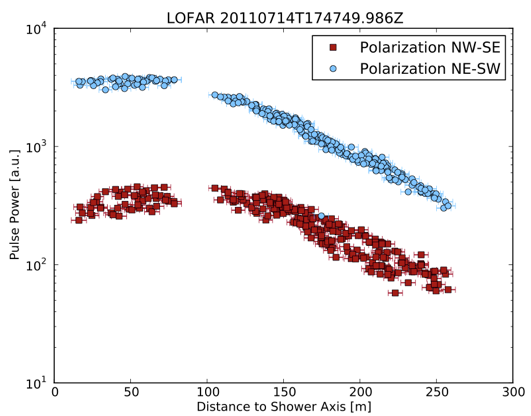
The flattening of the electric field profiles can be understood as the effect of the air refractive index. At the sea level, and this value decreases with increasing altitude; the consideration of realistic values of the air refractive index in the simulations permits to reproduce events with a flat profile close to the shower axis which is the consequence of a Cerenkov ring (see Huege (to be published), Huege et al. (to be published), Marin (to be published), Carvalho Jr (to be published)). One should be cautious when using the usual 1D exponential profile, in particular when considering the electric field measurements close to the shower axis. Moreover, the electric field should not exhibit azimuthal invariance with respect to the shower axis. This property is predicted by all the simulation codes and has also been observed in the CODALEMA data Marin and the CODALEMA Collaboration (2011). More complicated 2D LDFs should be used in the future analyses but at the time of this conference, no analysis using 2D LDF has been presented. The minimization of the based on the model gives the core position through the axis distance where is the shower axis and is the vector between the core position and the position of antenna . The minimization also provides the attenuation length and the on-axis signal . The on-axis signal can be defined as the actual electric field if the amplitudes have properly been deconvoluted for the antenna response (arrival direction and frequency gain). This deconvolution is mandatory in order to be able to study the correlation between electric field and energy of the primary cosmic ray. Using simulations, it has been demonstrated that the shower-to-shower fluctuations are minimized when considering the electric field at a distance of m of the shower axis. It could be therefore interesting to consider this value instead of the on-axis electric field Palmieri and Collaboration (to be published).
5 Correlation with the primary energy
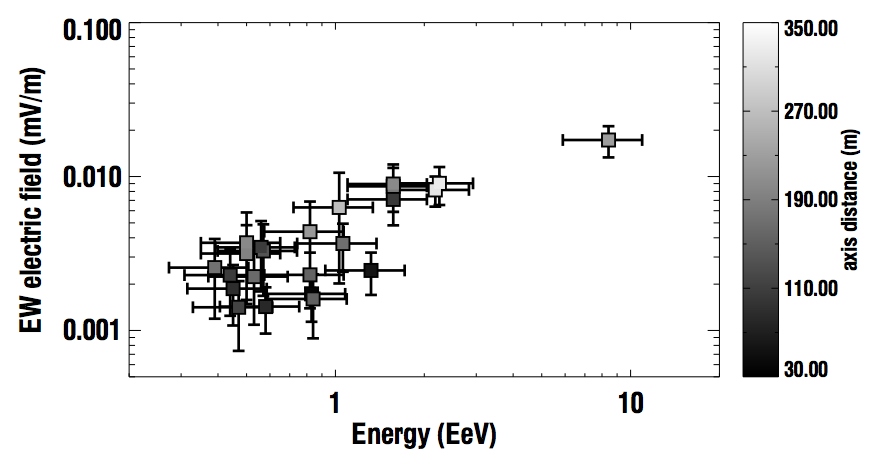
Hybrid arrays usually use the particle detector array for the energy estimation. As stated before, the LOPES experiment relies on the KASCADE-Grande reconstruction, the CODALEMA experiment uses the scintillator array and the AERA experiment depends on the Auger SD and/or FD reconstruction. Allan proposed a linear relation between the on-axis electric field and the primary energy. This relation is confirmed by the LOPES 30 data, using the pulse height in the east-west (EW) polarization: (see Horneffer et al. (2008)). More recently, the AERA experiment reported the correlation between the electric field and the primary energy determined by the Auger SD and FD. The signal is recorded in the three polarizations EW, north-south (NS) and vertical (V). The AERA radio detectors have been fully calibrated and the measurements are deconvoluted to estimate the 3D electric field vector Abreu et al. (2012). Then the Hilbert envelope is computed for the three directions and the total signal strength is defined as the maximum of the 3D Hilbert envelope Glaser (to be published). The electric field is finally interpolated at 110 m of the shower axis, where the energy resolution is maximum, and the correlation with the primary energy is compatible with a linear relation. The AERA energy correlation plot will be published in a forthcoming paper. The Pierre Auger collaboration also reported a positive correlation at 99.99% CL between the on-axis electric field and the primary energy, obtained with the (pre-AERA) RAuger setup, as can be seen in Figure 2 extracted from The Pierre Auger Collaboration et al. (2012).
It has been reported during this conference the quasi-linear correlation of the CODALEMA data with the primary energy using raw data (not deconvoluted for the antenna response) Lautridou et al. (to be published). Due to the different estimators used in the community (either the on-axis electric field or its value at m), one should be cautious when comparing the slopes of the correlations reported by several experiments.
6 Emission mechanisms and polarization
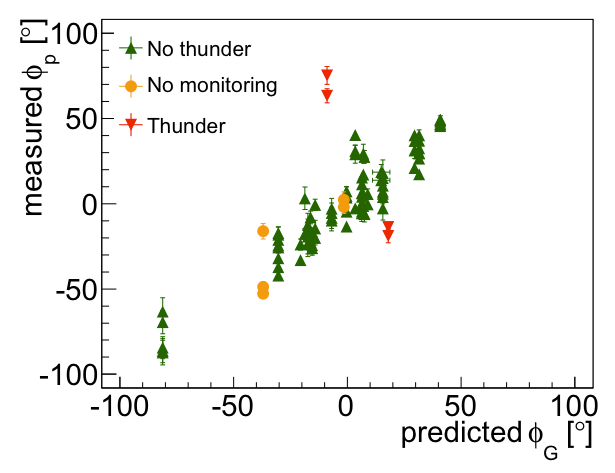
The geomagnetic contribution to the total electric field is dominant, as stated in the 1960s and confirmed with much more statistics and better data some years ago by CODALEMA Ardouin et al. (2009), Revenu (2009) and LOPES Horneffer et al. (2008). In the southern hemisphere, the RAuger prototype reported that the arrival directions of the detected air showers were in good agreement with a effect. Using the AERA data, we studied the correlation in the horizontal plane of the expected polarization angle of the geomagnetically-induced electric field with the measured polarization angle . The correlation is excellent, as can be seen in Figure 3 (extracted from Schoorlemmer and the Pierre Auger Collaboration (2011)).
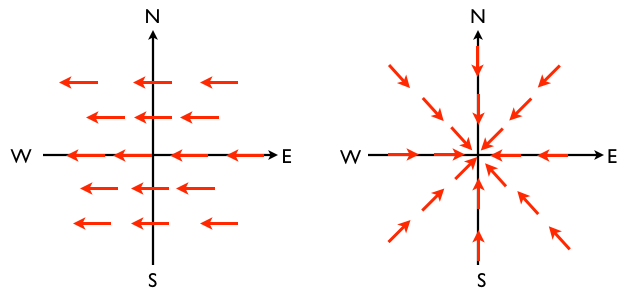
As discussed in the introduction, the electrons in excess relatively to the positrons implies a net electric field whose polarization pattern is radial in the shower transverse plane. At first order, the total electric field is oriented following but it is possible to search for second order effect, that can be revealed either by a change in the polarization angle or by an enhanced electric field amplitude due to constructive interferences. Figure 4 presents the polarization patterns for a vertical shower in a geomagnetic field with a NS component.
In the last year, there have been two different approaches to detect such an additional contribution, compatible with the charge-excess contribution.
6.1 Evidence for a radial contribution through polarization angle studies
The polarization angle of the total electric field is estimated using the measurements along the EW direction (-axis) and the NS direction (-axis). To detect an electric field contribution incompatible with the geomagnetic mechanism (i.e. having an orientation not aligned along ), we first construct an observable characterizing the deviation from a pure geomagnetic electric field, for each radio detector. For that, we first rotate the coordinate system so that the new -axis, , is aligned along the direction of projected in the horizontal plane and the new -axis, , is perpendicular to . quantifies the relative signal strength in the direction perpendicular to the geomagnetic expectation. By construction, a pure geomagnetic electric field leads to and an electric field with no geomagnetic component has . For a given set of detected showers, we can compute for the data (we used the data of a pre-AERA prototype) and compute the same factor for the same simulated showers (same geometry and detector array). The simulations used here are MGMR de Vries et al. (2010) and REAS3 Ludwig and Huege (2010) and were run using realistic showers (having an excess of electrons) and for showers forced to have the same number of electrons and positrons. The results showed that the correlation is much stronger when including the charge-excess mechanism in the shower. Figure 5 presents the correlation between and with the charge-excess taken into account for the simulation code MGMR for example.
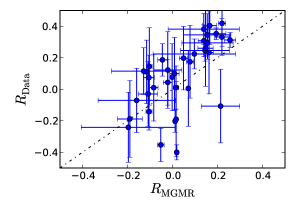
Quantitatively, the reduced decreases from 6.4 (4.7) to 2.7 (3.0) when taking into account the charge-excess in the simulated showers with REAS3 (MGMR). The conclusion of these results is that the electric field emitted by the showers detected by this pre-AERA prototype is in better agreement with the simulations when the charge-excess mechanism is included in the simulation codes. The relative influence of both prototypes depends strongly on the shower arrival direction and on the relative position of the observer with respect to the shower core. More details on this analysis can be found in Abreu et al. (2011). The same analysis is currently performed using the AERA data and more refined simulation codes.
6.2 Evidence for a radial contribution through core shift
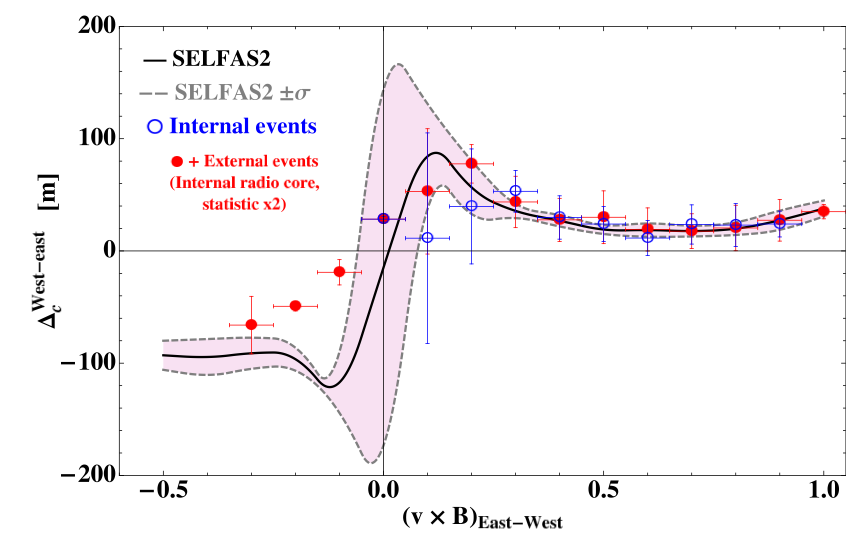
The CODALEMA collaboration reported in Marin and the CODALEMA Collaboration (2011) the measurement of a shift toward the east of the shower core position estimated using the radio data (the radio core) with respect to the shower core estimated using the particle array data (the particle core). The particle core position is obtained using the Nishimura-Kamata-Greisen (NKG) lateral distribution (see Ardouin et al. (2009) for the details). The radio core position is obtained by fitting an exponential function of the type where the core coordinates are hidden in the axis distance . The shift to the east is characterized by the quantity . This shift is interpreted as the result of the superposition of the geomagnetic and charge-excess electric field components, as presented in Figure 4. For this example of a vertical shower, an observer located at the east of the shower core will observe a constructive superposition of the two components of the electric field, contrary to an observer located at the west of the shower core. The radio core will then be reconstructed, in this example, to the east of the actual shower core, defined as the intersection of the shower axis with the ground. The shift strongly depends on the incoming direction through the geomagnetic component. It is therefore interesting to study the shift as a function of the EW component of (because CODALEMA measures only the EW polarization). To check the influence of the charge-excess, simulations were run (using the code SELFAS2 Marin and Revenu (2012)) with and without the charge-excess mechanism. With no charge-excess, no core shift is observed. Therefore, the core shift is an evidence for the charge-excess contribution. For the selected CODALEMA data set, the dependence of with is presented in Figure 6 and compared with expectations from simulations with SELFAS2, ran on showers having the same characteristics than the selected showers detected by CODALEMA.
In the last two years, there have been two evidences of a non-geomagnetic contribution to the total electric field. The additional contribution appears to be radially polarized in the transverse shower plane, as it is the case for the charge-excess contribution. More data on a wider energy range will be needed to confirm if this contribution can be associated unambiguously to the charge-excess contribution (Askaryn affect in the air). The AERA experiment should be able to study in great details this contribution.
7 Sensitivity of the radio signal to the nature of the primary
The accurate determination shower by shower of the composition of the cosmic rays at ultra-high energies is the next challenge to be taken up. Since some years, using simulations, the radio signal is expected to be correlated to the nature of the primary cosmic ray (see Huege et al. (2008), Palmieri and Collaboration (to be published)). From simulations, it is possible to estimate the value of the atmospheric depth of maximum development of showers , using the LDF of radio profiles. The LOPES collaboration report an uncertainty on of the order of . This large value is dominated by the very noisy environment in Karlsruhe and one could expect (using simulations) a much better resolution — around — in quiet sites. For comparison, the Auger FD has a resolution of Facal and the Pierre Auger Collaboration (2011). We can expect, by combining data from radio and the SD, to reach a resolution on close to that of the FD. Another possible method to constrain the nature of the primary has been presented during this conference in Grebe and the Pierre Auger Collaboration (to be published). The principle of this method is to study the slope (spectral index) of the frequency spectra between 40 and 60 MHz. Simulations show that this spectral index depends not only on the shower geometry but also on the nature of the primary cosmic ray, at a level of 10% according to MGMR. The dependence on the shower geometry has been confirmed on the AERA data and the possibily to constrain the composition with this method is still under study.
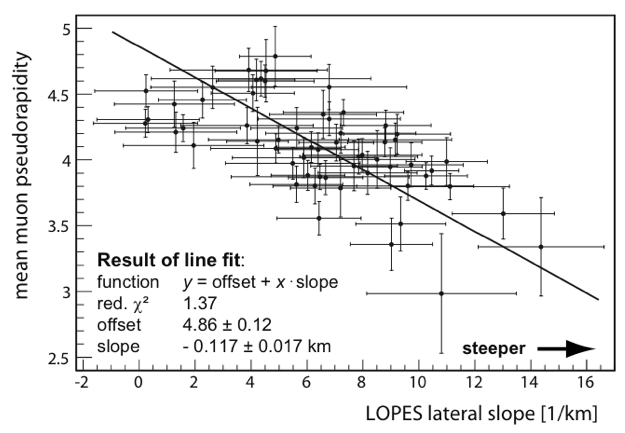
Experimentally, the LOPES collaboration reported Apel et al. (2012) a first evidence, at a level of , of the sensitivity of the radio signal to the nature of the primary cosmic ray through the longitudinal profile development. The slope of the radio lateral distribution (using an exponential profile with an estimation of the amplitude at an axis distance of 100 m) is correlated to the mean muon pseudorapidity which is in turn correlated to the shower development: the pseudorapidity is small (large) when the muons are produced at low (high) atmospheric heights. The slope is defined as the factor in the lateral distribution function: , where is the electric field amplitude expressed in in the band MHz and is the axis distance. Figure 7 shows this correlation using a selection of 59 events.
8 Conclusion
The most recent and important result of the field is the evidence for a secondary electric field, radially polarized with respect to the shower transverse plane. This electric field could well be the contribution of electrons in excess in the shower, known as the Askaryan effect in the air. The confirmation of such observation and its quantification would be a major advance in the understanding of the emission processes of electric field in air showers. The radio signal, supposed to be correlated to the longitudinal profile of the shower, is very promising in the estimation of the composition of ultra-high energy cosmic rays. The AERA experiment, located at the north-west of the Auger SD, it installed at an ideal site because showers can be detected by many detectors: the Infill Auger SD, the regular Auger SD, the regular Auger FD, AMIGA (dedicated to the muonic contents of the shower, Abreu et al. (2011)) and HEAT Abreu et al. (2011) which permits to detect the fluorescence light at higher elevation angles corresponding to lower energy showers. All these detectors will study in great details the showers in the energy range to , providing high-quality data to study the transition from a galactic to an extra-galactic origin of cosmic rays. The phase 2 of AERA, providing a total of 161 stations spread over 20 km2 is starting in March 2013.
References
- Allan (1971) H. R. Allan, Progress in elementary particle and cosmic ray physics, North Holland, 1971.
- Ardouin et al. (2006) D. Ardouin, et al., Astropart. Phys. 26, 341 (2006).
- Falcke et al. (2005) H. Falcke, et al., Nature 435, 313 (2005).
- Corstanje et al. (2011) A. Corstanje, M. d. Akker, L. Bahren, H. Falcke, W. Frieswijk, et al. (2011), arXiv:1109.5805.
- Thoudam et al. (2011) S. Thoudam, G. van Aar, M. van den Akker, L. Bahren, A. Corstanje, et al., Astrophys.Space Sci.Trans. 7, 195–199 (2011), arXiv:1102.0946.
- Askaryan (1962) G. Askaryan, J. Exp. Theor. Phy. 21, 658 (1962).
- Huege (to be published) T. Huege, “Theory and simulations of air shower radio emission,” in Proceedings of the ARENA 2012 workshop (Erlangen, Germany), AIP Conference Proceedings, to be published.
- Revenu (2011) B. Revenu, “Autonomous detection and analysis of radio emission from air showers at the Pierre Auger Observatory,” in proceedings of the 32th ICRC, Beijing, China, ICRC, 2011.
- Apel et al. (2010) W. Apel, et al., Astropart.Phys. 32, 294–303 (2010), arXiv:0910.4866.
- Huege et al. (to be published) T. Huege, M. Ludwig, and C. James, “Simulating radio emission from air showers with CoREAS,” in Proceedings of the ARENA 2012 workshop (Erlangen, Germany), AIP Conference Proceedings, to be published.
- Marin (to be published) V. Marin, “SELFAS2 : radio emission from cosmic ray air showers. Effect of realistic air refractive index,” in Proceedings of the ARENA 2012 workshop (Erlangen, Germany), AIP Conference Proceedings, to be published.
- Carvalho Jr (to be published) W. R. Carvalho Jr, “Ultra High Frequency Geomagnetic Radiation from Extensive Air Showers,” in Proceedings of the ARENA 2012 workshop (Erlangen, Germany), AIP Conference Proceedings, to be published.
- Marin and the CODALEMA Collaboration (2011) V. Marin, and the CODALEMA Collaboration, “Charge excess signature in the CODALEMA data. Interpretation with SELFAS2,” in proceedings of the 32th ICRC, Beijing, China, ICRC, 2011.
- Palmieri and Collaboration (to be published) N. Palmieri, and T. L. Collaboration, “Determination of energy and Xmax using LOPES LDF,” in Proceedings of the ARENA 2012 workshop (Erlangen, Germany), AIP Conference Proceedings, to be published.
- Horneffer et al. (2008) A. Horneffer, W. D. Apel, J. C. Arteaga, and et al., “Primary Particle Energy Calibration of the EAS Radio Pulse Height,” in International Cosmic Ray Conference, 2008, vol. 4 of International Cosmic Ray Conference, pp. 83–86.
- Abreu et al. (2012) P. Abreu, et al., JINST 7, P10011 (2012), arXiv:1209.3840.
- Glaser (to be published) C. Glaser, “Energy Estimation for Cosmic Rays Measured with the Auger Engineering Radio Array,” in Proceedings of the ARENA 2012 workshop (Erlangen, Germany), AIP Conference Proceedings, to be published.
- The Pierre Auger Collaboration et al. (2012) The Pierre Auger Collaboration, S. Acounis, D. Charrier, T. Garçon, and C. Rivière, Journal of Instrumentation 7, P11023 (2012).
- Lautridou et al. (to be published) P. Lautridou, et al., “Some possible interpretations from data of the CODALEMA experiment,” in Proceedings of the ARENA 2012 workshop (Erlangen, Germany), AIP Conference Proceedings, to be published.
- Ardouin et al. (2009) D. Ardouin, A. Belletoile, C. Berat, D. Breton, D. Charrier, et al., Astropart.Phys. 31, 192–200 (2009), arXiv:0901.4502.
- Revenu (2009) B. Revenu, “Evidence for a geomagnetic effect in the CODALEMA radio data,” in proceedings of the 31st ICRC, Lodz, Poland, 2009, arXiv:0906.2832.
- Schoorlemmer and the Pierre Auger Collaboration (2011) H. Schoorlemmer, and the Pierre Auger Collaboration, “Cosmic rays detected with the Auger Engineering Radio Array,” in proceedings of the 13th ICATPP conference, 2011.
- de Vries et al. (2010) K. de Vries, et al., Astropart. Phys. 34, 267 (2010).
- Ludwig and Huege (2010) M. Ludwig, and T. Huege, Astropart. Phys. 34, 438–446 (2010).
- Abreu et al. (2011) P. Abreu, et al., “The Pierre Auger Observatory V: Enhancements,” in proceedings of the 32nd ICRC, Beijing, China, 2011, arXiv:1107.4807.
- Marin and Revenu (2012) V. Marin, and B. Revenu, Astropart.Phys. 35, 733–741 (2012), %****␣arena_revenu.bbl␣Line␣125␣****arXiv:1203.5248.
- Huege et al. (2008) T. Huege, R. Ulrich, and R. Engel, Astroparticle Physics 30, 96 – 104 (2008), ISSN 0927-6505.
- Facal and the Pierre Auger Collaboration (2011) P. Facal, and the Pierre Auger Collaboration, “The distribution of shower maxima of UHECR air showers,” in proceedings of the 32nd ICRC, Beijing, China, 2011.
- Grebe and the Pierre Auger Collaboration (to be published) S. Grebe, and the Pierre Auger Collaboration, “Spectral index analysis of the data from the Auger Engineering Radio Array,” in Proceedings of the ARENA 2012 workshop (Erlangen, Germany), AIP Conference Proceedings, to be published.
- Apel et al. (2012) W. D. Apel, et al., Phys. Rev. D. 85, arXiv:1203.3971 (2012).