Department of Physics, University of Central Florida, Orlando, Florida 32816, USA
Department of Physics, Virginia Tech, Blacksburg VA 24061, USA
Department of Chemistry Biochemistry, UCSD, La Jolla, California 92093, USA
Department of Condensed Matter Physics, Weizmann Institute of Science, Rehovot 76100, Israel
Institute for Quantum Computing, University of Waterloo, Waterloo, Ontario, Canada, N2L 3G1
Molecular magnets Macroscopic quantum phenomena in magnetic systems High-pressure apparatus
The effect of uniaxial pressure on the magnetic anisotropy of the Mn12-Ac single-molecule magnet
Abstract
We study the effect of uniaxial pressure on the magnetic hysteresis loops of the single-molecule magnet Mn12-Ac. We find that the application of pressure along the easy axis increases the fields at which quantum tunneling of magnetization occurs. The observations are attributed to an increase in the molecule’s magnetic anisotropy constant of 0.142(1)/kbar. The increase in produces a small, but measurable increase in the effective energy barrier for magnetization reversal. Density-functional theory calculations also predict an increase in the barrier with applied pressure.
pacs:
75.50.Xxpacs:
75.45.+jpacs:
07.35.+k1 Introduction
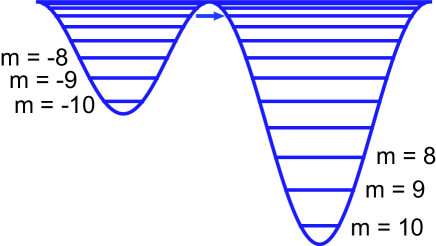
Single-molecule magnets (SMMs) are fascinating systems in which each molecule behaves as a single rigid, high-spin object. Most SMMs have a large magnetomolecular anisotropy that impels the spin to point along a particular axis, the so-called easy axis. Thus, the spin’s energy landscape can be described by a double-well potential, with an energy barrier between “up” and “down” orientations, as shown in Fig. 1.
Much of SMMs’ behavior can be understood from the simple Hamiltonian [1]
| (1) |
Here the first and second terms create the double-well potential. The spin vector minimizes its energy by pointing along or antiparallel to the easy z axis. The constants and give the strength of the anisotropy, producing a classical barrier of height at zero field. The third term is produced by the Zeeman interaction, with . When a field is applied along the z axis, the potential is tilted, making, say, the “up” direction lower in energy than the “down” direction. contains terms that do not commute with and can therefore induce tunneling.
Because SMMs have a finite spin (10), there are magnetic orientation states, , associated with the spin (levels in Fig. 1). As the field along the easy axis is increased, levels in one well move down while levels in the other well move up. At certain fields [1],
| (2) |
where , levels and in opposite wells align, allowing the spin to tunnel between wells and consequently producing a dramatic increase in the rate at which the spins come to equilibrium [2]. This effect, which is manifested by the appearance of steps in the hysteresis loops of most SMMs, has now been seen in hundreds of molecules and some rare-earth ions [1].
Mn12 acetate (henceforth referred to as Mn12) is the most studied SMM. Crystals of Mn12 typically contain two species [3, 4]: a fast relaxing minority species and a slower relaxing majority species. Here we exclusively study the latter, which has a spin , a large energy barrier of 70 K, and is well described by Eq. 1 with K and mK [5]. Each magnetic molecule in a crystal is isolated from its neighbors, resulting in a total magnetic moment that is, to good approximation, an ensemble average of that of a single Mn12 molecule. At temperatures above K, the relaxation between the two wells is thermally assisted, with tunneling taking place from excited levels that are thermally populated. In this regime, the magnetic relaxation rate is well described by an Arrhenius law [1]:
| (3) |
where is the effective barrier, defined as the energy difference between the lowest level in the metastable well and the level where the preponderance of tunneling takes place, i.e. ; , the Arrhenius prefactor, is a constant of order 107 rad/s.
There have been numerous hydrostatic pressure experiments on Mn12 and related molecules [6, 7, 8, 9, 10, 11, 12, 13, 14, 15]. Inelastic neutron scattering experiments have shown a few-percent increase in when pressure of the order of a dozen kbar is applied [7]. In contrast, Levchenko et al. [8] reported that pressure increases the measured magnetic relaxation rate, consistent with a decrease in . In addition, studies have found that pressure converts some of the molecules between the fast and slower relaxing varieties, although the precise behavior of this change remains unclear [8, 15, 11, 6]. In the present work, we apply uniaxial pressure along the easy axis of a single crystal of Mn12 and examine the energy-level structure through measurements of the sample’s hysteresis loops. We find that the pressure alters the field at which tunneling occurs, an effect we interpret as due to an increase in . We also find a slight decrease in with pressure, which we attribute to the increase in brought about by the increase in . Our technique allows us to vary the pressure in situ at low temperature so that the sample is never under high pressure at room temperature, minimizing any structural distortions and deformations that may occur at such temperatures.
2 Experimental Setup
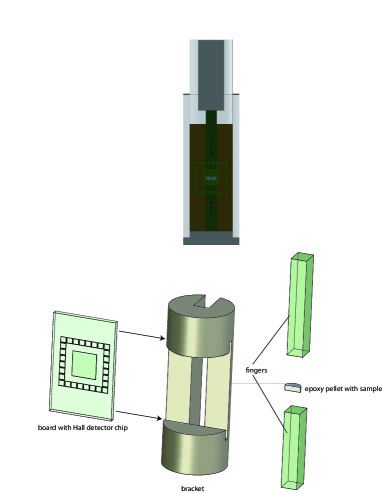
Our uniaxial pressure apparatus is based on a design by Campos et al. [16]. A diagram of the low-temperature portion of the apparatus is shown in Fig. 2. Pressure is applied through a pneumatic piston connected to a nitrogen gas cylinder, and is transferred to the sample cell at the end of the probe by non-magnetic stainless steel rods, capped by a small aluminum plug. This plug and the bottom cap of the cell press on two G10 phenolic “fingers” that transmit the pressure to a single crystal of Mn12, which is encased in a small (non-circular) cylindrical piece of epoxy (Stycast 1266), as shown in Fig. 2.
The sample was prepared by placing it in freshly mixed epoxy within a Teflon mold. A 3-Tesla field was applied to align the crystal’s easy axis (crystallographic c axis) with the axis of the cryostat’s field. Once cured, the epoxy was machined to make the top and bottom horizontal faces flat and to create a flat vertical face with the sample close to the surface, allowing coupling to a Hall bar detector.
The bottom portion of Fig. 2 illustrates the bracket that holds the Hall sensor chip and its mounting board, the G10 fingers, and the epoxy “pellet” containing the sample. When everything was in place, one edge of the sample was aligned with one Hall sensor; another sensor relatively far from the sample was used to measure background signals. The signals from the two Hall bars were subtracted using an analog circuit in order to cancel out common background signals. A regulated thermometer was placed close to the epoxy-sample pellet for temperature measurement and control.
3 Results and Analysis
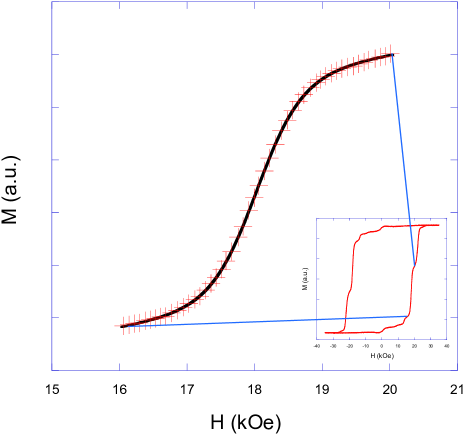
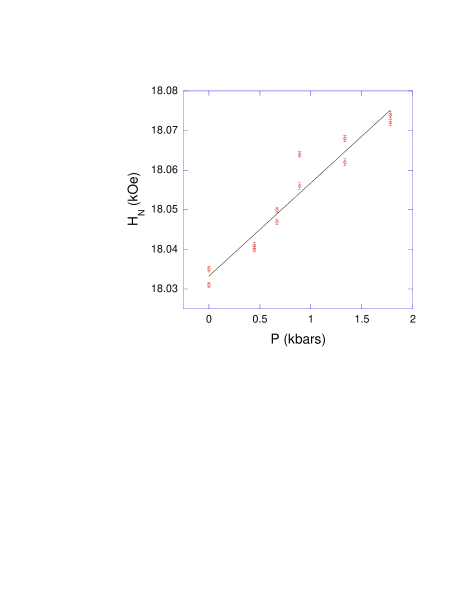
We acquired magnetic hysteresis loops from the sample at temperatures between 1.8 K and 2.2 K in 50 mK increments and with applied pressures, , as high as 1.8 kbar. For all loops, the field sweep rate was mT/s. A typical hysteresis loop (taken at 2.0 K and with no applied pressure) is shown in the inset of Fig. 3. The magnetization steps characteristic of resonant tunneling are apparent. The loop also displays features near zero field, which are the paramagnetic response of the fast-relaxing species as well as of some magnetic impurities in the apparatus’ materials. The main figure shows a close-up of the step for this loop. For every tunneling step clearly visible in each loop, we empirically fit the data with a hyperbolic tangent plus a straight line (to adjust for residual background effects) to determine , the field center for step (the field at which the tunneling rate is maximum). The main part of Fig. 3 shows an example of such a fit, superimposed on the data. For a given and , the step centers generally shift toward higher field with increasing pressure. Figure 4 shows as a function of pressure for the step at 2.0 K. With the exception of cases where the step is very small, with a correspondingly small signal-to-noise ratio, appears to depend linearly on pressure over the range of pressures studied. The results show no apparent baric hysteresis as evidenced by the fact that some of the data at 0.45 kbar and all of the data at 0 and 0.67 kbar were taken after applying the highest pressure.
The values of depend on both pressure and temperature. The latter dependence, involving both changes in tunneling levels ( and in Eq. 2) [17, 18] and the effects of mean dipolar fields [19], is significantly stronger than the effect of pressure. To determine the effect of pressure, we take for each step to be a linear function of pressure with a different zero-pressure intercept for each temperature:
| (4) |
For each step , we simultaneously fit all obtained values of (for all values of and ) to Eq. 4, to obtain a value of for that step. Figure 5 shows the values of as a function of . (Here and below we have grouped together data for and .) The figure also shows a fit to a line with zero intercept. This result suggests that the anisotropy parameter is increasing linearly with applied pressure, consistent with Eq. 2, which predicts when . From the fit, we obtain a pressure-induced relative change of of +0.142(1)/kbar. This value differs somewhat from those found in experiments employing hydrostatic pressure [8, 11]. The difference may be due to the uniaxial nature of the applied pressure in our study.
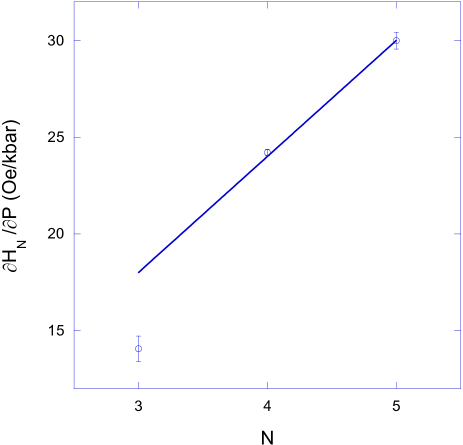
We determined the values of (and ) for each step by carefully ascertaining the values of at zero pressure and, after correcting for dipole-field effects [20], employing Eq. 2. From this analysis we find that the pair of levels () between which tunneling occurs are three levels below the top of the classical barrier for all three steps ( = 3,4,5) that we measured [21].
As a consistency check of the above interpretation that pressure is inducing a change in , we looked at how the pressure changes the effective barrier height . To do this, we also measured the maximum slope for each step and the corresponding value of at that point in the step. Under the approximation that the system has a single relaxation rate , the relaxation is governed by the simple differential equation
| (5) |
where the field sweep rate is constant for our experiments. is the equilibrium magnetization and is nearly equal to the saturation magnetization for the values of and investigated. With that approximation, can be determined from Eq. 5 and the measured values of and for each step:
| (6) |
At the same time, assuming a linear pressure dependence of (i.e. ), Eq. 3 yields
| (7) |
where the prime indicates differentiation with respect to and is the relaxation rate at . We neglect the small dependence may have.
For each and , we determine using Eq. 6 and then fit the pressure dependence to Eq. 7 to determine . The results are shown in Fig. 6 as a function of . The horizontal dashed lines are the expected values of using the value of determined from the results in Fig. 5 and the value of we determined from the values of for each [21].
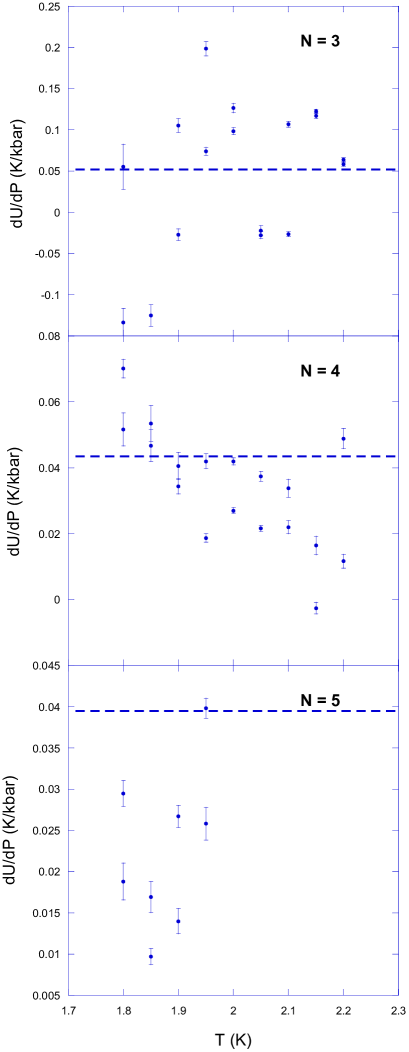
The data is very scattered and we can only conclude from it that the value of agrees on average with the sign and order or magnitude of the prediction. For , the scatter is smaller (note the change in vertical scale) and the agreement with the prediction is better, although there is an unexpected decrease with increasing . For , the data is consistently below the predicted value, but, again, of the same order of magnitude. The disagreements most likely arise from the assumptions of a single relaxation rate (Eq. 5) and monodispersed values of and . It is well known that Mn12Ac has a distribution of relaxation rates due to a distribution in anisotropy parameters as well as tilts of the easy axis away from the crystallographic symmetry axis [22, 23, 24, 25, 26]. These effects result in a broadening of the tunneling steps that effectively creates a maximum value of . Thus, when the steps are large (higher- data for and all data for ), the value of estimated using Eq. 6 is nearly saturated, suppressing its dependence.
While it is hard to draw strong conclusions from the results in Fig. 6, it is clear that this data is generally consonant with the interpretation that pressure is inducing a change in and consistent with the hypothesis that . If we consider that is also changing with pressure, it is difficult to devise a situation with significantly better agreement with the data. For example, allowing %/kbar (reducing to 0.116(1)%/kbar) results in a very modest improvement in the fit in Fig. 5, but roughly doubles the predicted values of in Fig. 6. If we take an extreme case and fix , then a fit of the data in Fig. 5 results in %/kbar, which predicts to be in the range 0.27–0.29 K/kbar, clearly inconsistent with the results in Fig. 6. We cannot rule out that pressure is inducing small changes in , but the only cases in which changes in would produce significant effects require that its relative change be larger than the relative change in , a somewhat unlikely scenario.
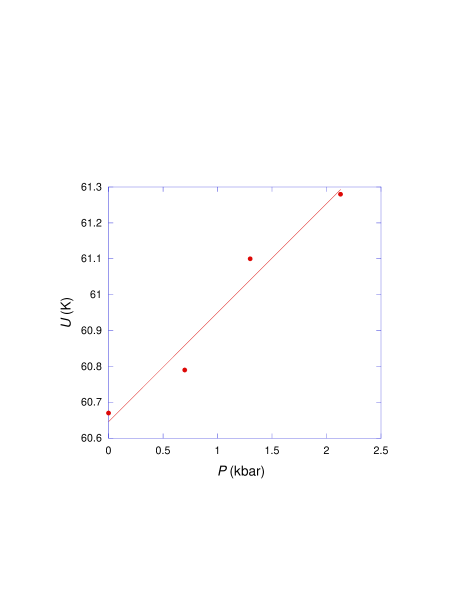
To complement the experimental findings, we performed ab initio calculations of the pressure dependence of the energy barrier of Mn12. We calculated the electronic structure and magnetic properties of the molecule using density-functional theory (DFT) including spin-orbit coupling (SOC). We used the plane-wave-based DFT code VASP [27, 28] and, for the exchange-correlation potential, we used the Perdew-Burke-Ernzerhopf generalized-gradient approximation [29]. Projector-augmented-wave pseudopotentials were used. The kinetic-energy cutoff was set to 580 eV. For our calculations, we used a unit cell of dimensions 24 x 24 x 24 Å3 containing one Mn12 molecule. We performed self-consistent DFT calculations including SOC until the total energy converged to within 0.5 eV. To simulate the effect of uniaxial pressure, we assumed uniform strain along the z axis of the molecule. This was implemented by contracting all z coordinates of the molecule by a given factor (up to 1.5%) while leaving the x and y coordinates unchanged. For each value of strain, we computed the magnetic anisotropy barrier in zero magnetic field. We converted strain to applied pressure using the method discussed in [30, 31] (tantamount to a Young’s modulus of 137.1 kbar). The results of these calculation are shown in Fig. 7.
These calculations indicate a qualitatively similar increase in with pressure as observed experimentally. Fitting the data in Fig. 7 to a straight line, yields a slope of = 0.30(4) K/kbar, about a factor of four larger than predicted: K/kbar. The discrepancy is not surprising: It indicates that most of the induced strain is intermolecular, which is explicitly not considered in the theoretical model. In other words, the Young’s modulus for the crystal is significantly smaller than that for the molecule itself.
4 Summary
We found that by applying uniaxial pressure along the easy axis of Mn12 acetate we were able to increase the magnitude of the applied field values at which resonant tunneling occurs. We explain this as an increase in the anisotropy parameter in the system’s spin Hamiltonian. We determine that pressure causes a change in of 0.142(1)/kbar. This interpretation is consistent with the pressure-induced changes in the relaxation rate as well as ab initio calculations of the the effect of pressure on the barrier height .
While in this experiment, the pressure was applied along the molecule’s symmetry axis, one could also apply pressure along a perpendicular direction, which could affect the tunneling rate by breaking the symmetry of the molecule. In fact, a theoretical calculation predicts that pressure applied along the hard axis of a four-fold symmetric molecule could modulate the tunneling rate via a geometric-phase effect [32]. Future experiments may attempt to observe this effect.
Acknowledgements.
We would like to acknowledge the valuable programming and analysis contributions of D. Wadden, as well the contributions of C. Mochrie, J. Rasowsky and D. K. Kim for their work on previous versions of this experiment. We are also indebted R. Cann and D. Krause for their essential aid in the design and construction of the apparatus, and J. Kubasek for his help in producing Fig. 2. Support for this work was provided by the National Science Foundation under grant nos. DMR-0449516 and DMR-1006519, and by the Amherst College Dean of Faculty.References
- [1] \NameFriedman J. R. Sarachik M. P. \REVIEWAnnu. Rev. Condens. Matter Phys.12010109 and references therein.
- [2] \NameFriedman J. R., Sarachik M. P., Tejada J. Ziolo R. \REVIEWPhys. Rev. Lett.7619963830.
- [3] \NameSun Z., Ruiz D., Dilley N. R., Soler M., Ribas J., Folting K., Maple M. B., Christou G. Hendrickson D. N. \REVIEWChem. Commun.19991973.
- [4] \NameWernsdorfer W., Sessoli R. Gatteschi D. \REVIEWEurophys. Lett.471999254.
- [5] \NameBircher R., Chaboussant G., Sieber A., Güdel H. U. Mutka H. \REVIEWPhys. Rev. B702004212413.
- [6] \NameSuzuki Y., Takeda K. Awaga K. \REVIEWPhys. Rev. B672003132402.
- [7] \NameSieber A., Chaboussant G., Bircher R., Boskovic C., Güdel H. U., Christou G. Mutka H. \REVIEWPhys. Rev. B702004172413.
- [8] \NameLevchenko G. G., Zubov E. E., Varyukhin V. N., Gaspar A. B. Real J. A. \REVIEWThe Journal of Physical Chemistry B108200416664.
- [9] \NameMito M., Deguchi H., Tajiri T., Takagi S., Yamashita M. Miyasaka H. \REVIEWPhys. Rev. B722005144421.
- [10] \NameSieber A., Foguet-Albiol D., Waldmann O., Ochsenbein S. T., Carver G., Mutka H., Fernandez-Alonso F., Mezouar M., Weber H. P., Christou G. Güdel H. U. \REVIEWPhys. Rev. B742006024405.
- [11] \NameSieber A., Bircher R., Waldmann O., Carver G., Chaboussant G., Mutka H. Güdel H.-U. \REVIEWAngew. Chem. Int. Ed.4420054239.
- [12] \NameOgawa M., Mito M., Tajiri T., Deguchi H., Takagi S., Nakata K., Yamashita M. Miyasaka H. \REVIEWJ. Magn. Magn. Mat.3102007e489.
- [13] \NamePrescimone A., Milios C. J., Moggach S., Warren J. E., Lennie A. R., Sanchez-Benitez J., Kamenev K., Bircher R., Murrie M., Parsons S. Brechin E. K. \REVIEWAngew. Chem. Int. Ed.4720082828.
- [14] \NamePrescimone A., Milios C. J., Sanchez-Benitez J., Kamenev K. V., Loose C., Kortus J., Moggach S., Murrie M., Warren J. E., Lennie A. R., Parsons S. Brechin E. K. \REVIEWDalton Trans.20094858.
- [15] \NameParois P., Moggach S. A., Sanchez-Benitez J., Kamenev K. V., Lennie A. R., Warren J. E., Brechin E. K., Parsons S. Murrie M. \REVIEWChem. Commun.4620101881.
- [16] \NameCampos C. E., Brooks J. S., Vanbentum P. J. M., Perenboom J., Rook J., Klepper S. J. Tokumoto M. \REVIEWRev. Sci. Instrum.6619951061.
- [17] \NameKent A. D., Zhong Y. C., Bokacheva L., Ruiz D., Hendrickson D. N. Sarachik M. P. \REVIEWEurophys. Lett.492000521.
- [18] \NameMertes K. M., Zhong Y., Sarachik M. P., Paltiel Y., Shtrikman H., Zeldov E., Rumberger E., Hendrickson D. N. Christou G. \REVIEWEurophys. Lett.552001874.
- [19] \NameMcHugh S., Jaafar R., Sarachik M. P., Myasoedov Y., Shtrikman H., Zeldov E., Bagai R. Christou G. \REVIEWPhys. Rev. B792009052404.
- [20] Explicitly, we used , where is the saturation magnetization and = 515 Oe [19].
- [21] To be precise, we find that for , respectively, the values of the pairs of levels involved in tunneling are (-4,1), (-5,1) and (-5,0). The pair of tunneling levels for Mn12 can depend on temperature [17, 18]; however, over the narrow temperature range in our study, we do not expect this effect to be very significant. In any case, a change of the = 4 pair, for example, from (5,-1) to, say, (4,0) would not have much effect on our findings. Such a change has no effect on the results for and has very modest effects on the analysis of , raising the expected value in Fig. 6 (middle panel) from 0.043 to 0.047 K/kbar.
- [22] \NameMertes K. M., Suzuki Y., Sarachik M. P., Paltiel Y., Shtrikman H., Zeldov E., Rumberger E. M., Henderson D. N. Christou G. \REVIEWPhys. Rev. Lett.872001227205.
- [23] \NamePark K., Novotny M. A., Dalal N. S., Hill S. Rikvold P. A. \REVIEWPhys. Rev. B652001014426.
- [24] \NameCornia A., Sessoli R., Sorace L., Gatteschi D., Barra A. L. Daiguebonne C. \REVIEWPhys. Rev. Lett.892002257201.
- [25] \Namedel Barco E., Kent A. D., Rumberger E. M., Hendrickson D. N. Christou G. \REVIEWPhys. Rev. Lett.912003047203.
- [26] \Namedel Barco E., Kent A. D., Hill S., North J. M., Dalal N. S., Rumberger E. M., Hendrickson D. N., Chakov N. Christou G. \REVIEWJ. Low Temp. Phys.1402005119.
- [27] \NameKresse G. Furthmuller J. \REVIEWPhys. Rev. B54199611169.
- [28] \NameKresse G. Joubert D. \REVIEWPhys. Rev. B5919991758.
- [29] \NamePerdew J. P., Burke K. Ernzerhof M. \REVIEWPhys. Rev. Lett.7719963865.
- [30] \NameNielsen O. H. Martin R. M. \REVIEWPhys. Rev. B3219853780.
- [31] \NameNielsen O. H. Martin R. M. \REVIEWPhys. Rev. B3219853792.
- [32] \NameFoss-Feig M. S. Friedman J. R. \REVIEWEPL86200927002.