Kinematic Discovery of a Stellar Stream located in Pisces
Abstract
We report the kinematic discovery of the Pisces Stellar Stream (PSS), at Galactic longitude and . We originally identified this halo substructure from velocities of red giant branch stars in Sloan Digital Sky Survey (SDSS) Data Release 8, and confirmed its presence in turnoff stars from SDSS photometric data. The PSS is a narrow, kinematically cold tidal stream, with km s-1. Its metallicity is [Fe/H] , with -dex dispersion. The color-magnitude signature of the stream turnoff, combined with our measured metallicity, places the PSS at a distance of 353 kpc. The Pisces Stellar Stream is the same as the previously announced “Triangulum stream” and part of the proposed “stream a”. We rule out an association of the PSS with other previously known Milky Way substructures in the same region of the sky.
1 Introduction
Many stellar streams and substructures resulting from the tidal disruption of satellite dwarf galaxies and star clusters under the gravitational influence of the Milky Way have been identified and mapped using deep, large-area photometric surveys (Newberg et al., 2002; Ibata et al., 2003; Majewski et al., 2003; Yanny et al., 2003; Rocha-Pinto et al., 2004; Belokurov et al., 2006; Grillmair & Johnson, 2006; Grillmair & Dionatos, 2006a, b; Grillmair, 2006; Belokurov et al., 2007; Grillmair, 2009; Newberg et al., 2009; Willett et al., 2009; Grillmair, 2010; Koposov et al., 2010; Rocha-Pinto, 2010; Sharma et al., 2010; Li et al., 2012; Sesar et al., 2012). Streams and cloud-like substructures have also been observed kinematically via spectroscopic surveys of tracers such as RR Lyrae, M-giants, or turnoff stars (e.g., Vivas et al. 2001; Duffau et al. 2006; Carlin et al. 2012; Majewski et al. 2012; Sheffield et al. 2012).
Here we report a stellar tidal stream discovered kinematically, which (based on its location in the constellation Pisces) we dub the “Pisces Stellar Stream” (PSS). This stream was identified as a grouping of red giant branch stars at a common distance and radial velocity during the course of a spectroscopic study of the Cetus Polar Stream (CPS). In the CPS study (Yam et al. 2013), we selected metal-poor ([Fe/H]) stars with surface gravities consistent with being giants () from the SDSS DR8 spectroscopic data in the south Galactic hemisphere. The Cetus stream was clearly present in velocity versus Galactic latitude plots of these stars, along with an additional feature consisting of a few stars clumped at km s -1. Upon further exploration, these stars turn out to nearly all be drawn from the same small region of sky and have similar magnitudes (and thus similar distances). In this Letter, we show evidence that this grouping of stars is part of a stellar tidal stream at a distance of roughly 35 kpc from the Sun in the constellation Pisces. This stream is a piece of “stream a” in the matched-filtered density maps of Grillmair (2012), and is the same as the “Triangulum stream” in Bonaca et al. (2012). We chose to rename the stream because our detection is within the Pisces constellation, the stream does not pass through Triangulum, and we cannot verify whether the stream extends the length of “stream a.” This Letter presents the first measurement of velocities and metallicities of stars in this stream.
2 Observation and Data Analysis
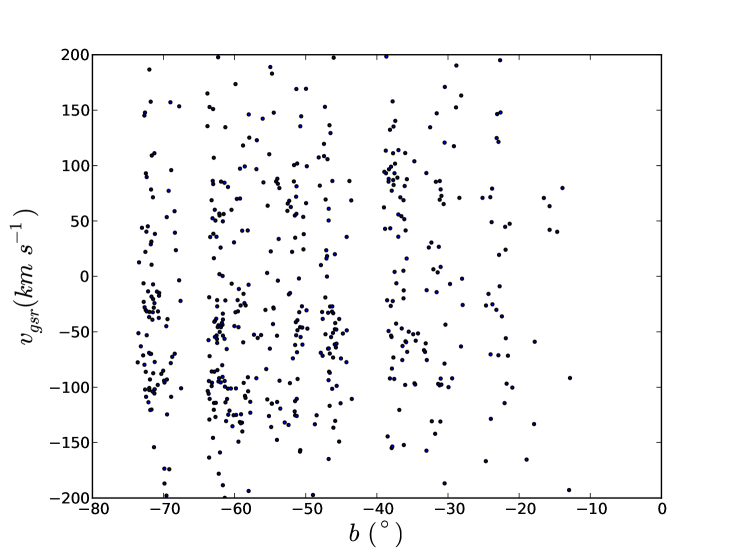
In Figure 1 we plot vs. Galactic latitude for stars between Galactic longitudes of , (giant stars), [Fe/H] , and . The color and magnitudes were chosen to exclude both turnoff stars whose surface gravity was miscalculated and evolved post-RGB stars, while retaining likely red giant branch stars. The most prominent features in Figure 1 are swaths of RGB stars at km s-1, running across most of this plot, which are associated with the Sagittarius and Cetus streams (Newberg et al. 2009, Koposov et al. 2012, Yam et al. 2013). An additional overdensity of metal-poor giant stars can be seen around and km s-1.
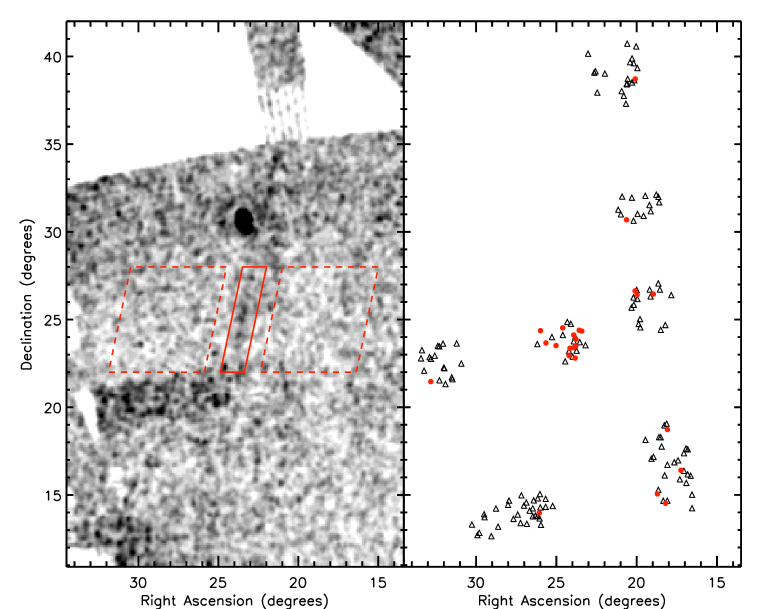
We now show that this velocity clump represents a real structure in the Galactic halo. From the sample of metal-poor red giant branch (RGB) stars shown in Figure 1, we selected a smaller velocity range of km s km s-1. We plotted the positions of stars in Galactic coordinates, and noted that many of these velocity-selected giant stars with metallicities between [Fe/H] are concentrated in a small fraction of a single SDSS spectroscopic plate centered at and (see Figure 2).
Figure 2 was produced using the matched-filter technique described in detail by Grillmair (2009), which is in turn a refinement of the Rockosi et al. (2002) method. This method can be used to create weighted density maps of stars from within a given color-magnitude filter (based on either an empirical ridgeline or a theoretical isochrone) placed at a given distance; the weights emphasize regions of the filter expected to contain the highest ratio of stream stars to foreground stars. The map in Figure 2 shows filtered star counts from SDSS DR8 using a filter based on a Padova isochrone (Marigo et al. 2008, Girardi et al. 2010) with ([Fe/H]), age 12.7 Gyr, at a distance of 33.6 kpc (note that the filter’s response will be highest near the main sequence turnoff of the filter, at colors where foreground contamination is minimal). The most prominent feature (the blob at ) is due to the M33 galaxy. A narrow stream is visible running nearly vertically across this plot, from to .
We selected a region of sky based on the positions of these velocity-selected, metal-poor giants that we call the “on-stream field.” This is defined as the area within in right ascension about the line , confined to ; the linear trend was fit to apparent density peaks in the matched-filter star count map (Figure 2). The width of the on-stream field was chosen to include all of the spectroscopic candidates we originally identified in this region, and its length covers the portion of the sky where the stream is obvious in the filtered star counts map.
An off-stream region was defined that contains an area eight times larger than that of the on-stream field. This comparison region was made up of two areas (seen as dashed boxes on Figure 2) defined by:
| (1) |
| (2) |
In the top left and top right panels of Figure 3 we show color magnitude diagrams (CMDs) of all stars having SDSS DR8 spectra within the on- and off-stream fields, respectively. We also show subsets of the spectra with properties expected for the PSS. The subscripts on the magnitudes and mean that these magnitudes have been extinction corrected based on the Schlegel et al. (1998) maps (using the extinction values provided for each star in the SDSS database).

The metal-poor giant stars selected using the velocity criteria (i.e., red points in the top panels of Figure 3) are mostly clustered around in the on-stream field (top left panel of Figure 3), while the more metal-rich stars (light blue points) scatter throughout the diagram. We suggest that these stars are part of the red giant branch of a single structure. The comparison off-stream field (top right panel) contains several stars that match our velocity, metallicity, and giant-selection criteria, but don’t have a coherent distribution that could reasonably correspond to a giant branch. In the on-stream field there are a total of 448 stars with spectra in this diagram: 32 light blue points (velocity-selected giants) and 11 red points (velocity and metallicity-selected giants). The off-stream area has 1584 total spectra, with 90 light blue points and 14 red points. To calculate potential foreground contamination we selected stars with that are within 0.1 magnitudes in of the Padova isochrone with age 12.7 Gyr, [Fe/H] = -2.3, at a distance of 33 kpc. There are 403 and 124 spectra within this filter in the off- and on-stream regions, respectively; a factor of 3.25 times as many spectra were observed in the off-stream region. Among the off-stream spectra in this isochrone filter, there are only 2 metal-poor () red giants () with . Scaling by the factor of 3.25, this leads to an expectation of background “interloper” in our on-stream sample. Our finding of 10 candidate stream stars in this region (satisfying the same criteria) is thus a significant excess relative to neighboring regions. Furthermore, these stars are clustered in a small region of the CMD where we expect RGB stars. One additional candidate is a blue star that is consistent with being a horizontal branch star at the same distance. Table 1 shows the properties of the eleven stars classified as PSS candidates.
On the top left panel of Figure 3 we overplot three isochrones shifted to distances (28, 33, and 38 kpc) that roughly match the RGB, with a metallicity of ([Fe/H]) and age 12.7 Gyr. Our choices of isochrone parameters will become clear later in this paper, as these were motivated by the main sequence turnoff (MSTO) visible in our background-subtracted Hess diagram, our spectroscopic metallicity measurement, and examination of our matched-filter star count map. For now, we note that the RGBs of the fainter two isochrones match the clump of red points in Figure 3 well.
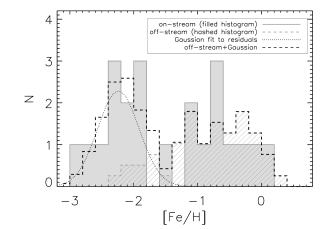
The surface gravity cut selects asymptotic giant branch (AGB) and blue horizontal branch (BHB) stars in addition to the RGB stars we are interested in finding. To further isolate RGB stars, we chose only stars with color from the velocity-selected sample shown in Figure 3 (light blue points), and histogrammed their metallicities in the upper panel of Figure 4. Because the off-stream field has many more stars than the on-stream selection, we normalized the off-stream counts by the relative number of stars with [Fe/H] (43 in the off-stream vs. 11 in the on-stream region). The distributions of velocity-selected RGB candidate stars in the on- and off-stream fields are clearly different. The on-stream field has a metal-rich component at [Fe/H] that is consistent with the off-stream (i.e., background) stars, but also a different, more metal poor, population at [Fe/H] . Also shown in the left panel of Figure 4 is a Gaussian that we fit to the residuals from subtracting the scaled off-stream counts from the on-stream data; this yields , with . Because this low-metallicity peak is not present in the off-stream fields, we identify this as the PSS metallicity signature; this is the reason for the metallicity selection of [Fe/H] for the red points in Figure 3.
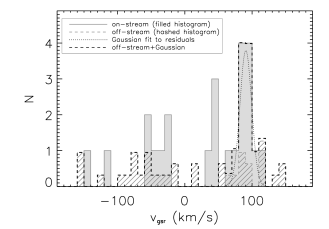
We performed a similar procedure to find the velocity of stream candidates. The right panel of Figure 4 shows velocities of metal-poor ([Fe/H]) red giants, with the off-stream number counts scaled down by a factor of 3.16 so that the number of red giants with [Fe/H] is equal in the two samples. Again, we subtracted the scaled off-stream histogram from the on-stream data, and fit a Gaussian to the residuals. The fit (shown as a dotted curve in Figure 4) gives , with .
Having confirmed the presence of a population of stars having common velocity and metallicity, we next examine the photometric data in this region of the sky to look for additional evidence of the substructure. We selected all stars with photometric data from the SDSS DR8 database, within the on- and off-stream fields described above. We created CMD Hess diagrams for both the on- and off-stream fields using extinction-corrected magnitudes and colors. The Hess diagram for the off-stream field was normalized by dividing number counts in each bin by 8 to account for the larger area relative to the on-stream region. We subtracted the normalized off-stream Hess diagram from that of the on-stream field to create a difference plot. The residuals from this subtraction can be seen in the bottom left panel of Figure 3.
Figure 3 (lower panels) reveals an overdensity of stream stars between and , consistent with a population of F-turnoff stars from the stream whose velocity signature we have found in RGB stars. The turnoff magnitude is clearly fainter than that of the 28 kpc isochrone, and appears more likely to be between the 33-kpc and 38-kpc isochrones. Since the stars are in a narrow line across the sky, we surmise that the turnoff stars and spectroscopically selected RGB stars are part of an old, metal-poor tidal stream at a distance of kpc.
| ra (deg) | dec (deg) | (km s-1) | [Fe/H] | |||||
|---|---|---|---|---|---|---|---|---|
| 24.18291 | 22.93643 | 113.5 | -2.54 | 2.30 | 18.14 | 0.59 | 0.84 | 1.23 |
| 24.21572 | 22.95978 | 93.1 | -1.87 | 2.92 | 18.98 | 0.53 | 0.73 | 1.15 |
| 23.80551 | 23.47830 | 96.7 | -2.37 | 2.72 | 18.89 | 0.50 | 0.67 | 0.98 |
| 23.92007 | 23.39030 | 85.5 | -2.13 | 2.18 | 18.71 | 0.52 | 0.73 | 1.22 |
| 23.24328 | 23.19339 | 80.9 | -2.12 | 3.70 | 17.84 | -0.14 | -0.26 | 1.28 |
| 23.57924 | 24.39110 | 101.7 | -2.65 | 1.69 | 19.12 | 0.56 | 0.76 | 1.21 |
| 23.41445 | 24.34511 | 93.1 | -2.07 | 3.09 | 19.10 | 0.52 | 0.72 | 1.12 |
| 23.78164 | 23.88001 | 77.4 | -2.38 | 1.85 | 18.74 | 0.55 | 0.76 | 1.23 |
| 24.15154 | 23.36385 | 88.0 | -2.35 | 1.09 | 17.91 | 0.62 | 0.89 | 1.23 |
| 23.91934 | 24.11852 | 82.5 | -1.95 | 3.12 | 18.70 | 0.53 | 0.78 | 1.13 |
| 23.82848 | 22.80306 | 94.4 | -1.91 | 2.08 | 17.34 | 0.65 | 0.91 | 1.44 |
3 Discussion and Conclusion
We have identified the kinematical and chemical signature of a likely stellar tidal stream based on spectra in an SDSS plate located at and between . Stars in this structure, which we dub the Pisces Stellar Stream (PSS), have line-of-sight velocities in the Galactic standard of rest frame between km s 114 km s-1. We estimate the mean velocity for the 11 stars using a maximum likelihood method (e.g., Pryor & Meylan 1993; Kleyna et al. 2002), and find km s-1 and an intrinsic velocity dispersion (accounting for individual velocity errors; the typical error for an individual star is km s-1) of km s-1. The metallicity of these 11 stars, determined from a Gaussian fit to the residuals after subtracting an off-stream field, is [Fe/H] with a dispersion of , which is only slightly larger than the SDSS metallicity measurement error of dex (Lee et al., 2008). We isolate the PSS in both a background-subtracted color-magnitude Hess diagram and a matched-filter star count map. From these, we derive a distance to the stream of kpc. No distance gradient was apparent over the short stretch of the stream we isolated. The mean position of the 11 spectroscopically confirmed stars is .
The Pisces stream is a small segment of the structure identified as “stream a” by Grillmair (2012) in a matched-filter star count map of the south Galactic cap. This structure has also been reported by Bonaca et al. (2012) based on star count maps using a similar technique. Bonaca et al. found a distance of kpc to the stream, which they dubbed the “Triangulum stream”. However, this distance was based on a metallicity of [Fe/H] = -1.0 estimated from isochrones; our measured spectroscopic metallicity of [Fe/H] = -2.2 requires a more distant, kpc isochrone to match the stream in the CMD. Our finding that the stream is kinematically cold, narrow in width, and essentially mono-metallic, confirms the suggestions of both Grillmair (2012) and Bonaca et al. (2012) that this stream is the remnant of a globular cluster, or possibly an ultrafaint dwarf galaxy.
This stream is distinct in distance and line-of-sight velocity from other known substructures in this region of the sky. The Triangulum-Andromeda (TriAnd) stellar structure (Rocha-Pinto et al. 2004) is a large, diffuse substructure. TriAnd is 16-25 kpc from the Sun (Majewski et al. 2004), much closer than our 35 kpc estimate for the PSS. Moreover, our mean velocity of km s-1 at is much higher than the km s-1 found by Rocha-Pinto et al. (2004) for TriAnd at this position. We thus consider an association between the Pisces stream and TriAnd to be unlikely. The PSS is also unlikely to be associated with the CPS, as the CPS has km s-1 at , compared to our km s-1 velocity for the Pisces stream at this position.
References
- Belokurov et al. (2006) Belokurov, V., Zucker, D. B., Evans, N. W., et al. 2006, ApJ, 642, L137
- Belokurov et al. (2007) Belokurov, V., Zucker, D. B., Evans, N. W., et al. 2007, ApJ, 654, 897
- Bonaca et al. (2012) Bonaca, A., Geha, M., & Kallivayalil, N. 2012, ApJ, 760, L6
- Carlin et al. (2012) Carlin, J. L., Yam, W., Casetti-Dinescu, D. I., et al. 2012, ApJ, 753, 145
- Duffau et al. (2006) Duffau, S., Zinn, R., Vivas, A. K., et al. 2006, ApJ, 636, L97
- Girardi et al. (2010) Girardi, L., Williams, B. F., Gilbert, K. M., et al. 2010, ApJ, 724, 1030
- Grillmair & Johnson (2006) Grillmair, C. J., & Johnson, R. 2006, ApJ, 639, L17
- Grillmair & Dionatos (2006a) Grillmair, C. J., & Dionatos, O. 2006a, ApJ, 641, L37
- Grillmair & Dionatos (2006b) Grillmair, C. J., & Dionatos, O. 2006b, ApJ, 643, L17
- Grillmair (2006) Grillmair, C. J. 2006, ApJ, 651, L29
- Grillmair (2009) Grillmair, C. J. 2009, ApJ, 693, 1118
- Grillmair (2010) Grillmair, C. J. 2010, Galaxies and their Masks, 247
- Grillmair (2012) Grillmair, C. J. 2012, Galactic Archaeology: Near-Field Cosmology and the Formation of the Milky Way, 458, 219
- Ibata et al. (2003) Ibata, R. A., Irwin, M. J., Lewis, G. F., Ferguson, A. M. N., & Tanvir, N. 2003, MNRAS, 340, L21
- Kleyna et al. (2002) Kleyna, J., Wilkinson, M. I., Evans, N. W., Gilmore, G., & Frayn, C. 2002, MNRAS, 330, 792
- Koposov et al. (2010) Koposov, S. E., Rix, H.-W., & Hogg, D. W. 2010, ApJ, 712, 260
- Koposov et al. (2012) Koposov, S. E., Belokurov, V., Evans, N. W., et al. 2012, ApJ, 750, 80
- Lee et al. (2008) Lee, Y. S., Beers, T. C., Sivarani, T., et al. 2008, AJ, 136, 2022
- Li et al. (2012) Li, J., Newberg, H. J., Carlin, J. L., et al. 2012, ApJ, 757, 151
- Majewski et al. (2003) Majewski, S. R., Skrutskie, M. F., Weinberg, M. D., & Ostheimer, J. C. 2003, ApJ, 599, 1082
- Majewski et al. (2004) Majewski, S. R., Ostheimer, J. C., Rocha-Pinto, H. J., et al. 2004, ApJ, 615, 738
- Majewski et al. (2012) Majewski, S. R., Nidever, D. L., Smith, V. V., et al. 2012, ApJ, 747, L37
- Marigo et al. (2008) Marigo, P., Girardi, L., Bressan, A., et al. 2008, A&A, 482, 883
- Newberg et al. (2002) Newberg, H. J., Yanny, B., Rockosi, C., et al. 2002, ApJ, 569, 245
- Newberg et al. (2009) Newberg, H. J., Yanny, B., & Willett, B. A. 2009, ApJ, 700, L61
- Pryor & Meylan (1993) Pryor, C., & Meylan, G. 1993, in Astronomical Society of the Pacific Conference Series, Vol. 50, Structure and Dynamics of Globular Clusters, ed. S. G. Djorgovski & G. Meylan, 357
- Rocha-Pinto et al. (2004) Rocha-Pinto, H. J., Majewski, S. R., Skrutskie, M. F., Crane, J. D., & Patterson, R. J. 2004, ApJ, 615, 732
- Rocha-Pinto (2010) Rocha-Pinto, H. J. 2010, IAU Symposium, 265, 255
- Rockosi et al. (2002) Rockosi, C. M., Odenkirchen, M., Grebel, E. K., et al. 2002, AJ, 124, 349
- Schlegel et al. (1998) Schlegel, D. J., Finkbeiner, D. P., & Davis, M. 1998, ApJ, 500, 525
- Sesar et al. (2012) Sesar, B., Cohen, J. G., Levitan, D., et al. 2012, ApJ, 755, 134
- Sharma et al. (2010) Sharma, S., Johnston, K. V., Majewski, S. R., et al. 2010, ApJ, 722, 750
- Sheffield et al. (2012) Sheffield, A. A., Majewski, S. R., Johnston, K. V., et al. 2012, ApJ, 761, 161
- Vivas et al. (2001) Vivas, A. K., Zinn, R., Andrews, P., et al. 2001, ApJ, 554, L33
- Willett et al. (2009) Willett, B. A., Newberg, H. J., Zhang, H., Yanny, B., & Beers, T. C. 2009, ApJ, 697, 207
- Yam et al. (2013) Yam, W., Newberg, H. J., Carlin, J. L., Dumas, J., O’Malley, E., Martin, C., & Newby, M. 2013, ApJ, submitted
- Yanny et al. (2003) Yanny, B., Newberg, H. J., Grebel, E. K., et al. 2003, ApJ, 588, 824