X-ray Irradiation of the LkCa 15 Protoplanetary Disk
Abstract
LkCa 15 in the Taurus star-forming region has recently gained attention as the first accreting T Tauri star likely to host a young protoplanet. High spatial resolution infrared observations have detected the suspected protoplanet within a dust-depleted inner gap of the LkCa 15 transition disk at a distance of 15 AU from the star. If this object’s status as a protoplanet is confirmed, LkCa 15 will serve as a unique laboratory for constraining physical conditions within a planet-forming disk. Previous models of the LkCa 15 disk have accounted for disk heating by the stellar photosphere but have ignored the potential importance of X-ray ionization and heating. We report here the detection of LkCa 15 as a bright X-ray source with Chandra. The X-ray emission is characterized by a cool heavily-absorbed plasma component at kTcool 0.3 keV and a harder component at kThot 5 keV. We use the observed X-ray properties to provide initial estimates of the X-ray ionization and heating rates within the tenuous inner disk. These estimates and the observed X-ray properties of LkCa 15 can be used as a starting point for developing more realistic disk models of this benchmark system.
1 Introduction
In a recent groundbreaking discovery, Kraus & Ireland (2012, hereafter KI12) have reported the direct detection of what is likely the first exoplanet orbiting a young T Tauri star (TTS). Infrared images obtained using a novel masked aperture interferometry technique revealed the suspected protoplanet known as LkCa 15b orbiting the solar-mass TTS LkCa 15 in Taurus. The protoplanet is offset 80 mas from the star and the separation accounting for projection effects is estimated to be 15.9 2.1 AU (KI12). The protoplanet is located within a dust-depleted cavity in the LkCa 15 inner disk. The estimated mass of the protoplanet is Mp 6 MJup. at an assumed age of 1 Myr. The blue color and rather high luminosity Lp 10-3 L⊙ of LkCa 15b suggest that it may still be accreting. The large radius of the cavity in which it is located (Rcav 50 AU) is a subtle hint that other as yet undetected protoplanets may be present (Andrews et al. 20011a,b; hereafter A11a,b). If the status of LkCa 15b as a protoplanet is confirmed by further observations, this young starexoplanet system will provide much-needed observational constraints on the physical conditions in disks that are actively forming planets and will stringently test planet formation models.
LkCa 15 has been extensively studied at optical, IR, and (sub)millimeter wavelengths. Its properties are summarized in Table 1. Interferometer mm/sub-mm dust continuum observations (A11b; Isella et al. 2012) have shown that dust is heavily depleted inside a radius of 50 AU, but a small amount of residual dust may remain (A11a,b). CO observations reveal that gas is still present in the dust-depleted cavity (Piétu et al. 2007). Such a dust-depleted inner disk with the absence of a near-IR excess is frequently referred to as a transition disk, but different definitions of this term have emerged in the literature as reviewed by Williams & Cieza (2011).
Several possible mechanisms for clearing the large cavity were examined by A11a, who concluded that dynamical interactions with a low-mass companion - either a brown dwarf or giant planet on a long-period orbit - are the most likely explanation. However, questions remain as to whether such a large gap could have been cleared by a single planet, suggesting (indirectly) that a planetary system may be present. But other explanations for the large disk cavity have been proposed including radial variations in grain size and dust opacity (Isella et al. 2012).
Previous models of the LkCa 15 disk have considered photospheric heating of the disk by the central star, but have neglected X-ray heating. For example, the recent study of disks based on high resolution Submillimeter Array (SMA) observations by A11a quoted a 3 upper limit on the X-ray luminosity of LkCa 15 of log Lx 29.6 ergs s-1 based on its non-detection in the ROSAT All-Sky Survey (Neuhäuser et al. 1995). We report here the first detection of LkCa 15 as a bright X-ray source with an intrinsic (unabsorbed) X-ray luminosity of at least log Lx 30.4 ergs s-1, significantly higher than the ROSAT upper limit cited above. Our primary objective here is to elucidate the X-ray properties of LkCa 15 so that X-ray effects can be accounted for in more refined disk models. We provide initial estimates of X-ray ionization and heating rates based on the observed X-ray properties and previously published disk models.
We emphasize that strong X-ray (and EUV) emission from the central star has important consequences for disk evolution, disk chemistry, accretion, mass-loss, and planet formation. X-rays ionize and heat material in the disk (especially in the outer layers), the wind, and in the outer atmospheres of any protoplanets in the inner disk region near the star. Increased ionization of disk gas by X-rays strengthens the coupling of the disk to the stellar magnetic field and thereby influences angular momentum transport (Balbus & Hawley 1991). X-rays destroy dust near the star and X-ray induced photoevaporation increases mass-loss and can lead to formation of inner disk holes that affect the accretion rate (Owen et al. 2010).
2 Chandra Observation
The Chandra observation (ObsId 10999) was carried out on 27 December 2009 from 09:40 - 12:54 TT with an exposure live time of 9813 s. Exposures were obtained using the ACIS-S (Advanced CCD Imaging Spectrometer) array in VFAINT timed-event mode with 3.2 s frame times. LkCa 15 was placed at the nominal aimpoint on the ACIS-S3 CCD (Table 2). For an on-axis point source, the ACIS-S 70% encircled energy radius at 2 keV is R70 1.′′17 and the 90% encircled energy radius is R90 1.′′96. Further information on Chandra and its instrumentation can be found in the Chandra Proposer’s Observatory Guide (POG)333See http://asc.harvard.edu/proposer/POG.
The pipeline-processed data files provided by the Chandra X-ray Center (CXC) were analyzed using standard science threads with CIAO version 4.4444Further information on Chandra Interactive Analysis of Observations (CIAO) software can be found at http://asc.harvard.edu/ciao.. The CIAO processing used recent calibration data from CALDB version 4.4.10. Source events, spectra, and light curves were extracted from a circular region of radius 1′′.5 (3 ACIS pixels) centered on the X-ray peak. Background was extracted from a source-free annulus centered on LkCa 15 with inner and outer radii of 5′′ and 15′′. Background is negligible, amounting to less than 1 count (0.2 - 8 keV) within the = 1′′.5 extraction circle during the 9.8 ks exposure. CIAO specextract was used to extract spectra along with source-specific response matrix files (RMFs) and auxiliary response files (ARFs). Spectral fitting, timing analysis, and image analysis were undertaken with the HEASOFT Xanadu555http://heasarc.gsfc.nasa.gov/docs/xanadu/xanadu.html. software package including XSPEC vers. 12.7.1. XRONOS vers. 5.2.1, and XIMAGE vers. 4.4. Additional tests for source variabilility were carried out on energy-filtered source event lists using statistics and the Bayesian-method CIAO tool glvary (Gregory & Loredo 1992, 1996).
3 Results
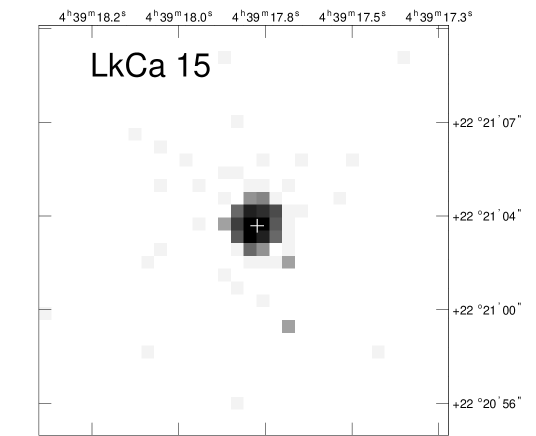
Table 2 summarizes the basic X-ray properties of LkCa 15. The measured X-ray centroid of the source is offset by only 0′′.08 from the HST GSC v2.3.2 position of LkCa 15 (Fig. 1). This small offset is well within Chandra’s ACIS-S absolute astrometric accuracy of 0.′′42 (90% confidence) 666http://cxc.harvard.edu/cal/ASPECT/celmon/ . There are no other sources in the HST GSC or 2MASS catalogs within 10′′ of LkCa 15, giving high confidence that LkCa 15 is the X-ray source. There is no evidence to date that LkCa 15 is a binary star (Nguyen et al. 2012). The Chandra ACIS-S PSF core has FWHM 0.′′74 at 1.5 keV so the angular resolution is not sufficient to determine if any of the detected emission originates in the protoplanet itself. The CIAO tool gives an observed source size of 0.′′46 [0.′′43 - 0.′′49, 90% confidence], so there is no indication that the source is extended. We assume below that all of the X-ray emission is stellar.
The CIAO tool gives a probability of constant count rate P(const) = 0.91 using source events in the 0.2 - 8 keV range. Chi-squared analysis of binned light curves constructed from events in the 0.2 - 8 keV range gives P(const) = 0.68 (200 s bins) and P(const) = 0.54 (400 s bins). Thus, we find no compelling evidence for variability in LkCa 15 during the short 9.8 ks (2.7 hr) exposure, but further time monitoring would be useful to determine if large X-ray flares occur, as is common amongst TTS. Such flares, if present, usually harden the X-ray spectrum and bombard the inner disk with high particle fluxes.
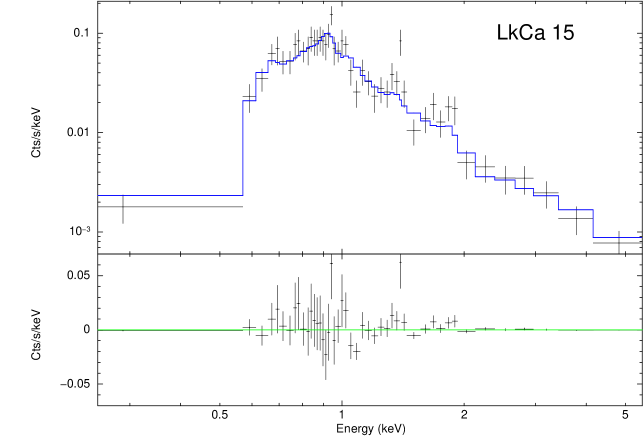
Figure 2 shows the ACIS-S CCD spectrum of LkCa 15. Low-energy absorption is clearly seen at energies E 0.6 keV. Most of the detected emission lies in the energy range 0.5 - 2 keV but harder emission is present. A total of 72 out of 592 source events have energies E 2 keV. Spectral fits with an absorbed thermal plasma model require at least two temperature (2T) components. Table 3 compares the fit results obtained with three different 2T models. The model fits were obtained using the Astrophysical Plasma Emission Code and its variable-abundance version as implemented in XSPEC (Smith et al. 2001). Model A is a solar abundance 2T optically thin plasma model. Model B is similar except that the global metallicity was allowed to vary and it converged to a best-fit value Z = 0.46 Z⊙, but the value is not tightly-constrained. Model C is a 2T model for which the abundances of individual elements were held fixed at values typical of TTS in Taurus (Güdel et al. 2007; Scelsi et al. 2007).
All three models require a cool plasma component at kT1 0.2 - 0.3 keV and a hotter component at kT2 4 - 5 keV, with most of the volume emission measure as gauged by the XSPEC parameter residing in the cool component. The hot component is required to reproduce the hard emission detected above 2 keV. The upper 90% confidence bound on kT2 is not tightly constrained due to the paucity of counts above 2 keV.
All three models in Table 3 are statistically acceptable and there is very little difference in their goodness-of-fit as determined by statistics. However, on physical grounds model C is clearly the most realistic. It gives a best-fit absorption column density NH = 3.7 [2.4 - 5.1; 90% confidence] 1021 cm-2. Using the NH to AV conversion of Gorenstein (1975), the above NH equates to AV = 1.7 [1.1 - 2.3] mag and the conversion of Vuong et al. (2003) gives AV = 2.3 [1.5 - 3.2] mag. These AV values are consistent with the range AV = 1.3 - 1.7 mag determined from other studies (e.g. Espaillat et al. 2010). In contrast, the NH values determined from models A and B are twice as large and imply AV values that are much higher than anticipated. In addition, the ratio log Lx/Lbol = 3.18 from model C is similar to other TTS in Taurus (Telleschi et al. 2007), but the ratios determined from models A and B are unusually high. We thus adopt model C as the reference model used in the ionization and heating rate calculations below.
4 Discussion
4.1 X-ray Heating and Ionization
X-ray photons are able to penetrate the surface layers of protoplanetary disks, resulting in increased ionization and heating. In dense environments, hard X-rays are particularly important because they suffer less absorption and reach deeper layers in the disk. But, as shown below, the effects of softer X-rays cannot be ignored in low-density environments such as the inner region of the LkCa 15 transition disk. X-ray heating is produced by fast electrons ejected by atoms which become ionized after absorbing X-ray photons. These fast electrons collide with and heat other atoms and electrons in the disk. Additional X-ray heating occurs as a result of other processes as discussed by Glassgold et al. (2012; hereafter G12).
We provide below initial estimates of the X-ray ionization and heating rates in the inner disk (r 15 AU) of LkCa 15. We use cylindrical coordinates (r,z) where r is the distance from the star in the disk midplane and z is the height above the midplane. The disk is assumed to be azimuthally symmetric. Our analysis follows that of Glassgold et al. (1997a, hereafter G97a; see also Glassgold et al. 1997b), Igea and Glassgold (1999, hereafter IG99), Shang et al. (2002; hereafter S02), and Glassgold et al. (2004). We ignore scattering effects, which have been discussed by IG99. We make use of properties of the LkCa 15 disk, especially the dust-depleted cavity inside 50 AU, derived by A11a and Isella et al. (2012) using data from (sub)millimeter interferometers. We assume that the disk is composed of solar-abundance material, but settling of heavier elements toward the disk midplane could result in heavy-element depletion in the outer layers (G97a).
For a thermal X-ray spectrum with characteristic plasma temperature Tx, the ionization rate at a distance is (eq. [3.9] of S02):
| (1) |
where is the distance of the X-ray source above (or below) the center of the disk, is the energy to create an ion pair ( 37 eV for a solar abundance HHe plasma), and the function is an asymptotic approximation of the X-ray attenuation at optical depth for a specified low-energy cutoff at energy E0, where = E0/kTx (eq. [C1] of S02). We adopt E0 = 0.1 keV in this study, as did S02. For numerical estimates, the following expression for the primary ionization rate at distance is useful (eq. [3.10] of S02):
| (2) |
where is the photoelectric X-ray absorption cross-section per H nucleus evaluated at energy . For a given X-ray photon energy E, the cross-section is approximated by a power-law
| (3) |
where (1 keV) = 2.27 10-22 cm2 and p = 2.485 for a solar abundance disk plasma (G97a), as assumed here. Smaller values of are required if heavy elements are depleted (G97a).
Following G97a and S02, we position the X-ray source at a distance Rx = 4R∗ = 6.4 R⊙ = 4.45 1011 cm above the disk center. This placement is somewhat arbitrary since existing X-ray telescopes lack sufficient angular resolution to pinpoint the locations of individual X-ray emitting regions on stars. But, by analogy with the Sun, most of the emission is thought to originate in coronal loops well above the stellar surface. The effects of changes in the location of the X-ray source on ionization rates were investigated by IG99 who found that the exact location has little effect at the low disk column densities of interest here. We use a stellar radius R∗ = 1.6 R⊙ appropriate to LkCa 15 (Table 1). By comparison, G97a and S02 considered a generic TTS with radius R∗ = 3 R⊙ and Rx 10 - 14 R⊙. The values of for the cool (kTx,1 = 0.3 keV) and hot (kTx,2 = 5.0 keV) plasma components are given in Table 4 based on the X-ray spectral properties of LkCa 15 (model C in Table 3).
The X-ray ionization rate decreases with radius as r-2 (eq. [1]). As such, the ionization rate will be highest in the inner disk close to the star, all other factors being equal. We adopt a characteristic radius r = 1 AU R0 in the calculations below, but these results can be readily scaled to larger radii (Sec. 4.2). To compute the ionization rate at a specific point (r,z) in the disk, the attenuation factor ) in eq. (1) must be calculated. It depends on the X-ray optical depth given by
| (4) |
where N⟂,disk(r,z) is the vertically-integrated column density from infinity down to the target height z above the diskplane (z = 0 at the midplane). Specifically,
| (5) |
where nH is the number density of hydrogen nuclei in the disk. N⟂,disk is less than the total column density between the X-ray source and the target point in the disk according to the relation N⟂,disk(r,z) = (Rx/r)NH,disk(r,z). At r = 1 AU one obtains Rx/r 0.03 for the adopted value Rx = 4 R∗ = 4.5 1011 cm.
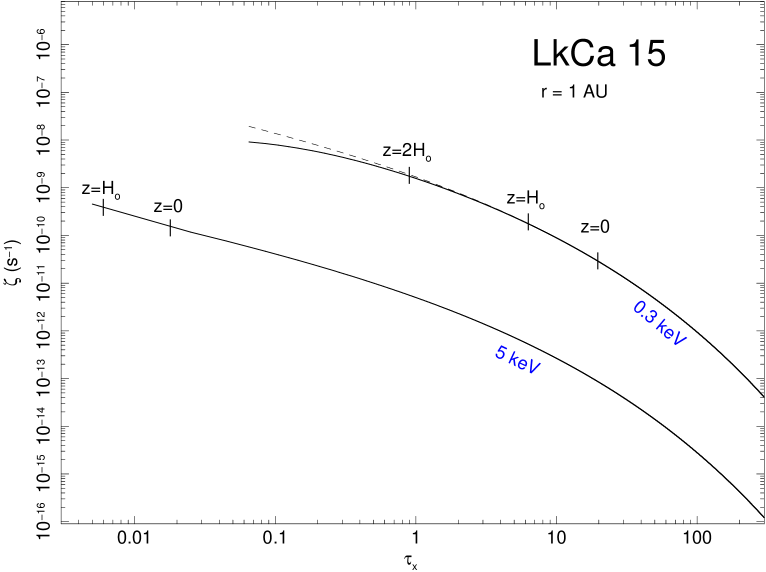
It is obvious from equations (3) and (4) that for the cool component at a given point in the disk will be much larger than the hot component because of its larger absorption cross-section. In other words, the hard component will be less-absorbed and penetrate further into the disk. Figure 3 plots as a function of at r = 1 AU for the cool and hot plasma components. To generate Figure 3, we have used eqs. (1) and (2) above and have evaluated the integral (eq. [C1] of S02)
| (6) |
for = E0/kTx and E0 = 0.1 keV using the asymptotic approximation g() where g() = /( ) and is given by eq. (C3) of S02. This approximation is accurate for optical depths where = . This expression gives = 6.5 10-2 for the kTx = 0.3 keV plasma component ( = 0.33) and = 6.05 10-5 for the kTx = 5 keV component ( = 0.02). The weighting function g() becomes small for . The effect of the low-energy cutoff E0 is to attenuate the incident X-ray spectrum at low energies, as might occur from wind absorption. Raising the cutoff energy increases the attenuation. The effect of applying the cutoff is to flatten the ionization curve at small , as is shown for the 0.3 keV plasma component in Figure 3.
To proceed further, we need to evaluate the attenutation factor over a range of X-ray optical depths for a specific disk model of LkCa 15. To compute (r,z,E) we must assume a disk density profile in order to calculate nH(r,z). We adopt a gasdust disk surface density (r = 1 AU) 10-3 g cm-2 based on the inner disk model shown in Figure 8 of A11a. This value, in combination with the disk scale height H(r), fixes the mass density at the disk midplane via the relation = (1/)/.
The disk mass density scales with radius (r) and height (z) as (eq. [5] of IG99)
| (7) |
In the above, the value of is determined from the assumed power-law form of the disk surface density profile (r) rq. Some typical values used in the literature are = 1.5 (IG99), = 1.0 (A11a), and = 0.72 (Isella et al. 2012). To compute the disk scale height H(r = 1 AU) H0 we assume a temperature T(r = 1 AU) 400 K based on the stellar effective temperature T∗ = 4730 K (Table 1) and a radial temperature dependence T(r) r-0.5. Vertical temperature gradients at a given radius can be ignored (IG99). The scale height H(r) = cs/ depends on the sound speed cs = , where is the adiabatic index, is the mean weight (amu) per particle, and mp is the proton mass. We have assumed that the hydrogen is mainly molecular at r = 1 AU ( = 1.4, = 2.3). If the hydrogen is mainly atomic then the sound speed and scale height are a factor of 1.13 larger than for the molecular case. The number density of H nuclei follows from the mass density as nH = /(mp). Table 4 summarizes the ionization rate at r = 1 AU at the disk midplane and at one scale height (z = H0 = 7.1 1011 cm) for the cool and hot components.
The X-ray heating rate per unit volume is proportional to the ionization rate and is given by (G12)
| (8) |
where is the heating rate per ionization. As discussed by G12, several different processes contribute to the heating rate including elastic collisions, excitation of rotational and vibrational levels, H2 dissociation, and chemical heating. The heating rate depends on the nature of the gas (i.e. atomic versus molecular). Assuming that the gas in the LkCa 15 disk at r 1 AU is predominantly molecular then the results of G12 for the range of densities of interest here (nH 105 - 108 cm-3; Table 4) give 15 - 18 eV. Representative heating rates are given in Table 4 based on an assumed value = 17 eV.
4.2 Scaling Relations
The above results can be extrapolated to larger radii using scaling relations: T(r) r-0.5, H(r) r+1.25 and (r) rq. The value of is in principle constrained by observations but its value in the inner disk region of LkCa 15 is not well-determined because of the inability of current (sub)millimeter telescopes to resolve the inner disk close to the star. The improved resolution now becoming available with ALMA offers the possibility of placing tighter observational constraints on conditions in the inner disk. The mass density scales as (r) rq-1.25 as does nH(r). As a representative case we take = 1.0, as for the inner disk model of A11a. Table 4 gives the ionization and heating rates in the disk midplane at the protoplanet distance r = 15 AU for the case = 1.0. Note that the vertical column density scales as N⟂,disk(r) rq, so the value = 1.0 results in a fortuitous cancellation that makes (r) independent of (eq. (3). The heating rate per unit volume = nH is easily scaled, being linear in all three parameters.
4.3 X-rays in the Low-Density Transition Disk
A few comments on the specific LKCa 15 case considered above are useful to compare with the analyses of generic TTS by G97a, S02, and IG99. These previous studies adopted a disk model based on properties of the minimum mass solar nebula with a surface density (r = 1 AU) 103 g cm-2. In sharp contrast, the inner region of the disk surrounding LkCa 15 has a surface density (r = 1 AU) 10-3 g cm-2, about 6 orders of magnitude lower than that of the minimum mass solar nebula (Fig. 8 of A11a). Consequently, the number density nH at r = 1 AU is much less, being of order nH 108 cm-3 near the midplane (Table 4).
The low-density environment of the inner disk of LkCa 15 has two important consequences. First, the X-ray optical depth at a given radius and energy is much less than would be the case in the minimum mass solar nebula, allowing X-rays to penetrate deeper into the inner regions of the LkCa 15 disk. As Table 4 and Figure 3 show, the hard X-ray component has 0.02 at the midplane (r = 1 AU) so most of the incident flux of E = 5 keV photons at r = 1 AU penetrates all the way to the midplane. At such low optical depths, the hard photons can even pass through the entire disk without being absorbed. By contrast, the soft component has 20 at the midplane so only a small fraction of the incident E = 0.3 keV photons reaches the midplane. However, = 1 for the cool 0.3 keV component occurs at z = 1.95 H0 (r = 1 AU) and even at z = H0 the ionization rates of the cool and hot components are nearly the same (Fig. 3 and Table 4). Thus, in the higher disk layers the effects of the cool component are not negligible. Second, the heating rate (eq. 8) is lower in the low-density inner disk of LkCa 15 than in denser disk environments because there are fewer atoms to absorb the X-ray photons. Since nH r-2.25 (assuming = 1.0), the particle density falls off rapidly and the X-ray heating rate is quite low at the distance of the protoplanet r 15 AU (Table 4).
5 Summary
The Chandra X-ray data analyzed here reveal that LkCa 15 is a more luminous X-ray source than previously assumed on the basis of the ROSAT All-Sky Survey non-detection and is capable of significantly influencing physical conditions in the inner low-density region of the transition disk. The X-ray emission is described by a cool component at temperature kT1 0.3 keV and a hotter component at kT2 5 keV. Although the harder 5 keV component is able to penetrate further into the disk, the effects of the cool component must also be taken into account at higher disk layers z H0. The X-ray properties determined here provide valuable input data for more sophisticated models of the LkCa 15 disk based on radiative transfer calculations (e.g. IG99; Nomura et al. 2007). Such detailed models would need to consider effects such as X-ray scattering, possible abundance variations within the disk (G97a), UV radiation, mechanical and viscous heating, and cosmic rays. Previous studies (IG99; Dolginov & Stepinski 1994) suggest that cosmic ray ionization will be less important than X-ray ionization at the relatively low midplane vertical column densities N⟂,disk 1020 cm-2 estimated for the LkCa 15 transition disk. In addition, the short Chandra observation discussed here needs to be followed up by further time monitoring to determine if LkCa 15 undergoes large X-ray flares. If so, the X-ray luminosity and temperature of the hot component could significantly exceed the values adopted here for brief periods of time (hours to days), leading to punctuated increases in ionization and heating rates.
References
- (1) Anders, E., & Grevesse, N. 1989, Geochim. Cosmochim. Acta, 53, 197
- (2) Andrews, S.M. et al. 2011a, ApJ, 732, 42 (A11a)
- (3) Andrews, S.M., Rosenfeld, K.A., Wilner, D.J., & Bremer, M. 2011b, ApJ, 742, L5 (A11b)
- (4) Balbus, S.A. & Hawley, J.F. 1991, ApJ, 376, 214
- (5) Dolginov, A.Z. & Stepinski, T.F. 1994, ApJ, 427, 377
- (6) Espaillat, C. et al. 2010, ApJ, 717, 441
- (7) Glassgold, A.E., Galli, D., & Padovani, M. 2012, ApJ, 756, 157 (G12)
- (8) Glassgold, A.E., Najita, J., & Igea, J. 1997a, ApJ, 480, 344 (G97a)
- (9) Glassgold, A.E., Najita, J., & Igea, J. 1997b, ApJ, 485, 920
- (10) Glassgold, A.E., Najita, J., & Igea, J. 2004, ApJ, 615, 972
- (11) Gorenstein, P., 1975, ApJ, 198, 95
- (12) Gregory, P.C., & Loredo, T.J., 1992, ApJ, 398, 146
- (13) Gregory, P.C., & Loredo, T.J., 1996, ApJ, 473, 1059
- (14) Güdel, M. et al. 2007, A&A, 468, 353
- (15) Igea, J. & Glassgold, A.E. 1999, ApJ, 518, 848 (IG99)
- (16) Isella, A., Pérez, L.M., & Carpenter, J.M. 2012, ApJ, 747, 136
- (17) Kenyon, S.J. & Hartmann, L. 1995, ApJS, 101, 117
- (18) Kraus, A.L. & Hilenbrand, L.A. 2009, ApJ, 704, 531
- (19) Kraus, A.L. & Ireland, M.J. 2012, ApJ, 745, 5 (KI12)
- (20) Neuhäuser, R., Sterzik, M.F., Schmitt, J.H.M.M., Wichmann, R., & Krautter, J. 1995, A&A, 297, 391
- (21) Nomura, H., Aikawa, Y., Tsujimoto, M., Nakagawa, Y., & Millar, T.J. 2007, ApJ, 661, 334
- (22) Nguyen, D.C., Brandeker, A., van Kerkwijk, M.H., & Jayawardhana, R.J. 2012, ApJ, 745, 119
- (23) Owen, J.E., Ercolano, B., Clarke, C.J., & Alexander, R.D. 2010, MNRAS, 401, 1415
- (24) Piétu, V., Dutrey, A., & Guilloteau, S. 2007, A&A, 467, 163
- (25) Scelsi, L., Maggio, A., Micela, G., Briggs, K., & Güdel, M. 2007, A&A, 473, 589
- (26) Shang, H., Glassgold, A.E., Shu, F.H., & Lizano, S. 2002, ApJ, 564, 853 (S02)
- (27) Piétu, V., Dutrey, A., & Guilloteau, S. 2007, A&A, 467, 163
- (28) Simon, M., Dutrey, A., & Guilloteau, S. 2000, ApJ, 545, 1034
- (29) Smith, R.K., Brickhouse, N.S., Liedahl, D.A., & Raymond, J.C. 2001, ApJ, 556, L91
- (30) Telleschi, A., Güdel, M., Briggs, K.R., Audard, M., & Palla, F. 2007, A&A, 468, 425
- (31) Vuong, M.H., Montmerle, T., Grosso, N., Feigelson, E.D., Verstraete, L., & Ozawa, H. 2003, A&A, 408, 581
- (32) Williams, J.P. & Cieza, L.A. 2011, ARA&A, 49, 67
| Type | Age | M∗ | R∗ | Teff | L∗ | Mdisk | AV | d | ||
|---|---|---|---|---|---|---|---|---|---|---|
| (My) | (M⊙) | (R⊙) | (K) | (L⊙) | (M⊙) | (M⊙/yr) | (deg.) | (mag) | (pc) | |
| K5 | 2 [1 - 4] | 1.0 | 1.6 | 4730 | 0.74 - 1.2 | 0.055 | 2 10-9 | 51 | 1.3 - 1.7 | 140 |
Note. — Data are from Kenyon & Hartmann 1995; Simon et al. 2000; Piétu et al. 2007; Espaillat et al. 2010; Andrews et al. 2011a,b; Kraus & Hillenbrand 2009; Isella et al. 2012; Kraus & Ireland 2012.
| Name | R.A. | decl. | Net Counts | E50 | Pconst | log Lx | Identification(offset) |
|---|---|---|---|---|---|---|---|
| (J2000) | (J2000) | (cts) | (keV) | (ergs s-1) | (arcsec) | ||
| LkCa 15 | 04 39 17.793 | 22 21 03.28 | 590 24 | 1.01 | 0.91 | 30.4 | GSC J043917.787222103.26 (0.08) |
Note. — The nominal pointing position for the observation was (J2000.0) RA = 04h 39m 18.52s, decl. = 22∘ 20′ 49′′.1, which lies 17′′.5 SE of LkCa 15. X-ray data are from CCD7 (ACIS chip S3) using events in the 0.2 - 8 keV range inside a circular source extraction region of radius 1′′.5. Tabulated quantities are: J2000.0 X-ray position (R.A., decl.), total source counts accumulated in a 9813 s exposure, median photon energy (E50), probability of constant count-rate determined by the Gregory-Loredo algorithm (Pconst); unabsorbed X-ray luminosity (0.3 - 10 keV; see also Table 3), and HST GSC v2.3.2 counterpart identification. The offset (in parenthesis) is given in arc seconds between the X-ray and GSC counterpart position.
| Parameter | |||
|---|---|---|---|
| ModelaaModels A, B, and C are of form: NH(kT1 kT2) | A | B | C |
| Emission | Thermal (2T) | Thermal (2T) | Thermal (2T) |
| Abundances | solarbbFor thermal models, the norm is related to the volume emission measure (EM = nV) by EM = 41014dnorm, where dcm is the stellar distance in cm. At d = 140 pc, this becomes EM = 2.341056 norm (cm-3). | non-solarccThe global metallicity Z was allowed to vary. Z = 1.0 corresponds to solar abundances. | non-solarddAbundances were held fixed at typical values for TTS in Taurus (Güdel et al. 2007; Scelsi et al. 2007). These are (relative to solar): H = 1.0, He = 1.0, C = 0.45, N = 0.79, O = 0.43, Ne = 0.83, Mg = 0.26, Al = 0.50, Si = 0.31, S = 0.42, Ar = 0.55, Ca = 0.195, Fe = 0.195, Ne = 0.195. |
| NH (1022 cm-2) | 0.77 [0.63 - 0.88] | 0.76 [0.57 - 0.87] | 0.37 [0.24 - 0.51] |
| kT1 (keV) | 0.18 [0.15 - 0.24] | 0.18 [0.15 - 0.24] | 0.30 [0.25 - 0.37] |
| kT2 (keV) | 4.86 [3.16 - 10.5] | 4.25 [2.65 - 9.00] | 5.11 [3.00 - 13.6] |
| norm1 (10-2)bbFor thermal models, the norm is related to the volume emission measure (EM = nV) by EM = 41014dnorm, where dcm is the stellar distance in cm. At d = 140 pc, this becomes EM = 2.341056 norm (cm-3). | 0.67 [0.17 - 2.04] | 1.28 [0.26 - 6.80] | 0.08 [0.04 - 0.19] |
| norm2 (10-4)bbFor thermal models, the norm is related to the volume emission measure (EM = nV) by EM = 41014dnorm, where dcm is the stellar distance in cm. At d = 140 pc, this becomes EM = 2.341056 norm (cm-3). | 1.55 [1.24 - 1.86] | 1.82 [1.09 - 2.56] | 1.58 [1.23 - 2.04] |
| Z (Z⊙) | {1.0} | 0.46 [0.13 - …] | … |
| /dof | 44.2/42 | 43.4/41 | 41.9/42 |
| 1.05 | 1.06 | 1.00 | |
| FX (10-12 ergs cm-2 s-1) | 0.34 (11.6) | 0.32 (10.9) | 0.32 (1.07) |
| FX,1 (10-12 ergs cm-2 s-1) | 0.15 (11.3) | 0.15 (10.6) | 0.18 (0.25) |
| FX,2 (10-12 ergs cm-2 s-1) | 0.19 (0.30) | 0.17 (0.30) | 0.14 (0.81) |
| log LX (ergs s-1) | 31.43 | 31.41 | 30.40 |
| log LX,1 (ergs s-1) | 31.42 | 31.39 | 29.77 |
| log LX,2 (ergs s-1) | 29.85 | 29.85 | 30.28 |
| log [LX/Lbol] | 2.15 | 2.18 | 3.18 |
Note. — Based on XSPEC (vers. 12.7.1) fits of the background-subtracted ACIS-S spectrum binned to a minimum of 10 counts per bin using 9,813 s of exposure time. The fits for models A and B were obtained using an absorbed optically plasma model and model C used a similar absorbed model that allows the abundance of each element to be specified. The tabulated parameters are absorption column density (NH), plasma energy (kT), and XSPEC component normalization (norm). Solar abundances are referenced to Anders & Grevesse (1989). Square brackets enclose 90% confidence intervals and an ellipsis means that the algorithm used to compute confidence intervals did not converge. Quantities enclosed in curly braces were held fixed during fitting. The total X-ray flux (FX) and fluxes associated with each model component (FX,i) are the absorbed values in the 0.3 - 10 keV range, followed in parentheses by unabsorbed values. The total X-ray luminosity LX and luminosities of each component LX,i are unabsorbed values in the 0.3 - 10 keV range and assume a distance of 140 pc. A value Lbol = 1.0 L⊙ is adopted based on an average of values given in the literature.
| r | z/H(r) | nH | E | ||||
|---|---|---|---|---|---|---|---|
| (AU) | (cm-3) | (keV) | (s-1) | (s-1) | (ergs s-1 cm-3) | ||
| 1 | 0 | 1.46e8 | 0.3 | 19.8 | 2.23e-06 | 2.87e-11 | 1.14e-13 |
| 1 | 0 | 1.46e8 | 5.0 | 0.018 | 3.97e-10 | 1.49e-10 | 5.92e-13 |
| 1 | 1 | 0.88e8 | 0.3 | 6.3 | 2.23e-06 | 1.76e-10 | 4.21e-13 |
| 1 | 1 | 0.88e8 | 5.0 | 0.006 | 3.97e-10 | 3.98e-10 | 9.53e-13 |
| 15 | 0 | 3.30e5 | 0.3 | 19.8 | 2.23e-06 | 1.28e-13 | 1.15e-18 |
| 15 | 0 | 3.30e5 | 5.0 | 0.018 | 3.97e-10 | 6.63e-13 | 5.95e-18 |
Note. — Based on inner disk model discussed in text with surface density profile (r) r-1 and (r = 1 AU) = 10-3 g cm-2. Disk scale heights are H(r = 1 AU) = 7.1 1011 cm and H(r = 15 AU) = 2.1 1013 cm assuming molecular hydrogen gas and temperatures T(r = 1 AU) 400 K and T(r = 15 AU) 100 K. Solar abundances are assumed in the disk. X-ray luminosities and temperatures used to compute the primary ionization rate are given in Table 3 (model C). The X-ray source is assumed to be located at a height of 4 R∗ = 6.4 R⊙ above the disk center. The heating rate = nH assumes Q = 17 eV but the value of is dependent on gas properties (G12).