18
Pygmy and giant electric dipole responses of medium-heavy nuclei in a self-consistent Random Phase Approximation approach with finite-range interaction
Abstract
The pygmy dipole resonance (PDR) is studied in various medium-heavy nuclei by using a Gogny interaction in a self-consistent Hartree-Fock plus Random Phase Approximation method. We compare the details of the PDR structure with those of the giant dipole resonance (GDR). In the PDR protons and neutrons vibrate in phase, and the main contributions are given by particle-hole excitations involving the neutrons in excess. On the contrary, in the GDR protons and neutrons vibrate out of phase, and all the nucleons are involved in the excitation. The values of the parameters we used to define the collectivity of an excitation indicate that the PDR is less collective than the GDR. We also investigate the role of the residual interaction in the appearance of the PDR and we find a subtle interplay with the shell structure of the nucleus.
I Introduction
The pygmy dipole resonance (PDR) is an electric dipole excitation located at energies close to the nucleon emission threshold, and called pygmy since its strength is much smaller than that of the well studied giant dipole resonance (GDR) paa07 ; kre09 . The reasons of the interest in the presence of the PDR can be grouped in three categories.
A first type of motivations is related to nuclear astrophysics. The presence of a PDR in neutron rich nuclei, would increase the neutron capture cross section by orders of magnitude gor98 ; dao12 , and, consequently, also the rate of nucleosynthesis r-process. This effect could clarify the present discrepancy between simulations and observed abundance of medium-heavy nuclei in the solar system arn07 .
A second type of reasons inducing the interest in the PDR is due to the relation between the presence of this resonance and the nuclear matter symmetry energy, and consequently, the connection with the neutron skin, the static dipole polarizability and the values of the Landau’s parameters of the effective nucleon-nucleon interaction boh81 ; kri82 ; car10 ; rei10 ; ina11 .
Finally, the third set of reasons to be interested in the PDR is related to a genuine curiosity about this new type of nuclear excitation. There are many aspects of this excitation to be clarified. For example, if the PDRs are present in all the medium and heavy nuclei or if this type of excitation is peculiar of neutron rich nuclei only. Another question to be answered is whether these resonances are the low energy tail of the GDR or if they represent a different type of excitation. It also remains to be clarified if the PDRs are produced by collective nuclear motions or if they are generated by single particle (s.p.) excitations related to the specific shell structure of nuclei with neutron excess, i.e. .
Our work has been mainly inspired by this last type of motivations. We have investigated the presence and the structure of the PDR in various medium-heavy nuclei, representative of different regions of the nuclear chart. The theoretical tool we have used in our study is the Random Phase Approximation (RPA) theory.
The first results of our study have been presented in Ref. co09b where we used a phenomenological RPA approach. The s.p. basis was generated by using a Woods-Saxon well. The parameters of this well were fixed, for each isotope chain, in order to reproduce some empirical properties of the most investigated doubly magic nucleus of the chain. This implied that s.p. wave functions and energies were the same for each isotope of the chain. The effective nucleon-nucleon interaction used in those RPA calculations was a density dependent zero-range Landau-Migdal force, whose parameters were chosen to reproduce the energies of the low-lying states and the centroid energies of the GDR in 16O, 40Ca and 208Pb nuclei. The main result of that investigation was the observation of dipole strength at energies lower than those of the GDR that increased with the neutron excess. In that region proton and neutron dipole transition densities were in phase, while they were out of phase in the GDR region.
From the theoretical point of view the main limitations of the previous investigation were the large number of parameters to be selected, and the rigid use of a s.p. basis within a given set of isotopes. We overcome these difficulties in the present study by adopting a self-consistent Hartree-Fock (HF) plus RPA approach. The effective interaction used in HF calculations to generate the s.p bases is also used in the RPA calculations.
Recently, we have proposed two parametrizations of the finite-range Gogny interaction containing also tensor terms ang11 ; ang12 . However, since the presence of these terms is relevant only in magnetic excitations co12b , in the present study we used the well tested D1S dec80 and the more modern D1M gor09 Gogny forces that do not include tensor terms. The parameters of these two interactions have been selected to reproduce some global nuclear properties, therefore each interaction is built to be used to investigate every nucleus in each region of the nuclear chart. Contrary to what has been done in Ref. co09b , in the present approach each nucleus has its own s.p. basis. The two parametrization produce similar results whose differences are not large enough to induce to different conclusions. For this reason we have restricted our presentation to the results obtained with the D1M parametrization only.
For our investigation we have selected a variety of nuclei with closed sub-shells and, therefore, with spherical symmetry. In this way, not only, we have avoided deformation problems, but we have also minimized the eventual pairing effects. We have chosen isotope chains containing at least a nucleus where experimental evidence of presence of PDR has been found: 22O lei01 , 48Ca har04 , 68Ni wie09 , 132Sn adr05 and 208Pb rye02 ; pol12 .
II The model
The first step of our procedure consists in constructing the s.p. basis by solving the HF equations. The technical details concerning the solution of the HF equations can be found in Refs. co98b ; bau99 . In the second step, the wave functions obtained in the HF calculation are used to solve the RPA equations by considering, without approximations, the fact that the main part of the s.p. wave functions above the Fermi surface lies in the continuum. We have labeled continuum RPA (CRPA) the results obtained in these calculations. The technique used to solve the CRPA equations, which takes care of both direct and exchange matrix elements in the RPA, is based on expansions on a basis of Sturm-Bessel functions. The details of this approach can be found in Refs. don08t ; don11a . The number of the integration points and of the Sturm-Bessel functions to be used is easily determined by observing the numerical stability of the results (see don08t ; don11a ). Apart from that, CRPA calculations are parameter free because the interaction is fixed.
Unfortunately, CRPA calculations have two drawbacks. A first one is that the CRPA equations are formulated with very involute expressions which make very difficult to disentangle the role of the various ingredients of the calculations, for example the relevance of specific particle-hole (p-h) excitations. The second problem is that the calculations are numerically very involved and, for large nuclei our technique suffers of numerical instability. For these reasons, together with the CRPA calculations, we carried out RPA calculations where only a discrete set of s.p. wave functions is used. We call discrete RPA (DRPA) this last type of calculations. The discrete configuration space is obtained in the HF calculation when the iterative procedure has reached the minimum value of the binding energy. At this point, we calculate the s.p. wave functions for all the states below the Fermi surface, the hole states, and those for a large number of states above it, the particle states. This calculation is done by assuming that the system is confined in a spherical box with infinite walls.
As it is traditionally done rin80 , in this DRPA approach the secular equations written in matrix form are solved by diagonalizing the RPA matrix. The dimensions of this matrix are given by the number of the p-h pairs contributing to the excitation. Therefore, the results of these DRPA calculations depend on both the size of the box considered for the HF calculations and the number of particle states composing the configuration space. The choice of the values of these two parameters has been done by controlling the centroid energies of the giant dipole responses. We have chosen a box radius of 30 fm for the calculations in oxygen, calcium and nickel isotopes, of 40 fm for zirconium and tin isotopes, and of 45 fm for lead. For all the nuclei, but 208Pb, we have selected a configuration space such as the maximum p-h excitation energy is 100 MeV. For 208Pb this would have generated matrices with too large dimensions, therefore we have chosen a maximum value of 60 MeV. We have taken care that the centroid energies did not change by more than 0.5 MeV when either the box size, or the configuration space were enlarged.
In our self-consistent HF plus RPA approach, the spurious center of mass motion, showing up as an isoscalar 1- excitation, should appear at zero energy row70 . This is what happens in the CRPA calculations where we do not observe any effect due to the presence of this spurious excited state. On the contrary, this spurious state is present in all our DRPA results. This is due to the truncation of the configuration space. In the great majority of the cases we have investigated this state is easily identifiable and is well isolated form the other ones. On the other hand, we observe that for the 28O, 48Ni 100Sn and 208Pb nuclei the spurious state appearing in the range 1.5–3.0 MeV is mixed with other excited states. In the DRPA results which will be presented in the next section, the spurious states have been eliminated by hand. In the study of the isoscalar excitations, and of the transition densities, we subtracted the contribution of the spurious state by using the prescriptions of Refs. van81 and roc12 and we found that, from the quantitative point of view, the two procedures are equivalent. In any case, a comparison with the transition densities obtained without the subtraction of the spurious states does not show numerically relevant differences.
III Results and discussion
III.1 Comparison between CRPA and DRPA
The nuclei we have considered are listed in Table 1. As already pointed out, in these nuclei, the s.p. levels are fully occupied, and this implies a spherical shape. Furthermore, the pairing effects are negligible. These features are confirmed by the deformed Hartree-Fock-Bogolioubov calculations of Refs. hil07 ; del10 .
| 16O | 15.5 | 13.71 | 25.11 | |||
| 22O | 15.0 | 8.94 | 24.22 | |||
| 24O | 13.5 | 6.85 | 21.42 | |||
| 28O | 12.0 | 7.32 | 19.32 | |||
| 40Ca | 13.0 | 12.49 | 21.16 | |||
| 48Ca | 12.0 | 11.12 | 21.72 | |||
| 52Ca | 11.0 | 8.73 | 18.61 | |||
| 60Ca | 11.0 | 9.07 | 18.54 | |||
| 48Ni | 12.0 | 10.52 | 19.06 | |||
| 56Ni | 13.5 | 13.08 | 18.95 | |||
| 68Ni | 12.0 | 10.93 | 18.05 | |||
| 78Ni | 11.5 | 10.60 | 18.90 | |||
| 90Zr | 12.5 | 11.60 | 17.61 | |||
| 100Sn | 11.0 | 10.74 | 17.12 | |||
| 114Sn | 11.0 | 10.16 | 19.32 | |||
| 116Sn | 12.0 | 8.90 | 16.47 | |||
| 132Sn | 11.0 | 9.01 | 16.50 | |||
| 208Pb | 10.0 | 8.34 | 14.47 |
In Ref. co12a , we used the oxygen, calcium, nickel and tin isotopes indicated in Table 1 to compare the results obtained with various microscopic mean-field models describing their ground states. We found a remarkable agreement between the results obtained with our HF approach and those generated by Skyrme HF and relativistic Hartree calculations.
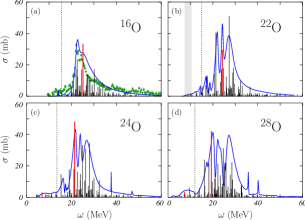
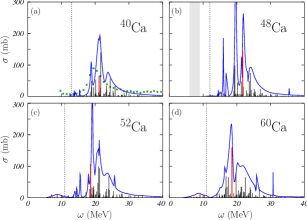
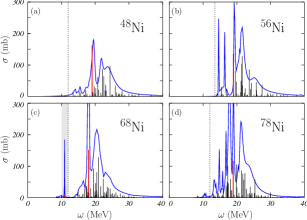
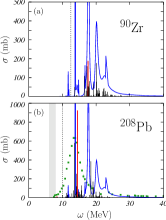
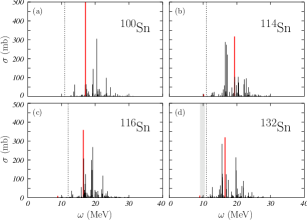
We show in Figs. 1-5 the total photoabsorption cross sections obtained in our calculations of the dipole responses. In these figures the vertical bars show the results obtained with DRPA. For all the isotopes lighter than tin, we show with solid blue lines the cross section obtained with CRPA. As explained above, for the four tin isotopes (Fig. 5) and also for 208Pb (Fig. 4b) we have DRPA results only.
For 16O, 40Ca and 208Pb nuclei we compare the results of our calculations with the experimental data of Ref. ahr75 . This comparison emphasizes the well known merits and faults of the RPA calculations in the description of the giant resonances spe91 ; bor98 ; har01 . The presence of a peak generated by the collective excitation of the nucleus is predicted by our calculations. The position of the main peaks is reasonably well reproduced. The CRPA centroid energies for 16O and 40Ca are 24.8 and 22.0 MeV to be compared with the experimental values of 22.9 and 20.0 MeV respectively. In 208Pb the DRPA centroid energy is 15.84 MeV and the experimental value is 14.7 MeV. Since in these calculations the position of the GDR is dominated by the isospin dependent part of the interaction deh82 ; co85 , these discrepancies may indicate that this term of the D1M interaction is too strong.
The RPA calculations satisfy the energy weighted sum rule, which can be calculated by integrating the cross sections presented in the figures. For the 16O, 40Ca and 208Pb nuclei we obtained the values of 336, 834 and 4420 mb MeV, respectively. These values should be compared with those obtained by using the Thomas-Reiche-Khun (TRK) sum rule corrected by the enhancement factor related to the isospin-dependent, and eventually tensor, terms, of the interaction used. The enhancement factors should be calculated for each nucleus considered. For the purposes of the present paper we used a simple estimation based on the values published in Ref. tra87 . In the case of the D1M interaction we have used a value of 0.51. The TRK values corrected for this enhancement factor are 360, 900, and 4470 mb MeV for 16O, 40Ca and 208Pb, respectively, indicating a reasonable agreement with the CRPA values.
The CRPA calculations consider only the escape width of the resonance and do not take into account the spreading width. As a consequence of this fact we observe that the strength is too concentrated in the resonance region. This drawback becomes more important the heavier is the nucleus when the second type of width dominates. We observe a reasonable agreement in 16O, but in 40Ca the width of the resonance is not correctly reproduced. This feature has been discussed in more detail in Ref. don11a .
We want to discuss the reliability of the DRPA results as compared to the CRPA ones. This comparison is important to have confidence on the DRPA results in lead and tin isotopes where we could not perform CRPA calculations. The results shown in Figs. 1-5 indicate a good agreement between the position of the peaks in the two types of calculations.
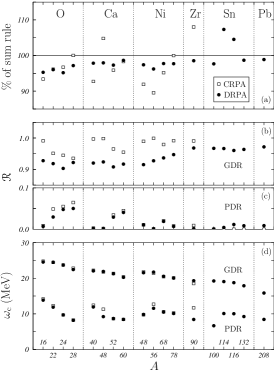
We have calculated the sum rule exhaustion of both types of calculations for all the nuclei, and we present them in the panel (a) of Fig. 6. The important information given in this figure is the comparison between results of the CRPA, open squares, and those obtained in DRPA calculations, full circles. To simplify the presentation, these values are divided by the TRK values corrected with the unique 0.51 enhancement factor. The scale of the figure emphasizes the differences between CRPA and DRPA results, but we observe that most of our results are within a range of 5% around the expected theoretical values. The largest deviations between CRPA and DRPA results are found in the double-closed shell nuclei 40Ca, 40Ca, 48Ni, 56Ni and 90Zr. Also in these cases, however, the differences are at most 10%.
The behaviour of the DRPA values seems more regular than that of the CRPA results. Remarkable deviations from this behaviour are shown by the 114Sn and 116Sn nuclei. It is possible that, in these cases, shell effects are important in the evaluation of the enhancement factors.
We further carried on the comparison between the CRPA and DRPA results by separately analyzing the pygmy and the giant resonance regions. For this reason, we divide the dipole response in two regions representative of the PDR and GDR. The values of the energies that separate these two regions, , are given in Table 1 for all the isotopes studied, and are indicated by the vertical dotted lines in Figs. 1-5. We checked that the values of the quantity
| (1) |
calculated with CRPA and DRPA were approximately the same in each of the two regions, obviously for all those isotopes where the CRPA calculations have been done. In our approach, the value is calculated as
| (2) |
where the relation with the usual and RPA amplitudes is given by
| (3) |
In the above equation, we used the common definition of the effective charge for the electric dipole excitation
| (4) |
The p-h transition density is defined as
| (5) |
where indicates the radial part of the s.p. wave function, is the total angular momentum and we have used the traditional symbol to indicate the Wigner 3-j coefficient. The above expression has been obtained by using the angular momentum coupling.
In Eq. (1) we used and for the PDR, while for the GDR region we used and 40 MeV for the oxygen isotopes and 30 MeV for all the other nuclei. The results of our calculations are shown in the panels (b) and (c) of Fig. 6 for GDR and PDR, respectively. The values obtained with CRPA are indicated by the open squares, and those obtained with DRPA by the full circles. We remark a good agreement between these results.
We further tested the reliability of the DRPA results as compared to the CRPA ones, and also the validity of our choices in selecting the values, by calculating the centroid energies of the two regions, with the usual expression
| (6) |
The values obtained are shown in the panel (d) of Fig. 6. We find, again, a good agreement between the results of the two calculations.
III.2 Photoabsorption cross sections
The photoabsorption cross sections for the four oxygen isotopes we have selected are shown in Fig. 1. In 16O the number of protons and neutrons is the same. When the number of neutrons increases, also the strength below increases. This is also evident in the panel (c) of Fig. 6, where it can be seen how the ratio , calculated for the PDR region, increases with the number of neutrons for the oxygen isotopes. In any case, the maximum value of is around 5% of the total strength.
The gray area in panel (b) of Fig. 1 indicates the region empirically identified as PDR in Ref. lei01 . We observe that the value of is compatible with these experimental findings.
We show in Fig. 2, the results for the calcium isotopes. Also in this case, we observe that the presence of dipole strength in the low energy region, below , increases together with the neutron number. This is evident by observing the behavior of in the panel (c) of Fig. 6 which increases up to a maximum value of about 5% for 60Ca.
The PDR region empirically identified in Ref. har04 in the 48Ca (see panel (b) of Fig. 2) is lying at energies smaller than those predicted by our model. We remark, however, that we do not observe much PDR strength in 48Ca. The corresponding value of in the panel (c) of Fig. 6 is smaller than 1%. As we mentioned in the Introduction, we have carried out the same calculation with the D1S interaction, and obtained similar results. This indicates that the discrepancy with the observed PDR strength should not be attributed to some specific features of the interaction. The most probable source of this discrepancy is related to the intrinsic limitations of the RPA calculations, specifically to the fact that only one particle-one hole (1p1h) configurations are considered. In fact, the RPA results shown in Ref. har04 , are similar to ours, while some dipole strength appears at low energies when configurations beyond 1p1h were considered within the framework of the extended theory of finite Fermi systems kam04 . The relevance of effects beyond RPA in the PDR region has been confirmed by the self-consistent second RPA results of Ref. gam11 , obtained with a Skyrme interaction.
We show in Fig. 3 the results for the nickel isotopes. Also in this case, we observe features analogous to those found in the two previous figures. We should remark that 48Ni has a neutron deficit, and 56Ni is the isotope with the same number of protons and neutrons. In the latter isotope the PDR strength is almost negligible.
The energy range of the empirical PDR in 68Ni wie09 includes the very sharp peak at 10.93 MeV, which identifies the pygmy region. In the case of the nickel isotopes, the relation between the appearance of a PDR and the increase of the neutron number is not any more as straightforward as in the previous cases as it is shown in the panel (c) of Fig. 6. The shell structure of each individual isotope plays a remarkable role.
We show in Fig. 4 the results for 90Zr and 208Pb. The nucleus 90Zr is the heaviest isotope where we could perform our CRPA calculations without losing numerical accuracy. We observe again a good agreement with the DRPA results. There is dipole strength below carrying slightly less than 2% of the total strength.
As already mentioned before, for the 208Pb nucleus we performed only DRPA calculations. We have already commented that in this nucleus the spreading width is more important than the escape width, this latter one well described by the CRPA theory. In analogy to what we found for the 48Ca nucleus, the pygmy strength empirically identified rye02 is lying in a region where our calculations do not predict relevant dipole strength. On the contrary, self-consistent RPA calculations where Skyrme interactions are used find remarkable strength in this region roc12 ; lan11 . In 208Pb the excitations beyond RPA are even more important than in 48Ca.
We conclude this general view of the RPA dipole strengths by discussing the results obtained for the tin isotopes and shown in Fig. 5. Our calculations have been done with DRPA only. Also in this case, we observe an increase of the pygmy strength with increasing neutron number. However, the relative contribution of the PDR with respect to the global strength is of the order of 1-2%, as can be seen in panel (c) of Fig. 6. The empirical PDR region identified in the 132Sn nucleus adr05 includes some of the strength found in our DRPA calculations.
III.3 Collectivity of the resonances
One of the main questions concerning the structure of the PDR is up to which extent it can be considered as a collective excitation of the nucleus. The identification of the parameters which can define the degree of collectivity is not an easy task. In a RPA approach one should consider parameters related to the number of the p-h pairs participating to the excitation, and also to the degree of coherence of the excitation.
In DRPA, the and amplitudes of a given excited state at energy must verify the normalization relation
| (7) |
where indicates the total number of p-h excitations. To estimate the collectivity of a DRPA excited state we used the ratio co09b
| (8) |
where is the number of p-h configurations such as
| (9) |
The two extreme values of are 1 in the fully collective case, and when the excitation is produced by a single p-h pair.
To study the relative contribution of protons and neutrons to the excitation, we have also considered the index
| (10) |
which indicates the contribution of the neutron p-h pairs to the normalization given in Eq. (7).
These two indexes are related to the relevant number of p-h pairs in the excitation of the resonance. In order to clarify the degree of collectivity it is important to consider also the coherence of the excitation, as pointed out in Ref. lan09 . To this purpose we have defined the index
| (11) |
The second term of the above expression calculates the value of that would be obtained if all the contributions of the various p-h pairs would add coherently. The maximum, and global, coherence of the RPA p-h pairs provides .
In the present study, we have averaged the indexes , , and in both the pygmy and giant regions by using the expression:
| (12) |
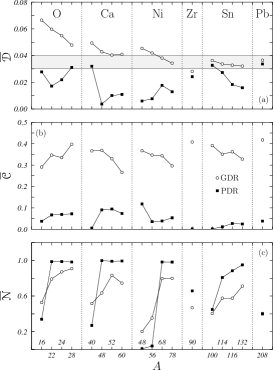
where, for each region, and have been defined in Sect. III.1 and the values are given in Table 1. In Fig. 7 we show the indexes , , and calculated for both the giant (open circles) and pygmy (solid squares) regions. In the figure, the lines joining the symbols have been drawn to guide the eyes.
The values of depend on the dimension of the s.p. configuration space, therefore a comparison among the different nuclei is not very meaningful. On the other hand, the comparison of the results obtained in the same nucleus is relevant. The important result is that, as we observe in panel (a) of Fig. 7, the values of for the GDR are always larger than those obtained in the pygmy region.
To have an indication of the degree of collectivity we have calculated the value of , Eq. (8), for the collective low-lying states of the 16O, 40Ca, 132Sn and 208Pb nuclei. The gray band gives the upper and lower bounds of these values. While the values of for the GDRs are always larger, or compatible, with the band, those of the PDRs are usually smaller, with the exceptions of the 28O, 40Ca, 100Sn and 208Pb, where they are inside the band.
We show in the panel (b) of Fig. 7 the values we obtained for . For the states mentioned above, the values of are larger than 0.9, well above than the values obtained for the GDR that, on the other hand, are always larger than those related to the PDR. The combined results of and indicate that the PDRs are less collective than the GDRs.
We show in the panel (c) of Fig. 7 the values of for the PDR and GDR regions. In the GDR case (see open circles), we found the values of between 0.2 and 0.8, with the only exceptions of the 24O and 28O nuclei which have larger values. This fact indicates that, in general, both protons and neutrons contribute to the excitation of the GDR. Each nucleus has its own peculiarities according to the closure of the neutron shells. In general, in nuclei with neutrons in excess, the neutron contribution is larger than that of the protons. The situation changes for the PDR (see full squares). In this case, all the nuclei with neutron excess, except 90Zr and 208Pb, show values of close to 1. We observe few cases where the values for the GDR are larger than for the PDR. This happens for the nuclei 16O, 40Ca, 56Ni and 100Sn, and for the nucleus 48Ni.
III.4 Transition densities
The DRPA calculation allows a detailed study of the p-h structure of each excited state. We have exploited this feature by calculating the dipole transition density
| (13) |
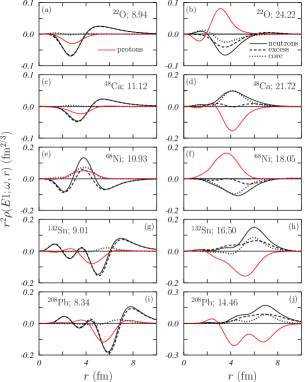
where is given in Eq. (5). The calculations have been done for those states that were selected to characterize the pygmy and giant regions. The excitation energies of these states, and , are listed in Table 1, and the related photoabsorption cross sections are indicated by the red vertical lines in Figs. 1-5.
In Fig. 8 we present the dipole transition densities, multiplied by , for those nuclei with an empirical indication of PDR. Similar results have been found for all the other nuclei we have considered. In the figure, the solid red and black lines have been obtained by considering only the contribution to the p-h sum in Eq. (13) of the protons and neutrons, respectively. The neutron transition densities have been further analyzed by separating the contribution of the neutrons of the core, represented by the dotted black lines, and that of the neutrons in excess, indicated by the dashed black lines. The numbers in each panel indicate, in MeV, the excitation energy. The states in the left column belong to the PDR region, those in the right column to the GDR one.
All the results we have obtained present common trends. In the PDR states proton and neutron transition densities are in phase, while they are out of phase in the GDR states. This statement is clear in the lighter nuclei, 22O and 48Ca. In heavier nuclei the number of the nodes of the two transition densities is different, therefore the situation is more involved. For the PDR it is evident, however, that at the nuclear surface both transition densities are always in phase. The transition densities related to the GDR do not show this kind of ambiguities. In these cases proton and neutron transition densities are evidently always out of phase.
There is another feature common to all the results presented in Fig. 8. In the transition densities of the GDR, the contribution of the neutrons in excess is comparable to that of the neutrons of the core. On the contrary, the PDR transition densities are dominated by the neutrons in excess.
III.5 Role of the residual interaction
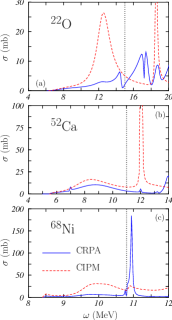
The results we presented so far indicate that the structures of the pygmy and of the giant dipole excitations are different. We studied whether the different structures imply different sensitivities to the various terms of the effective nucleon-nucleon force. In Fig. 9, for three nuclei where we have clearly identified the presence of pygmy dipole strength, we compare the CRPA results with those obtained by completely switching off the residual interaction. We call continuum independent particle model (CIPM) this last type of calculations.
As we have done in Figs. 1-5, we indicate the separation between the PDR and GDR regions with a dotted vertical line located at energies. In all the cases presented in the figure the CIPM cross sections are larger than the CRPA ones in the PDR region. We observe the largest difference in the 22O nucleus, where the large and wide peak of the CIPM result is due to the neutron transition. In the RPA calculation the residual interaction moves the main contribution of this p-h pair in the GDR region. The results for the 52Ca and 68Ni nuclei are less extreme.
These results indicate a remarkable sensitivity of the dipole strength to the presence of the residual interaction in the RPA calculations. To identify the components of the interaction to which the PDR is more sensitive, we adopted the strategy to switch on and off the various terms of the interaction. Unfortunately, when a finite range interaction is used, each term of the interaction contributes to the other channels via exchange terms. We simplify our study by constructing a zero range interaction to be used by considering only direct RPA matrix elements. In this case, we can completely switch off and on the contributions of the individual terms of the force and observe their effect on the RPA results. We constructed a zero-range interaction of Landau-Migdal (LM) type:
| (14) |
where , , and are constants whose values have been chosen to reproduce, approximately, the DRPA responses obtained with the D1M Gogny interaction.
We discuss here only the results we have obtained for the 68Ni case. We show in Table 2 the centroid energies, , for the pygmy and giant regions obtained in DRPA calculations with various interactions. As we can see, the values obtained with the complete LM interaction reproduce rather well the centroid energies found with the D1M force.
By setting to zero the and constants, we have verified that the electric dipole response is essentially insensitive to the spin dependent terms of the interaction. We present in Table 2 the results obtained by setting to zero and . The calculations done with do not modify the centroid energy of the GDR, and increase that of the PDR by only the 2%. The calculations with lower the PDR centroid energy by 3%, but reduce the centroid energy of the GDR by 30%. We observed similar results in all the cases we have investigated. The PDR has a small sensitivity to the scalar and isospin channels. The contribution of the scalar term is attractive, i.e. it lowers the values of , while that of the isospin channel is repulsive.
| PDR | GDR | |||
|---|---|---|---|---|
| D1M | 10.49 | 20.54 | ||
| LM | 10.69 | 19.65 | ||
| LM () | 10.91 | 19.64 | ||
| LM () | 10.37 | 13.67 |
IV Conclusions
We have investigated the pygmy and giant dipole excitations in a set of 18 spherical nuclei in various mass regions. We have conducted our study by doing self-consistent RPA calculations with the finite range D1M Gogny interaction. We carried out discrete and continuum RPA calculations, the latter ones for 13 nuclei lighter than 100Sn. We have verified the convergence of the discrete and continuum results. For each nucleus considered we have separated the two energy regions identifying the pygmy and the giant responses. Centroid energies and sum rule exhaustion are conserved in both discrete and continuum RPA calculations in each energy region.
The main results of our investigation are summarized here below.
-
1.
The dipole strength at energies around the nucleon emission threshold increases with the neutron excess.
-
2.
The PDR exhausts about 5% of the total energy weighted sum rule, while the GDR about the 90%.
- 3.
-
4.
The PDR is dominated by the neutron p-h excitations, while in the GDR the contributions of both proton and neutron excitations are comparable.
-
5.
At the nuclear surface, proton and neutron transition densities are in phase in the PDR region, while they are out of phase in the GDR region.
-
6.
The neutron transition densities of the PDR states are dominated by the motion of the neutrons in excess. In the GDR both the neutrons in excess and those of the core contribute to the excitation.
-
7.
The scalar and isospin terms of the effective interaction have opposite effects on the PDR, the former is attractive and the latter repulsive. In any case these effects are much smaller than those produced by the interaction on the GDR.
Our investigation indicates that, as it has been suggested in Refs. rei10 ; rei12 , the emergence of the PDR is an effect more related to the shell structure of the various isotopes than to a real collective nuclear motion.
The limits of our investigation are related to the validity of the intrinsic hypotheses of the theory we used, the RPA. Specifically, we refer to the fact that in RPA the excited states are described as linear combination of one particle-one hole, and one hole-one particle, excitations. The role of configurations beyond RPA on the PDR was investigated in ter07 ; avd11 ; gam11 where a redistribution of the strength was pointed out as the main effect. This generate strength also at energies lower than those indicated by RPA calculations har04 . A detailed comparison with the future experimental data would require the use of self-consistent theories beyond RPA gam12 . In any case, the main results of our investigation depend on the global properties of the excitation, rather than on the detailed distribution of the strength. For this reason, we believe that they would not be changed by theories more elaborated than RPA.
Acknowledgements.
This work has been partially supported by the PRIN (Italy) Struttura e dinamica dei nuclei fuori dalla valle di stabilità, by the Spanish Ministerio de Ciencia e Innovación under contract FPA2009-14091-C02-02 and by the Junta de Andalucía (FQM0220).References
- (1) N. Paar, D. Vretenar, E. Khan, G. Colò, Rep. Prog. Phys. 70 (2007) 691.
- (2) S. Krewald, J. Speth, Int. Jour. Mod. Phys. E 18 (2009) 1425.
- (3) S. Goriely, Phys. Lett. B 436 (1998) 10.
- (4) I. Daoutidis, S. Goriely, Phys. Rev. C 86 (2012) 034328.
- (5) M. Arnould, S. Goriely, K. Takahashi, Phys. Rep. 450 (2007) 97.
- (6) O. Bohigas, N. Van Giai, D. Vautherin, Phys. Lett. B 102 (1981) 105.
- (7) H. Krivine, C. Schmit, J. Treiner, Phys. Lett. B 112 (1982) 281.
- (8) A. Carbone, G. Colò, A. Bracco, L. G. Cao, P. F. Bortignon, F. Camera, O. Wieland, Phys. Rev. C 81 (2010) 041301.
- (9) P. G. Reinhard, W. Nazarewicz, Phys. Rev. C 81 (2010) 051303(R).
- (10) T. Inakura, T. Nakatsukasa, K. Yabana, Phys. Rev. C 84 (2011) 021302(R).
- (11) G. Co’, V. De Donno, C. Maieron, M. Anguiano, A. M. Lallena, Phys. Rev. C 80 (2009) 014308.
- (12) M. Anguiano, G. Co’, V. De Donno, A. M. Lallena, Phys. Rev. C 83 (2011) 064306.
- (13) M. Anguiano, M. Grasso, G. Co’, V. De Donno, A. M. Lallena, Phys. Rev. C 86 (2012) 054302.
- (14) G. Co’, V. De Donno, M. Anguiano, A. M. Lallena, Phys. Rev. C 85 (2012) 034323.
- (15) J. Dechargè, D. Gogny, Phys. Rev. C 21 (1980) 1568.
- (16) S. Goriely, S. Hilaire, M. Girod, S. Péru, Phys. Rev. Lett. 102 (2009) 242501.
- (17) A. Leistenschneider, et al., Phys. Rev. Lett. 86 (2001) 5442.
- (18) T. Hartmann, et. al., Phys. Rev. Lett. 93 (2004) 192501.
- (19) O. Wieland, et al., Phys. Rev. Lett. 102 (2009) 092502.
- (20) P. Adrich, et. al., Phys. Rev. Lett. 95 (2005) 132501.
- (21) N. Ryezayeva, et. al., Phys. Rev. Lett. 89 (2002) 272502.
- (22) I. Poltoratska, et al., Phys. Rev C. 85 (2012) 041304(R).
- (23) G. Co’, A. M. Lallena, Nuovo Cimento A 111 (1998) 527.
- (24) A. R. Bautista, G. Co’, A. M. Lallena, Nuovo Cimento A 112 (1999) 1117.
- (25) V. De Donno, Nuclear excited states within the random phase approximation theory, Ph.D. thesis, Università del Salento (Italy), http://www.fisica.unisalento.it/ gpco/stud.html (2008).
- (26) V. De Donno, G. Co’, M. Anguiano, A. M. Lallena, Phys. Rev. C 83 (2011) 044324.
- (27) P. Ring, P. Schuck, The nuclear many-body problem, Springer, Berlin, 1980.
- (28) D. J. Rowe, Nuclear collective motion, Methuen, London, 1970.
- (29) N. Van Giai, H. Sagawa, Nucl. Phys. A 371 (1981) 1.
- (30) X. Roca-Maza, G. Pozzi, M. Brenna, K. Mizuyama, G. Colò, Phys. Rev. C 85 (2012) 024601.
- (31) S. Hilaire, M. Girod, Eur. Phys. J. A 33 (2007) 237.
- (32) J.-P. Delaroche, M. Girod, J. Libert, H. Goutte, S. Hilaire, S. Péru, N. Pillet, G. F. Bertsch, Phys. Rev. C 81 (2010) 014303.
- (33) G. Co’, V. De Donno, P. Finelli, M. Grasso, M. Anguiano, A. M. Lallena, C. Giusti, A. Meucci, F. D. Pacati, Phys. Rev. C 85 (2012) 024322.
- (34) J. Ahrens, et al., Nucl. Phys. A 251 (1975) 479.
- (35) J. Speth, J. Wambach, Theory of giant resonances. in Electric and magnetic giant resonances in nuclei, J. Speth ed., World Scientific, Singapore, 1991.
- (36) P. F. Bortignon, A. Bracco, R. A. Broglia, Giant resonances. Nuclear structure at finite temperature, Harwood Academic Press, New York, 1998.
- (37) M. N. Harakeh, A. van der Woude, Giant resonances, Claredon press, Oxford, 2001.
- (38) R. de Haro, S. Krewald, J. Speth, Nucl. Phys. A 388 (1982) 265.
- (39) G. Co’, S. Krewald, Nucl. Phys. A 433 (1985) 392.
- (40) M. Traini, G. Orlandini, R. Leonardi, Rivista Nuovo Cimento 10 (1987) 1.
- (41) S. Kamerdzhiev, J. Speth, G. Tertychny, Phys. Rep. 393 (2004) 1.
- (42) D. Gambacurta, M. Grasso, F. Catara, Phys. Rev. C 84 (2011) 034301.
- (43) E. G. Lanza, A. Vitturi, M. V. Andrés, F. Catara, D. Gambacurta, Phys. Rev. C 84 (2011) 064602.
- (44) E. G. Lanza, F. Catara, D. Gambacurta, M. V. Andrés, P. Chomaz, Phys. Rev. C 79 (2009) 054615.
- (45) P. G. Reinhard, W. Nazarewicz, arxiv:1211.1649 [nucl-th] (2012).
- (46) G. Tertychny, V. Tselyaev, S. Kamerdzhiev, F. Grümmer, S. Krewald, J. Speth, A. Avdeenkov, E. Litvinova, Phys. Lett. B 647 (2007) 104.
- (47) A. Avdeenkov, S. Goriely, S. Kamerdzhiev, S. Krewald, Phys. Rev. C 83 (2011) 064316.
- (48) D. Gambacurta, M. Grasso, V. De Donno, G. Co’, F. Catara, Phys. Rev. C 86 (2012) 021304(R).