results from BABAR and implications for the muon g-2
Abstract
The BABAR collaboration has nearly completed a program of precise measurements of the cross sections for the dominant channels of from threshold to an energy of using the initial-state radiation (ISR) method, i.e. the measurement of the cross sections with the energetic detected at large angle to the beams. These data are used as input to vacuum polarization dispersion integrals, in particular the hadronic contribution to the muon anomaly. In addition to the recently measured cross section, giving the dominant contibution, many multihadronic channels have been investigated, with some recent examples presented here. We give preliminary results for the process using of data collected with the BABAR detector at center-of-mass energies near . The lowest-order contribution to the hadronic vacuum polarization term in the muon magnetic anomaly is obtained for this channel: , which is about a factor of three more precise than the previous world average value.
keywords:
1 Hadronic vacuum polarization and muon g-2
An important part of the Standard Model prediction for the muon magnetic anomaly , where is the gyromagnetic ratio equal to 2 at lowest QED order, is given by hadronic vacuum polarization (HVP). In fact the dominant uncertainty in the prediction comes from the HVP contribution which is computed through a dispersion relation using the experimental information on the cross section for , as the relevant energy scale is too low for applying perturbative QCD. The HVP component is given by:
| (1) |
where is a QED kernel and the bare cross section including final state radiation (FSR).
2 The ISR method at BABAR
Unlike previous measurements that were done by energy scans, the analyses presented here use the ISR method [1]. The cross section at the reduced energy is deduced from the measured spectrum of events produced at the center-of-mass (c.m.) energy . The reduced energy is related to the energy of the ISR photon in the c.m. frame by . is equal to the mass of the final state , including FSR photons. The ISR method follows from the relation
| (2) |
where is the effective ISR luminosity, is the full acceptance for the event sample, and is the ‘bare’ cross section for the process (including final-state radiative effects, but with leptonic and hadronic vacuum polarization contributions excluded). For precision measurements with the ISR method, the effective ISR luminosity is not taken from the theoretical radiator function, which describes the probability to emit an ISR photon of energy in a given angular acceptance, and the knowledge of the luminosity. Instead, it is determined from the measurement of the spectrum on the same data sample, through a relation similar to Eq. (2) where the cross section is given by QED. In this way several systematic uncertainties cancel. In particular, the measurement is mostly insensitive to higher order ISR corrections and other uncertainties affecting the hadron and muon channels equally.
In the BABAR analyses the ISR photon is detected at large angle with GeV. This defines a topology where the ISR photon is back-to-back to the produced hadrons, thus providing high acceptance and better particle identification (PID). Kinematic fits are used to reject backgrounds and improve mass resolution. A continuous cross section measurement from threshold up to 3-5 GeV is achieved, the upper range value depending on the background for each exclusive process.
3 Overview of BABAR ISR results
So far BABAR has published cross section results on 21 exclusive channels: [2, 3], [4], , , , , , , , , , , , , , , , , , , and c.c., [5].
Some final states are still under study: , , , , . Preliminary results on are given in the next section.
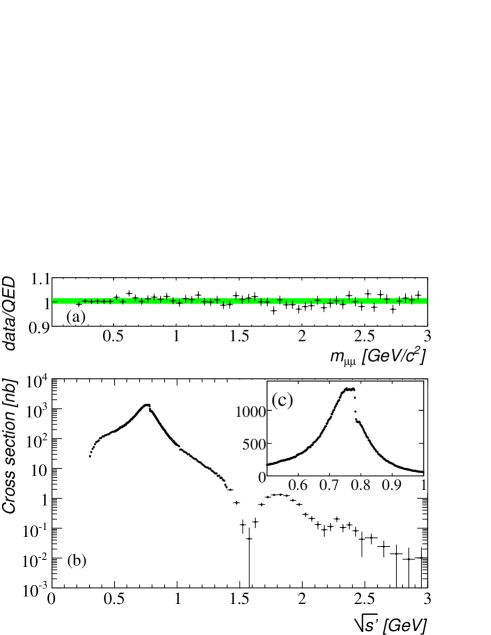
Some recently published results can be highlighted in view of their importance for . The measurement of is the most precise and complete for this process [2, 3]. The BABAR ISR procedure is checked with the QED reaction . Both results are given in Fig. 1, showing agreement within 1.1% (dominated by the 0.94% uncertainty on the luminosity) of the data with the next-to-leading-order (NLO) QED calculation. The cross section measurement, being obtained from the ratio , does not rely on the luminosity, thus providing a systematic uncertainty of only 0.5% in the dominant region.
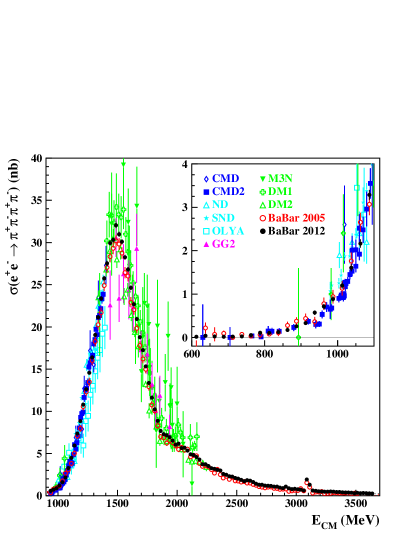
Another important process is on which an analysis based on the full BABAR integrated luminosity of 454 fb-1 has been recently published [4]. The cross section results are given in Fig. 2 together with those from previous experiments. Agreement is reasonable, the BABAR results being both more precise and spanning the whole energy range of interest for HVP dispersion integrals.
4 Preliminary results on
4.1 Event selection and analysis
The analysis is based on of data collected by the BABAR detector [6] and follows closely the analysis [3]. Two-track ISR events are selected by requiring a photon with an energy in the c.m. and polar angle with respect to the beam in the range [0.35–2.4], and exactly two tracks of opposite charge, each with momentum and identified as kaons with the DIRC Cerenkov detector and . A -ID efficiency of 80% is achieved, with fake rates at most 10% at the highest momentum. Kaon ID, as well as pion and muon mis-ID to kaons, are studied with high purity data samples.
As for the analysis of the and processes, the event definition is enlarged to include the radiation of one photon in addition to the already required ISR photon. Two kinematic fits to are performed: (1) if an additional photon is detected in the EMC, with energy , it is used in a three-constraint (3C) fit, called ‘FSR’ fit (however the extra photon can be either from FSR or additional ISR); (2) a fit with the additional photon assumed to be emitted along the beam directions, called 2C ISR fit. This procedure allows the reconstruction of events at NLO, therefore reducing the uncertainty resulting from the neglect of events with higher-order radiation. Each event is characterized by the two and values (except for the 12.5% with no extra measured photons), and the mass is obtained from the ISR fit if , and from the FSR fit in the reverse case. For the cross section measurement, the candidates are required to satisfy .
The overall acceptance is determined with a full simulation, with corrections applied to account for observed data to MC differences. Through specific studies, the ratios of efficiencies are obtained in data and simulation for trigger, tracking, PID and selection, and applied as mass-dependent corrections to the mass spectrum measured in data. Small corrections to the geometrical acceptance due to the assumed collinear additional ISR in the generator are obtained from the PHOKHARA code [7] with fast simulation.
Backgrounds stem primarily from other ISR events with extra ’s or misidentified pions, muons,or protons. Non-ISR represents the other important source of background, with an energetic photon from decay misidentified as the ISR photon. Estimation of backgrounds rely on PID measurements, rescaled simulation results using comparison with data in special samples, and the shape of the distribution. Background levels are negligible on the resonance, but increase at larger masses (about 2% at 1.1 GeV, 20% near 1.2 GeV from , 10% at 2 GeV, 50% at 5 GeV ). After specific studies of the mass calibration and resolution, unfolding of the background-subtracted mass spectrum is performed. Finally the effective luminosity is obtained with the sample.
4.2 Results
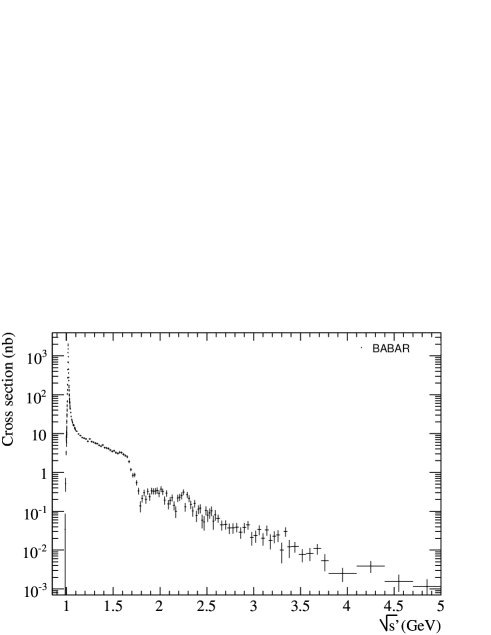
The bare cross section including FSR is shown in Fig. 3, from threshold up to 5 GeV. It spans over a very large dynamical range (more than six orders of magnitude), and is dominated by the resonance close to threshold. Other structures are clearly visible at higher masses.
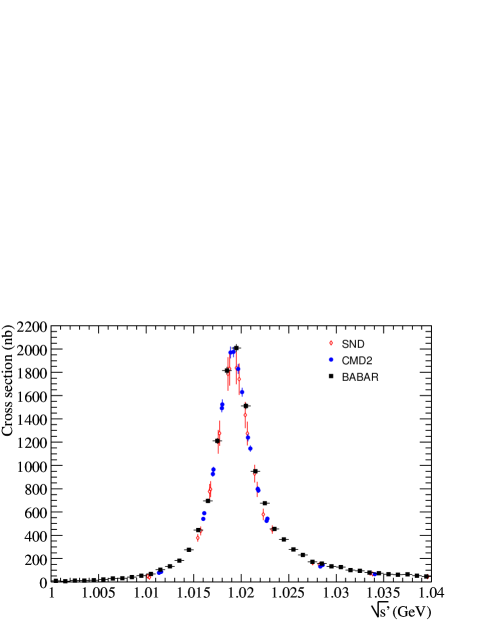
The cross section in the region is given in Fig. 4. It is in fair agreement with previous CMD-2 [8] and SND [9] s results: the peak BABAR cross section is about 5% (10%) higher than CMD-2 (SND), where the quoted systematic uncertainties are 0.7%, 2.2%, 7.1% for BABAR CMD-2, SND, respectively. There is also a small shift in mass (92 keV with CMD-2 and 65 keV with SND) consistent with the quoted mass calibration uncertainties, 110 keV (a preliminary conservative estimate) for BABAR and 80 keV for CMD-2).
A fit of the charged kaon form factor measured by BABAR is performed taking into account the and tails, as well as contributions from higher mass vector bosons. The following parameters are obtained: , , , where the last two uncertainties are from the form factor fit and the mass calibration. The precision of the last result is improved by a factor of two compared to the best value from CMD-2 [8].
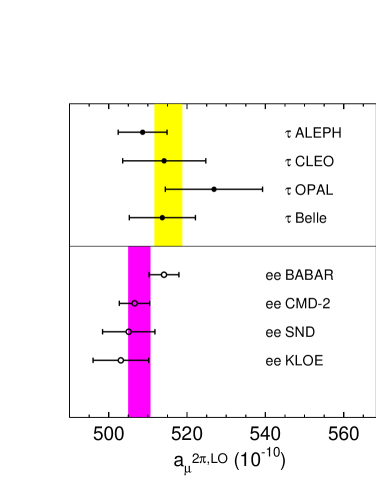
5 The impact of BABAR data on the prediction
The dominant HVP contribution to has received a lot of attention over the last 10 years, with discrepancies between experiments being partially resolved with time. Fig. 5 shows the results from all experiments as well as the determinations using data corrected for isospin-breaking [10]. To keep results as independent as possible the comparison uses only data from the considered experiment (complemented by world-average data in energy ranges not covered). It is seen that the BABAR result is the most precise (with CMD-2) and helps reduce the tension between and data.
The precision of the new data presented here on the and channels also allow further progress. The contributions up to 1.8 GeV are and , respectively to be compared with previous determinations [12], and . For other multihadronic channels the BABAR ISR results are by far the most accurate and complete. In addition the dynamics of each final state has been studied and found to be dominated by resonances which have been identified. This is important because it is possible in this way to derive some cross section estimates [12] for final states which are difficult to measure () using the known branching fractions of these resonances. This detailed information has been used in the most recent estimate of , showing a discrepancy [12] with the direct measurement [13]. Another estimate [14] uses also BABAR cross section data.
I would like to thank the Nagoya group for organizing a perfect workshop.
References
- [1] V.N. Baier and V.S. Fadin, Phys.Lett. B27, 233 (1968); A.B. Arbuzov et al., J. High Energy Phys. 9812, 009 (1998); S. Binner, J.H. Kühn, and K. Melnikov, Phys.Lett. B459, 279 (1999); M. Benayoun et al., Mod.Phys.Lett. A14, 2605 (1999).
- [2] B. Aubert et al., BABAR Collaboration, Phys.Rev.Lett. 103, 231801 (2009).
- [3] J.P. Lees et al., BABAR Collaboration, Phys.Rev. D86, 032013 (2012).
- [4] J.P. Lees et al., BABAR Collaboration, Phys.Rev. D85, 112009 (2012).
- [5] J.P. Lees et al., BABAR Collaboration, Phys.Rev. D86, 012008 (2012); B. Aubert et al., BABAR Collaboration, Phys.Rev. D77, 092002 (2008); Phys.Rev. D76, 012008 (2007); Phys.Rev. D76, 092006 (2007); Phys.Rev. D76, 092005 (2007); Phys.Rev. RC D74, 091103 (2006); Phys.Rev. RC D74, 111103 (2006); Phys.Rev. D73, 052003 (2006); Phys.Rev. D73, 012005 (2006); Phys.Rev. D71, 052001 (2005); Phys.Rev. D70, 072004 (2004).
- [6] B. Aubert et al., Nucl.Instr.Meth. A479, 1 (2002).
- [7] H. Czyż et al., Eur.Phys.J. C35, 527 (2004); Eur.Phys.J. C39, 411 (2005).
- [8] R.R. Akhmetshin et al., Phys.Lett. B669, 217-222 (2008).
- [9] M.N. Achasov et al., Phys.Rev. D63, 072002 (2001); Phys.Rev. D76, 072012 (2007).
- [10] M. Davier et al., Eur. Phys. Jour. C66, 127 (2010).
- [11] M. Davier et al., Eur.Phys.J. C66, 1 (2010).
- [12] M. Davier, A. Hoecker, B. Malaescu, and Z. Zhang, Eur.Phys.J. C71, 1515 (2011), Erratum-ibid. C72 1874 (2012).
- [13] G.W. Bennett et al., Phys. Rev. D73, 072003 (2006).
- [14] K. Hagiwara et al., J. Phys. G 38, 085003 (2011).