Magnetic phase diagram of Sr3Fe2O7-δ
Abstract
Magnetometry, electrical transport, and neutron scattering measurements were performed on single crystals of the Fe4+-containing perovskite-related phase Sr3Fe2O7-δ as a function of oxygen content. Although both the crystal structure and electron configuration of this compound are closely similar to those of well-studied ruthenates and manganates, it exhibits very different physical properties. The fully-oxygenated compound () exhibits a charge-disproportionation transition at K, and an antiferromagnetic transition at K. For temperatures , the material is a small-gap insulator; the antiferromagnetic order is incommensurate, which implies competing exchange interactions between the Fe4+ moments. The fully-deoxygenated compound () is highly insulating, and its Fe3+ moments exhibit commensurate antiferromagnetic order below K. Compounds with intermediate exhibit different order with lower , likely as a consequence of frustrated exchange interactions between Fe3+ and Fe4+ sublattices. A previous proposal that the magnetic transition temperature reaches zero is not supported.
pacs:
75.30.Kz, 75.30.Cr, 75.50.Ee, 61.50.NwI Introduction
Materials in the Ruddlesden-Popper series An+1MnO3n+1 with four -electrons on the transition-metal M-site have proven to be a unique testbed of correlated-electron physics. Compounds with M = Ru4+ (electron configuration ) are generally metallic and display a large variety of electronic phases including -wave superconductivity (in Sr2RuO4 with ), electronic nematicity (in Sr3Ru2O7), and ferromagnetism (in SrRuO3 with , the pseudocubic perovskite structure). Compounds based on Mn3+ (), on the other hand, undergo a variety of orbital and magnetic phase transitions generally leading to low-temperature insulating states. Iron, which neighbors both Ru and Mn in the periodic table, can be stabilized in the unusual valence state Fe4+ with electron configuration in these structures. In contrast to the ruthenates, Fe4+-based perovskites can exhibit either metallic or correlation-driven insulating states, depending on subtle details of their crystal structures. For instance, SrFeO3 (with ) is metallic at all temperatures, whereas CaFeO3 is charge-disproportionated and insulating below K.Takano et al. (1977); Takano and Takeda (1983) Neither of these compounds shows orbital order, which is a common feature of the Mn3+-based manganates, and their magnetic ground states exhibit helical order,Takeda et al. (1972); Woodward et al. (2000); Reehuis et al. (2012) which has been observed in neither the ruthenates nor the manganates. In terms of the itineracy of the valence electrons, the ferrates therefore fall between the manganates and ruthenates with electron configuration, yet their phase behavior is distinctly different from those of both neighbors in the periodic table.
The present study of the Ruddlesden-Popper compound Sr3Fe2O7-δ, the -electron analog of Sr3Ru2O7, was motivated by the desire to obtain further insight into the origin of the pronounced differences between ruthenates, manganates, and ferrates, and into the influence of the oxygen stoichiometry on the magnetic phase behavior of the ferrates. Although the layered crystal structure of Sr3Fe2O7-δ is expected to give rise to quasi-two-dimensional electronic properties, current knowledge of its properties derives entirely from measurements on powder samples. Mößbauer spectroscopy experiments on fully-oxygenated Sr3Fe2O7 powders indicated disproportionation of Fe4+ into the nominal valence states Fe3+ and Fe5+ around 340 K, Adler (1997); Kuzushita et al. (2000) closely analogous to the analog CaFeO3. Takano et al. (1977) Magnetic susceptibility measurements at this doping have indicated an antiferromagnetic transition with Néel temperature K,Kuzushita et al. (2000) but neutron powder diffraction measurements only revealed weak, broad Bragg reflections indicative of two-dimensional magnetic order,Dann et al. (1993) and these could not be indexed, so the nature of this transition remains unclear. It has also been reported that Sr3Fe2O7-δ exhibits a continuous insulator-metal transition under pressure, Rozenberg et al. (1999) likely as a consequence of changes in the valence-electron bandwidth. Abbate et al. (2004)
One tunable parameter available in these ferrates is oxygen content — both Sr3Fe2O7-δ and SrFeO3-x can be readily reduced from Fe4+ to Fe3+. Since both electronic and oxygen conductivities are high at operating temperatures, both materials have been investigated as mixed conductors for solid oxide fuel cell applications, Huang et al. (2001); Ralph et al. (2001); Wincewicz and Cooper (2004); Mogni et al. (2005); Prado et al. (2007) thus much is known about the oxygen stoichiometry. SrFeO3-x supports a series of oxygen vacancy-ordered phases, Mizusaki et al. (1992); Hodges et al. (2000) separated by phase-separation regions which extend as high as 900∘C, complicating analysis. Even a small concentration of oxygen defects in SrFeO3-x can induce a wide variety of charge-ordered and magnetically-ordered states at low temperatures, which are associated with unusual magneto-transport phenomena. Lebon et al. (2004); Adler et al. (2006); Ishiwata et al. (2011); Reehuis et al. (2012).
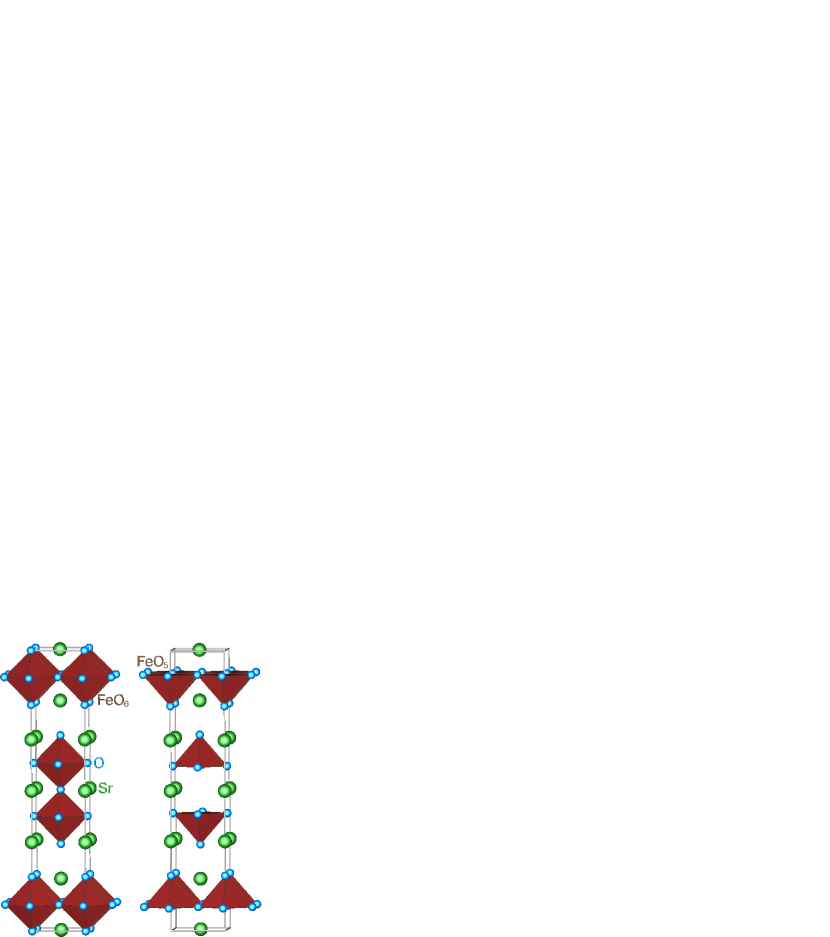
No evidence for oxygen order has been reported in Sr3Fe2O7-δ. Limited data on Sr3Fe2O7-δ powder samples suggest that the antiferromagnetic transition temperature in this material decreases as oxygen is removed, possibly approaching zero near Dann et al. (1992); MacChesney et al. (1966) before recovering for , where a magnetic transition with as high as 550 K has been claimed. Dann et al. (1993) This observation would indicate enhanced magnetic fluctuations in compounds with iron valence intermediate between Fe3+ (Sr3Fe2O6) and Fe4+ (Sr3Fe2O7), whose origin has yet to be determined, and could suggest the presence of a metamagnetic quantum critical point. Analogy to SrFeO3-x would indicate that deoxygenation tunes the balance between antiferromagnetic and ferromagnetic coupling, possibly leading to multiple magnetic ground states, while the lower dimensionality should lead to narrower bandwidth and more insulating behavior.Abbate et al. (2004) Indeed, unlike SrFeO3.00, Sr3Fe2O7.00 is insulating at ambient pressure. Since the oxygen site emptied on deoxygenation is the bridging site within the bilayer (Fig. 1 contrasts the crystal structures of Sr3Fe2O6 and Sr3Fe2O7), doping should alter the intra-bilayer coupling, effective dimensionality, bandwidth, and bond angles in addition to the oxidation state of iron, making detailed predictions of the phase diagram challenging. The effect of doping in this material has not been explored in detail, but this information will be crucial to underpin future studies of the low-temperature behavior.
Motivated by these considerations, we have undertaken a comprehensive investigation of the magnetic order and electrical conductivity of Sr3Fe2O7-δ single crystals with carefully controlled oxygen stoichiometry. This paper reports the magnetic transitions observed in magnetization, resistivity, and simple neutron diffraction measurements, leading to a proposed doping phase diagram for Sr3Fe2O7-δ.
II Experimental details
Large single crystals of Sr3Fe2O7-δ were grown by the floating zone technique under 2.5 atm of oxygen in a four-mirror image furnace, using a growth rate of about 2 mm/h for low mosaicity, as described elsewhere. Maljuk et al. (2004) A variety of different oxygen contents were prepared by annealing for a long enough time that the samples would fully equilibrate under various temperatures and oxygen partial pressures, based on the established oxygen phase diagram. Mogni et al. (2005) With a few exceptions, the anneals were concluded by quenching the crystals to liquid nitrogen. The end member was produced by annealing under 6000 atm of oxygen at 550∘C for four days, then cooling to room temperature over the course of a day to maximize the oxygen content. The end member was annealed at 650∘C under 1 atm of 5% hydrogen in argon and nearby in argon. Quenching these samples would have required exposing them to air, at the risk of changing their oxygen contents; they were thus allowed to cool freely in the furnace. It was also impossible to rapidly quench a sample annealed to an oxygen content of 6.90, since this was performed under high oxygen pressure. In this case, the split-tube furnace was fully opened and the pressure vessel containing the sample was removed from the heated zone of the furnace to the extent possible. Annealing conditions are summarized in Table 1. All annealed and unannealed crystals were stored in an argon glovebox having less than 0.1 ppm H2O, to minimize the intercalation of water which causes delamination of the crystal and introduces transverse cracks.
| (∘C) | Time | TG | ||
|---|---|---|---|---|
| 6.00 | 650 | 0.05 atm H2 in Ar | 7 days | 6.04 |
| 6.05(2) | 880 | 1 atm Ar, O ppm | 5 days | — |
| 6.125 | 690 | 0.0001 atm | 6 days | 6.17 |
| 6.25 | 665 | 0.002 atm | 6 days | 6.30 |
| 6.33 | 547 | 0.001 atm | 7 days | 6.35 |
| 6.40 | 636 | 0.05 atm | 6 days | 6.41 |
| 6.50(3) | 645 | 1 atm | 6 days | 6.54 |
| 6.67 | 425 | 1 atm | 11 days | 6.73 |
| 6.75 | 350 | 1 atm | 14 days | 6.84 |
| 6.775 | 275 | 1 atm | 15 days | 6.75 |
| 6.90(2) | 350 | 60 atm | 13 days | 6.98 |
| 6.98(2) | 550 | 6000 atm | 4 days | 6.95 |
The oxygen contents were verified by thermogravimetric analysis in a Netsch STA-449C DTA/TG apparatus, by heating a portion of each anneal batch in flowing argon (oxygen partial pressure atm) to 1420∘C, under which conditions the oxygen stoichiometry should be very close to Sr3Fe2O6.00, while monitoring the mass loss. The measured oxygen contents generally agreed with expectations within the estimated uncertainty of 0.06 of an oxygen per formula unit. Within this error, the oxygen contents were universally found to be somewhat higher than expected, perhaps due to additional mass losses from intercalated water. Samples that were exposed to air for longer periods of time generally had higher apparent oxygen contents. In some cases, the water deintercalated around C, and could be separated from the effects of deoxygenation, which was too slow to be observable below C on the timescale of this measurement. Several oxygen contents were independently confirmed via preliminary x-ray or neutron diffraction structure refinements, and these results consistently agreed very well with the intended oxygen contents.Reehuis Given the uncertainty in all experimental results and their consistency with expectations, samples are referred to in this work by their nominal oxygen contents.
Magnetic measurements were performed on field-cooling by vibrating-sample magnetometry (Quantum Design MPMS-VSM or Quantum Design PPMS with VSM option) in fields of 2000 Oe and in some cases additional fields, using quartz sample holders. All samples were first aligned by x-ray Laue diffraction, to ensure the field was applied along the crystal’s tetragonal axes — for lack of evidence suggesting a reduction in symmetry,Rozenberg et al. (1999); Adler et al. (1999); Prado et al. (2001); Shilova et al. (2002) the published tetragonal unit cell Brisi (1961); Dann et al. (1992) is used throughout this paper. Magnetization measurements were supplemented at several doping levels by resistivity, which was measured in a Quantum Design PPMS. Gold wires were attached to corners of each thin, mm2 sample using silver epoxy, which was allowed to cure for several hours at 180–200∘C in air before the crystal was mounted to the sample puck with GE Varnish (any stress due to thermal expansion has been neglected). At these cure temperatures, the oxygen mobility remains low and the oxygen content should not change, although this could promote oxygen order. Due to the crystals’ tendency to delaminate (and often fracture while doing so) when exposed to air, absolute bulk resistivities cannot be reliably obtained in this manner. In the following, each sample’s resistivity is therefore referenced to its 300 K zero-field value. However, it is worth noting that a significant and monotonic increase in resistivity was observed with oxygen removal, and the temperature below which the samples became too resistive to measure increased markedly as the oxygen content was reduced.
To clarify the origin of the phase transitions revealed by the magnetization measurements, the temperature dependence of selected magnetic Bragg peaks was measured at several doping levels by neutron diffraction. The measurements were performed at the Morpheus and TriCS beamlines at SINQ at the Paul-Scherrer-Institut in Villigen, Switzerland, and on the E5 diffractometer at the BER-II reactor at the Helmholtz-Zentrum Berlin, Germany. Full datasets were in general not collected, as the intention was to determine a phase diagram to focus future work, rather than perform refinements. Samples were typically half-cylinders of mm diameter and 5-7 mm in length, although at a few doping levels rods up to 23 mm in length were used. Neutron wavelengths of 2.317Å (TriCS), 4.99Å (Morpheus) and 2.38Å (E5) were selected using the (002) reflection from pyrolytic graphite (PG) monochromators, and higher-order contamination () was prevented through the use of a PG (TriCS, E5) or liquid-nitrogen-cooled beryllium powder (Morpheus) filter. Data were collected at TriCS and Morpheus using a point detector (a 2-inch diameter 3He tube), and at E5 using a position-sensitive 3He detector of dimensions mm2. Samples were mounted in four-circle geometry on a closed-cycle refrigerator, and collimators and slits were set such that each sample was fully illuminated. For most doping levels, selected magnetic peaks at each temperature were fit to Gaussian lineshapes, which were then integrated. For crystals with oxygen contents of 6.05, 6.90, and 7.00, data were instead integrated using the RACER program, Wilkinson et al. (1988) which uses the parameters describing the shape of strong peaks to improve the precision in the integration of weaker ones, minimizing the integral’s relative standard deviation.
III Results and Discussion
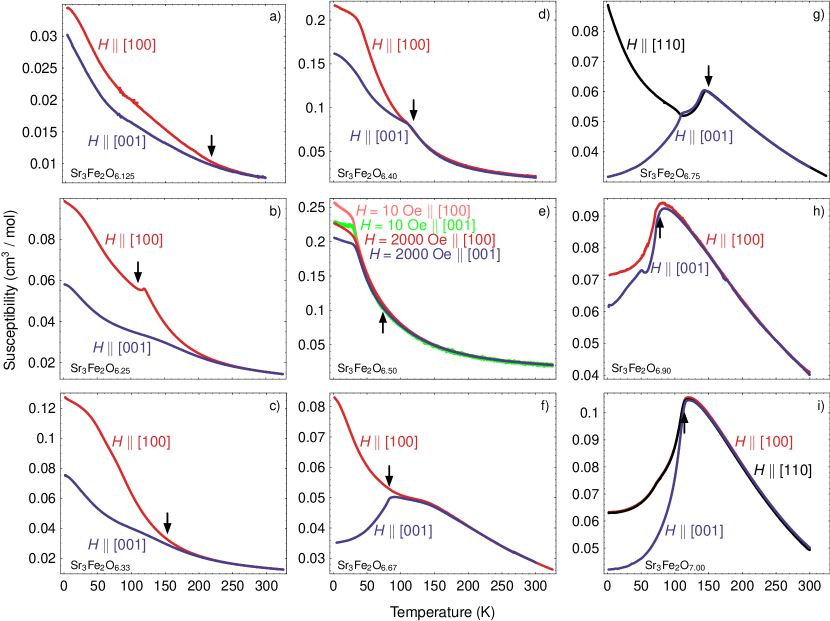
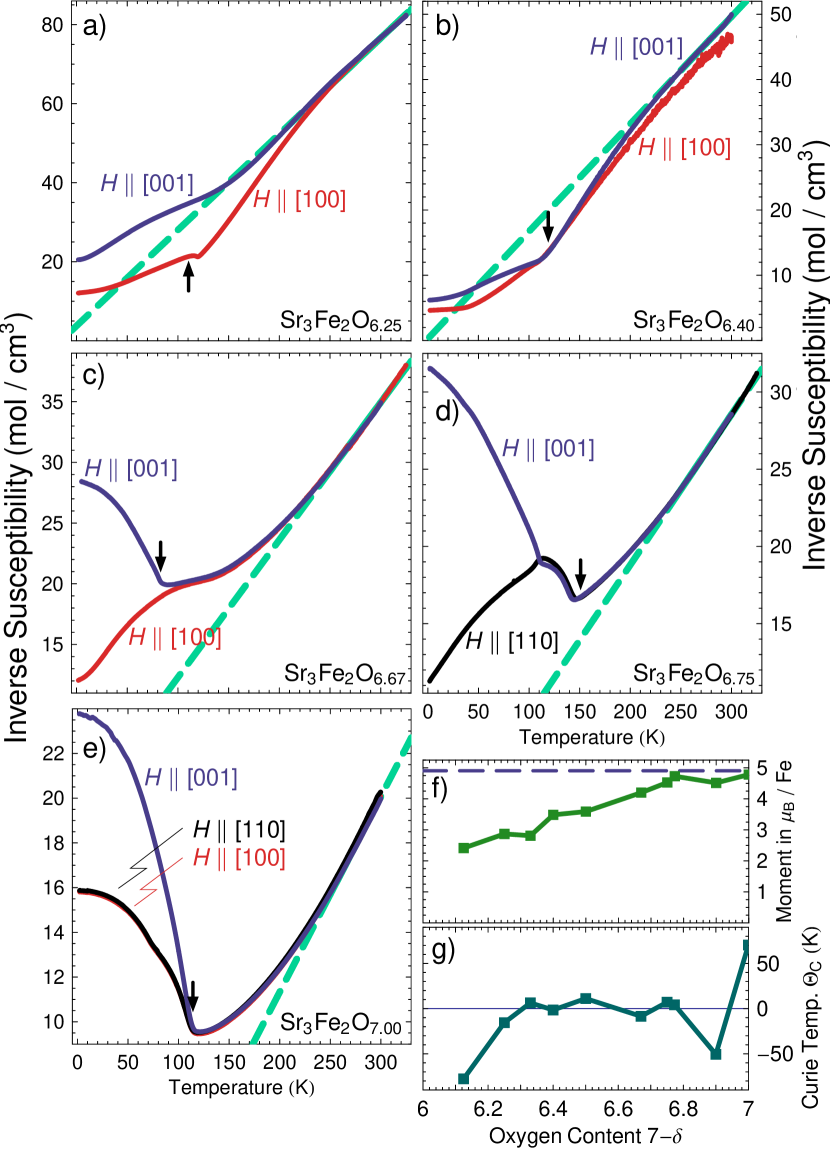
Field-cooled molar magnetic susceptibility () data at several representative oxygen concentrations are compiled in Fig. 2. For every sample, was measured under 2000 Oe applied fields , and and/or , while at most doping levels additional data were collected in lower fields (10 or 100 Oe) to verify that 2000 Oe was not excessive. Data were taken for both in-plane directions for four dopings (shown for ), but the in-plane field orientations produced indistinguishable results as would be expected for any effectively tetragonal material in low fields and in the absence of field-training. On other samples only one in-plane field orientation was measured. Data taken in 2000 Oe were fully consistent with those in lower fields except for minor differences in Sr3Fe2O6.50 (10 Oe data shown), where the higher field induced saturation at a slightly lower susceptibility (higher temperature). The high-temperature susceptibilities were fit to a Curie-Weiss form; however, plots of versus exhibit significant curvature well above the ordering temperature (Fig. 3). The temperature range for the Curie-Weiss fits was therefore restricted to K for all dopings.
For Sr3Fe2O7-δ with , the paramagnetic moment per Fe ion resulting from these fits, , is consistent with that expected for high-spin Fe4+, indicating that the spins are weakly correlated at room temperature. The curvature in the versus plot at lower , but well above , can be attributed to the onset of spin correlations. The layered, body-centered crystal structure of Sr3Fe2O7-δ (Fig. 1) will give rise to weak and frustrated antiferromagnetic interactions between adjacent bilayers. The iron moments are therefore expected to be much more strongly coupled in-plane than between bilayers, so that the spin correlations close to are presumably quasi-two-dimensional.
With decreasing oxygen content, the paramagnetic moment per Fe ion extracted from these fits decreases, in qualitative agreement with the gradual reduction of the electron density on the iron ions. However, this reduction is more pronounced than expected for mixtures of high-spin Fe3+ and Fe4+ ions according to the oxygen stoichiometry, especially for samples with . In view of the rapidly increasing Néel temperature in this doping range and the expected reduction in the interlayer exchange coupling as bridging oxygens are removed, we tentatively attribute this observation to strong quasi-two-dimensional antiferromagnetic spin correlations in the temperature range where the Curie-Weiss fits were carried out. Measurements at higher temperatures (under inert-gas atmosphere where necessary to prevent reoxygenation) will be required to access the uncorrelated paramagnetic regime at lower oxygen contents.
Because of the narrow temperature range employed for the Curie-Weiss fits, the resulting paramagnetic Curie-Weiss temperatures () carry large systematic errors. It is nonetheless notable that their absolute values are generally below the magnetic ordering temperatures, probably as a consequence of highly anisotropic exchange interactions.
The susceptibility of every sample with oxygen content exhibits at least one anomaly indicating a phase transition. Anisotropic magnetization typically appeared below one such transition, clearly identifying it as magnetic in origin. In particular, the susceptibility clearly indicates an onset of anisotropy at the known antiferromagnetic transition ( K) for the end member Sr3Fe2O7.00. At some lower oxygen contents the anisotropy is weak but still recognizable (e.g., Sr3Fe2O6.50 in Fig. 2e). Our observation of magnetic transitions at all dopings thus does not confirm conclusions from early powder data according to which the Néel temperature vanishes for . MacChesney et al. (1966) For all oxygen contents , the susceptibility is lower for fields along the -axis than for in-plane fields, suggesting a spin orientation with more out-of-plane than in-plane character. Susceptibility upturns corresponding to net moments of order 0.01 per iron are observed for some doping levels and field orientations upon cooling below . This may indicate weak ferromagnetic contributions to the order parameter, perhaps reflecting spin canting due to Dzyaloshinskii-Moriya interactions. Weakly correlated spins at defect sites of the crystal lattice probably contribute to the overall increase of the susceptibility upon cooling observed for large .
For most samples, two anomalies are visible in the magnetization data. For instance, Figure 2 shows clear transitions below the onset of anisotropy in Sr3Fe2O6.25 and above it in Sr3Fe2O6.75. A detailed analysis of the structural phase composition is required to elucidate the origin of the secondary anomalies for samples with lower oxygen contents. Possible candidates include charge or orbital order, metamagnetic transitions, and transitions in minority phases having different oxygen vacancy order, if such order exists in this compound. In particular, a weak secondary anomaly below in Sr3Fe2O7.00 resembles a transition observed in fully-oxygenated SrFeO3.00 which has been attributed to magnetic order nucleated by a dilute concentration of residual oxygen vacancies.Lebon et al. (2004); Adler et al. (2006); Reehuis et al. (2012)
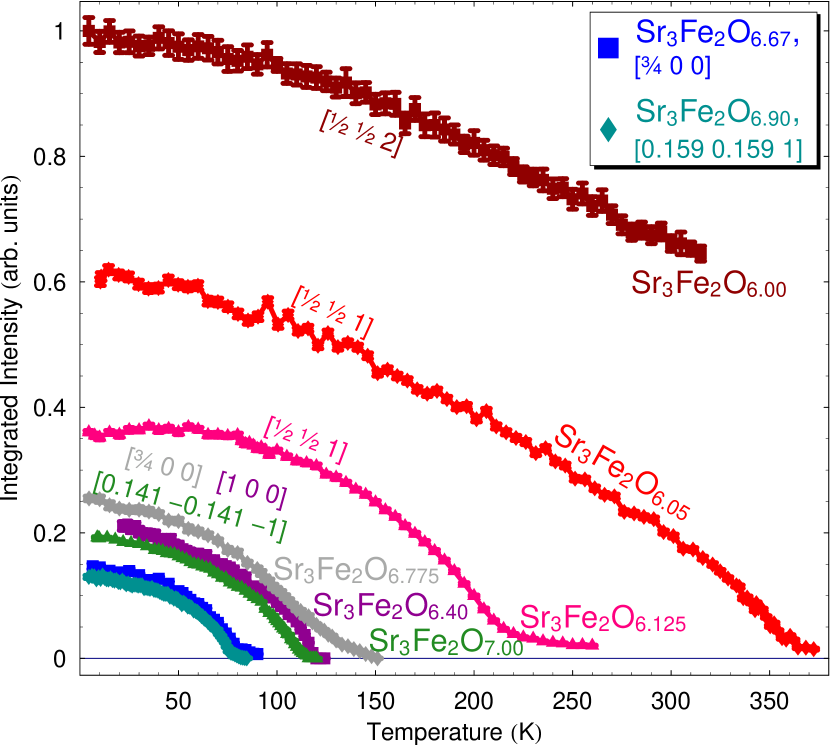
To determine the nature of the antiferromagnetic order, the Néel temperature, and the temperature dependence of the order parameter, single crystal neutron diffraction experiments were performed at selected doping levels. These experiments were generally limited to a survey of the first Brillouin zone in reciprocal space and temperature-dependent measurements of the peaks thus identified, and are not sufficient to allow determination of a propagation vector or spin arrangement. For and 6.90, surveys of reciprocal space revealed incommensurate magnetic reflections with wave vectors with and 0.159, respectively, and integer. (The wave vector coordinates are given in reciprocal lattice units based on the tetragonal space group with lattice parameters Å and Å for K at .) The temperature dependence of the magnetic Bragg intensity (shown in Fig. 4 for selected dopings) indicates second-order phase transitions with Néel temperatures 114 and 78 K, coincident with the onset of the anisotropy in the macroscopic susceptibility (Fig. 2). These observations are analogous to the behavior of the incommensurate magnetic reflections with wave vector in the pseudocubic perovskites SrFeO3 and CaFeO3, which have been attributed to helical magnetic order.Takeda et al. (1972); Woodward et al. (2000); Reehuis et al. (2012) It is therefore quite likely that the magnetic ordering pattern in Sr3Fe2O7-δ for small is an analogous helical state, but hosted in a two-dimensional system. A detailed crystallographic refinement of the crystal and magnetic structure is required to confirm this hypothesis.
For , the neutron diffraction data revealed commensurate magnetic reflections with wave vectors , an integer, consistent with an earlier report on Sr3Fe2O6 powder.Dann et al. (1993) The temperature-dependent Bragg intensity again indicates second-order phase transitions with strongly doping-dependent . We were unable to access the transition temperature for Sr3Fe2O6.00 — observing this transition without altering the doping will require performing measurements at high temperatures in the presence of hydrogen — so its transition temperature was estimated by scaling the data to match those taken on Sr3Fe2O6.05. The resulting extrapolated is K. The Néel transition for fully deoxygenated Sr3Fe2O6.00 has been quoted as 550 K Dann et al. (1993) or 298 K Dann et al. (1992). Our neutron results support the former value. The onset of the intensity in the samples with and 6.33 coincides approximately with the onset of anisotropy in the macroscopic susceptibility (Fig. 6), confirming the assignment of these anomalies to antiferromagnetic ordering.
In crystals with oxygen contents and 6.50, peaks were found at and for integer , along with intense peaks at and positions. All of these peaks exhibit the same temperature dependence, consistent with second-order transitions at 119 and 74 K, respectively, at the two dopings. The addition of suggests that the interactions are now ferromagnetic along either or . Nuclear reflections are ordinarily forbidden at and because the lattice is body-centered, and all peaks for odd are eliminated by a phase shift in the neutrons diffracted from the body-centered layer relative to the other layers. The presence of these reflections implies that the body-centering is broken at these dopings (i.e., that the bilayer at is no longer identical to that at and 1), likely because its spin orientation is reversed. The -dependence of these odd-integer peaks; a comparison of their intensity to allowed nuclear peaks; and the fact that they follow the same temperature dependence as the magnetic half-integer peaks, together allow us to conclude that the and peaks are magnetic, not structural, in origin.
Finally, crystals with oxygen contents had peaks at , stronger peaks at , and weaker peaks at some for all combinations of half and quarter and ; and peaks were absent. Again all half- and quarter-integer peaks obey a common second-order temperature dependence, having transitions at 83 and 150 K, respectively, for and 6.775, but the and peaks retain a small fraction of their intensity to at least 250 K, with no signs of temperature-dependence above . In SrFeO3-x, a canted antiferromagnetic phase with a propagation vector of (in the cubic setting) has been identified at high oxygen contents,Reehuis et al. (2012) and a related phase may be manifested in Sr3Fe2O7-δ, while the peaks that retain weight above suggest an underlying non-magnetic order. Identification of the phases in this material at intermediate dopings and of their propagation vectors will require further investigation.
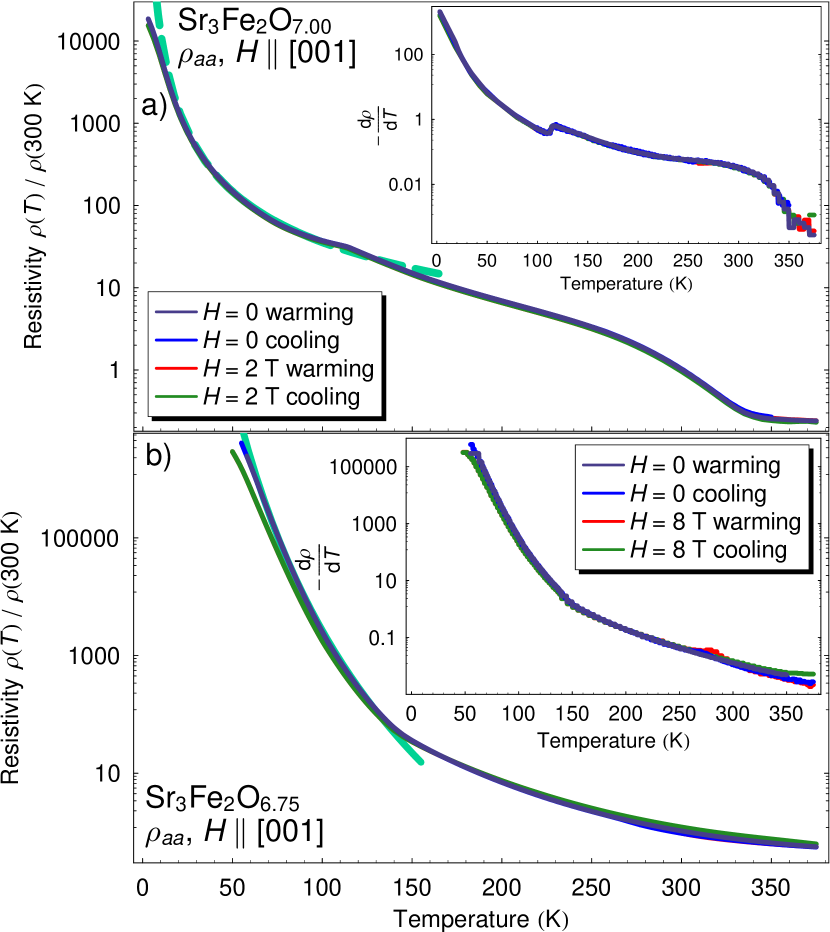
Motivated by reports of charge disproportionation in Sr3Fe2O7.00, the in-plane resistivity was measured on several samples in zero field and again in fields of several Tesla parallel to [001], as displayed in Fig. 5 for two doping levels; as mentioned earlier, cracking due to the intercalation of water prevents displaying these data on an absolute scale. Previous x-ray absorption and photoemission work on powders of SrFeO3-x, Sr2FeO4-x and Sr3Fe2O7-δ indicated a decrease in bandwidth as the dimensionality was lowered,Abbate et al. (2004, 2005) and previous resistivity measurements on Sr3Fe2O7-δ indicated this material to be weakly insulating, with a small excitation gap.Adler (1997); Rozenberg et al. (1999) Our data are fully consistent with these results. In contrast to the three-dimensional cubic perovskite SrFeO3-x, which is metallic for high oxygen contents (becoming insulating at low temperatures as oxygen is removed), Sr3Fe2O7-δ shows insulating low-temperature behavior even at high doping levels. At high oxygen contents, the resistivity below the magnetic transition follows an exponentially-activated form consistent with three-dimensional variable-range hopping, while a fully-deoxygenated crystal obeys a form indicative of a meV gap. There are no indications of hysteresis and minimal field dependence in fields up to 8 T.
The resistivity data for small exhibit anomalies in the temperature-dependent resistivity at phase transitions; these are most clearly visible in the derivative, calculated from a linear interpolation of the data. For , the resistivity anomalies coincide with the critical temperatures for charge disproportionation () and magnetic ordering extracted from earlier Mößbauer data Kuzushita et al. (2000) and from the magnetization and neutron scattering data reported above, respectively. Although the temperature range of our data above the charge-disproportionation transition is limited, the substantial resistivity upturn below this temperature indicates that the weakly-insulating character is a consequence of the correlation-driven charge disproportionation instability, rather than disorder. With increasing , the charge disproportionation transition becomes indistinct (Fig. 5).
IV Conclusion
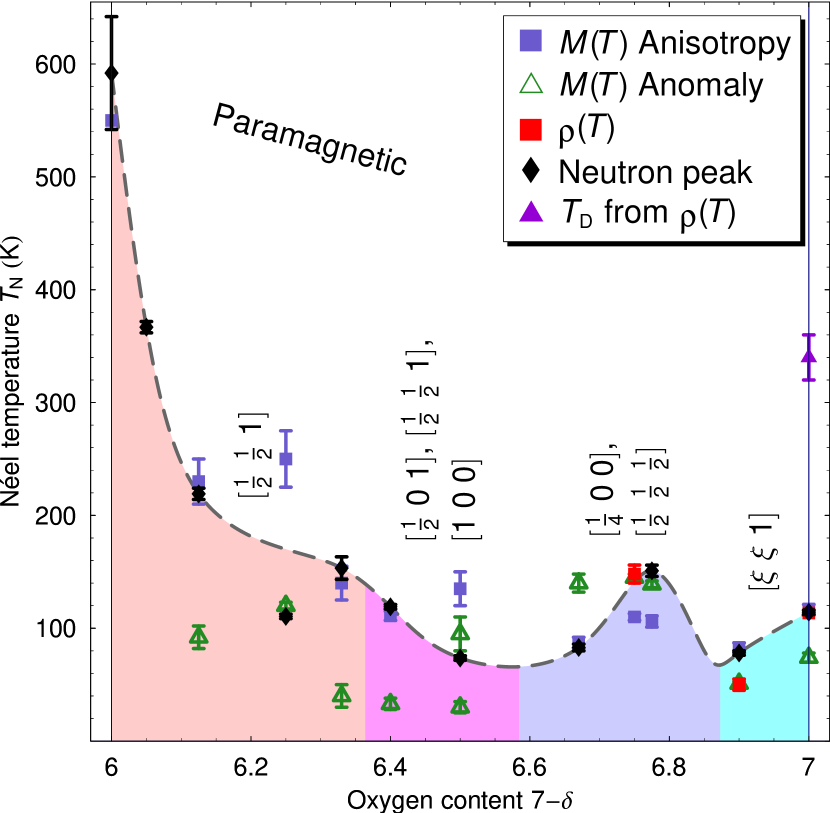
Figure 6 provides a synopsis of the phase diagram compiled from the susceptibility, neutron diffraction, and resistivity data presented here. The insulating end member Sr3Fe2O6.00, whose spin system is made up entirely of Fe3+ moments, exhibits commensurate antiferromagnetism with K. This indicates strong unfrustrated superexchange interactions, analogous to its three-dimensional counterparts BiFeO3Sosnowska et al. (1996) and NdFeO3,Bartolome et al. (1997) whose Néel temperatures are comparable.
Fully-oxygenated Sr3Fe2O7.00, with a spin system comprised entirely of Fe4+ moments, exhibits a sequence of charge-disproportionation and antiferromagnetic phase transitions in close analogy to CaFeO3, which hosts a three-dimensional network of Fe4+ moments.Takano et al. (1977); Takano and Takeda (1983); Woodward et al. (2000) The former transition generates a small charge excitation gap. The antiferromagnetic state is characterized by incommensurate long-range order indicative of competing interactions in the iron oxide bilayers, as a result of which the Néel temperature is much lower than that of Sr3Fe2O6.00 despite the larger moment. The data presented here are not sufficient to establish whether the magnetism at any doping is helical, but the incommensurate magnetism found at and near fully-oxygenated Sr3Fe2O7.00 is reminiscent of that found in SrFeO3.00,Takeda et al. (1972); Reehuis et al. (2012) where helical order was demonstrated by a detailed refinement of neutron diffraction data. Refining the magnetic structures identified in Sr3Fe2O7-δ is an important task for future research. If one of the magnetic phases is indeed found to be helical, it will constitute one of the few examples of a quasi-two-dimensional helical magnet. Since helical spin correlations have been proposed as an explanation for the magnetism of underdoped La2-xSrxCuO4 between the superconducting and antiferromagnetic phases,Lüscher et al. (2007) Sr3Fe2O7-δ may turn out to be a model system for such magnetism, offering crucial context for the cuprates.
For intermediate oxygen contents, different forms of magnetic order are observed, with transition temperatures that do not approach zero as previously proposed. This indicates that Fe3+-Fe4+ interactions and oxygen vacancies frustrate the exchange interactions in a non-trivial manner. Similar observations have been made in SrFeO3-x.Reehuis et al. (2012) The nature and origin of the frustration, the magnetic propagation vectors, and the order associated with the susceptibility anomalies in Fig. 6, are interesting subjects for future research.
Acknowledgements.
We thank O. P. Sushkov and G. Khaliullin for helpful discussions, the members of the MPI-FKF Crystal Growth group and Jansen’s Department for assistance, and the German Science Foundation (DFG) for financial support under collaborative grant No. SFB/TRR 80. A portion of this work was carried out at the Swiss spallation neutron source SINQ, Paul-Scherrer-Institut, Villigen, Switzerland.References
- Takano et al. (1977) M. Takano, N. Nakanishi, Y. Takeda, S. Naka, and T. Takada, Mat. Res. Bull. 12, 923 (1977).
- Takano and Takeda (1983) M. Takano and Y. Takeda, Bull. Inst. Chem. Res., Kyoto Univ. 61, 406 (1983).
- Takeda et al. (1972) T. Takeda, Y. Yamaguchi, and H. Watanabe, J. Phys. Soc. Japan 33, 967 (1972).
- Woodward et al. (2000) P. M. Woodward, D. E. Cox, E. Moshopoulou, A. W. Sleight, and S. Morimoto, Phys. Rev. B 62, 844 (2000).
- Reehuis et al. (2012) M. Reehuis, C. Ulrich, A. Maljuk, C. Niedermayer, B. Ouladdiaf, A. Hoser, T. Hofmann, and B. Keimer, Phys. Rev. B 85, 184109 (2012).
- Adler (1997) P. Adler, J. Solid State Chem. 130, 129 (1997).
- Kuzushita et al. (2000) K. Kuzushita, S. Morimoto, S. Nasu, and S. Nakamura, J. Phys. Soc. Japan 69, 2767 (2000).
- Dann et al. (1993) S. E. Dann, M. T. Weller, and D. B. Currie, J. Mater. Chem. 3, 1231 (1993).
- Rozenberg et al. (1999) G. K. Rozenberg, G. Y. Machavariani, M. P. Pasternak, A. P. Milner, G. R. Hearne, R. D. Taylor, and P. Adler, Phys. Stat. Sol. (b) 211, 351 (1999).
- Abbate et al. (2004) M. Abbate, H. Ascolani, F. Prado, and A. Caneiro, Solid State Commun. 129, 113 (2004).
- Huang et al. (2001) K. Huang, J. Wan, and J. B. Goodenough, J. Mat. Sci. 36, 1093 (2001).
- Ralph et al. (2001) J. M. Ralph, A. C. Schoeler, and M. Krumpelt, J. Mat. Sci. 36, 1161 (2001).
- Wincewicz and Cooper (2004) K. C. Wincewicz and J. S. Cooper, J. Power Sources 140, 280 (2004).
- Mogni et al. (2005) L. Mogni, J. Fouletier, F. Prado, and A. Caneiro, J. Solid State Chem. 178, 2715 (2005).
- Prado et al. (2007) F. Prado, L. Mogni, G. Cuello, and A. Caneiro, Solid State Ionics 178, 77 (2007).
- Mizusaki et al. (1992) J. Mizusaki, M. Okayasu, S. Yamauchi, and K. Fueki, J. Solid State Chem. 99, 166 (1992).
- Hodges et al. (2000) J. P. Hodges, S. Short, J. D. Jorgensen, X. Xiong, B. Dabrowski, S. M. Mini, and C. W. Kimball, J. Solid State Chem. 151, 190 (2000).
- Lebon et al. (2004) A. Lebon, P. Adler, C. Bernhard, A. V. Boris, A. V. Pimenov, A. Maljuk, C. T. Lin, C. Ulrich, and B. Keimer, Phys. Rev. Lett. 92, 037202 (2004).
- Adler et al. (2006) P. Adler, A. Lebon, V. Damljanović, C. Ulrich, C. Bernhard, A. V. Boris, A. Maljuk, C. T. Lin, and B. Keimer, Phys. Rev. B 73, 094451 (2006).
- Ishiwata et al. (2011) S. Ishiwata, M. Tokunaga, Y. Kaneko, D. Okuyama, Y. Tokunaga, S. Wakimoto, K. Kakurai, T. Arima, Y. Taguchi, and Y. Tokura, Phys. Rev. B 84, 054427 (2011).
- Dann et al. (1992) S. E. Dann, M. T. Weller, and D. B. Currie, J. Solid State Chem. 97, 179 (1992).
- MacChesney et al. (1966) J. B. MacChesney, H. J. Williams, R. C. Sherwood, and J. F. Potter, Mat. Res. Bull. 1, 113 (1966).
- Maljuk et al. (2004) A. Maljuk, J. Strempfer, C. Ulrich, M. Sofin, L. Capogna, C. T. Lin, and B. Keimer, J. Cryst. Growth 273, 207 (2004).
- (24) M. Reehuis, Private communication.
- Adler et al. (1999) P. Adler, U. Schwarz, K. Syassen, G. K. Rozenberg, G. Y. Machavariani, A. P. Milner, M. P. Pasternak, and M. Hanfland, Phys. Rev. B 60, 4609 (1999).
- Prado et al. (2001) F. Prado, T. Armstrong, A. Caneiro, and A. Manthiram, J. Electrochem. Soc. 148, J7 (2001).
- Shilova et al. (2002) Y. A. Shilova, M. V. Patrakeev, E. B. Mitberg, I. A. Leonidov, V. L. Kozhevnikov, and K. R. Poeppelmeier, J. Solid State Chem. 168, 275 (2002).
- Brisi (1961) C. Brisi, Ann. Chim. (Rome) 51, 1399 (1961).
- Wilkinson et al. (1988) C. Wilkinson, H. W. Khamis, R. F. D. Stansfield, and G. J. McIntyre, J. Appl. Cryst. 21, 471 (1988).
- Abbate et al. (2005) M. Abbate, L. Mogni, F. Prado, and A. Caneiro, Phys. Rev. B 71, 195113 (2005).
- Sosnowska et al. (1996) I. Sosnowska, R. Przeniosło, P. Fischer, and V. A. Murashov, J. Magn. Magn. Mater. 160, 384 (1996).
- Bartolome et al. (1997) J. Bartolome, E. Palacios, M. D. Kuzmin, F. Bartolome, I. Sosnowska, R. Przenioslo, R. Sonntag, and M. M. Lukina, Phys. Rev. B 55, 11432 (1997).
- Lüscher et al. (2007) A. Lüscher, A. I. Milstein, and O. P. Sushkov, Phys. Rev. Lett. 98, 037001 (2007).