Vitreous silica distends in helium gas: acoustic vs. static compressibilities
Abstract
Sound velocities of vitreous silica are measured under He compression in the pressure range 0-6 GPa by Brillouin light scattering. It is found that the well-known anomalous maximum in the pressure dependence of the compressibility is suppressed by He incorporation into the silica network. This shows that the elastic anomaly relates to the collapse of the largest interstitial voids in the structure. The huge difference between the static and the acoustic compressibilities indicates that the amount of incorporated helium still increases at 6 GPa.
Silica is important for countless reasons. In its vitreous form, -SiO2, it finds a considerable number of technical applications. Further, it is a prototypal glass-forming material of fundamental interest. Thus, -SiO2 has been extensively studied over large pressure () and temperature () ranges Hemley et al. (1986); Inamura et al. (2004); Sato and Funamori (2008); Benmore et al. (2010); Rufflé et al. (2010); Sen et al. (2004); Trachenko et al. (2004). Several anomalous physical properties were discovered. In particular, the compressibility does not show the and dependencies observed in most solids. As is increased at room , first increases to reach a maximum around 2 GPa and it decreases thereafter Bridgman and Simon (1953); Schroeder et al. (1990). The variation of with is also anomalous. It decreases as increases above ambient up to the glass transition Krause and Kurkjian (1968); Polian et al. (2002); Vacher et al. (2005). The relation of these anomalies to the structure of -SiO2 remains debated.
Two different models, supported by numerical simulations, have been proposed. In a first one, the changes of with and are related to structural modifications associated with rotations of SiOSi bonds in six-membered rings, similar to those occurring in the phase transition of cristobalite Huang and Kieffer (2004); Liang et al. (2007). This was termed a local progressive transition. Alternatively, in a model based on network flexibility, is maximum in an intermediate range of over which volume changes can be accommodated by low-energy buckling of the “floppy” tetrahedral network Walker et al. (2007). Both approaches rely on the existence of a sufficiently large free volume allowing strong structural modifications with and . The mass density of -SiO2 is indeed rather small compared to crystal quartz. Also, the fact that -SiO2 can be permanently densified by more than 20% by pressurization at 20 GPa Susman et al. (1991); Polian and Grimsditch (1990) indicates that the free volume is unusually large.
The distribution of interstitial voids in glasses can be investigated by studying gas solubility. Results for -SiO2 were analyzed assuming a log-normal distribution of voids, with a diameter around 0.2 nm and a width of about 0.1 nm Shackelford and Masaryk (1978); Shackelford (1999), in agreement with numerical simulations Chan and Elliott (1991). Thermal motions in the glass open the voids to gas atoms. A solubility 0.0084 mol/cm3/GPa was found for He in -SiO2 at up to 0.13 GPa Shelby (1976).
Recent publications Shen et al. (2011); Sato et al. (2011) revealed that -SiO2 submitted to high in He atmosphere exhibits a surprisingly small change in volume. This was interpreted as a considerable reduction of compressibility Sato et al. (2011), leading to an apparent bulk modulus 110 GPa near ambient . This can be called the static compressibility. Another can be calculated from the longitudinal () and transverse () sound velocities, and the density , all known at ambient , . One finds an acoustic modulus 36.5 GPa. This large difference in compressibilities must relate to the open structure of -SiO2 allowing He to distend the network in the static limit.
In this Letter, we present Brillouin light-scattering (BLS) measurements of the sound velocity for the longitudinal and transverse acoustic modes as a function of up to 6 GPa in He atmosphere not . We show that the elastic moduli are relatively weakly affected by the presence of He, while the minimum in the acoustic bulk modulus is almost completely suppressed.
The samples are Suprasil F300 containing less than 1 ppm OH supplied by Heraeus Quartzglass, Germany. We use platelets of 56 m thickness and about 100 m lateral dimensions. The hydrostatic pressure is applied in a Chervin-type diamond-anvil cell Chervin et al. (1995) with diamond culets of 800 m diameter. The pressure transmitting media are either He or a non-penetrating pressurizing medium (NPPM), namely a methanol-ethanol 4:1 mixture (ME 4:1). is measured by the ruby-fluorescence technique Chervin et al. (2001).
BLS experiments are performed using the 514.5 nm line of a single frequency argon-ion laser. We use two different arrangements. The first employs a Sandercock 3+3 pass system using two plane Fabry-Perot’s (FP) in tandem Lindsay et al. (1981). The sample is placed in the platelet geometry with an external scattering angle ˚(see inset in Fig. 1). In this case, the Brillouin frequency shift is given by , where is the angular frequency of the incident light, the sound velocity, and the light velocity in vacuum. This configuration allows transverse and longitudinal modes to be observed on the same spectrum, as shown in Fig. 1a.
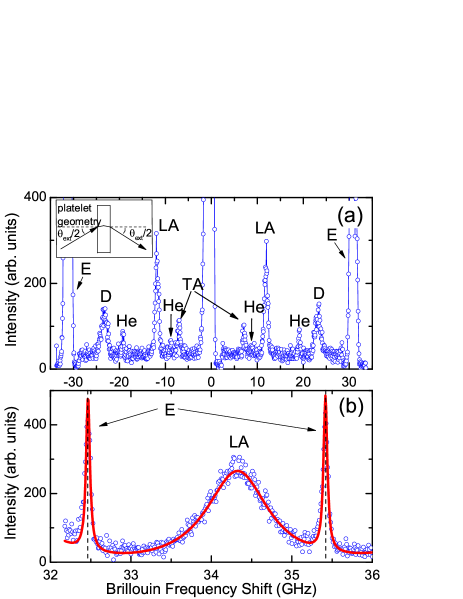
We also use a high resolution spectrometer (HRS) which consists of a plane and a confocal FP in tandem Sussner and Vacher (1979); Rat et al. (2005). This HRS, employed in the backscattering configuration, allows measuring the frequency shifts of longitudinal modes with an accuracy of about 3 MHz. In this case, is given by where is the refractive index at the laser wavelength. The typical spectrum in Fig. 1b shows the longitudinal Brillouin line at 3.4 GPa, strongly broadened, and two elastic peaks. Owing to the small free spectral range of the confocal FP, the Brillouin peak and the elastic peaks are observed at different interference orders. For both series of experiments, the frequency shifts and the linewidths are obtained by fitting the Brillouin lines to a damped harmonic oscillator convoluted with the instrumental profile. The profiles are corrected for the broadening introduced by the small sample size Vacher et al. (2006), as well as for the finite collection aperture.
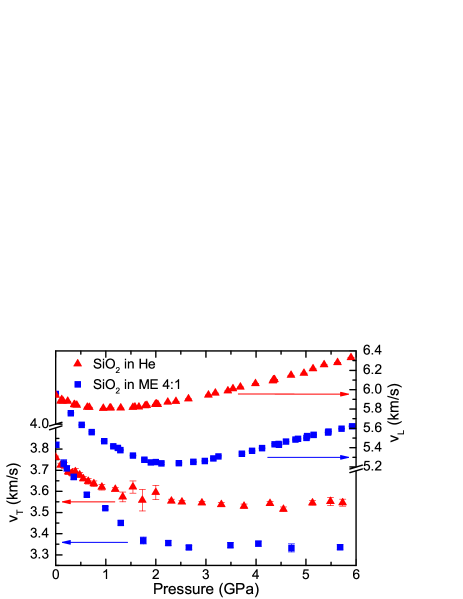
The Brillouin frequency shift of the longitudinal mode was measured with both spectrometers at room with up to 6 GPa. Comparing the data at the same in both geometries gives of -SiO2 in He, , with in GPa. This variation of with is smaller that that observed in a NPPM in this range, Zha et al. (1994). The value of is then used to extract from the more precise HRS data. The results are shown in Fig. 2 together with our previous results obtained with the NPPM Ayrinhac et al. (2011). The very small scattering of data points should be noted. Comparing values in both media, three remarks are immediate: the numerical values are quite similar, however, the minimum at 2 GPa with the NPPM is strongly reduced in He, and the slopes above 3 GPa are very similar. As for the transverse modes, they are silent in backscattering so that the only results for , shown in Fig. 2, are from measurements in the platelet geometry. The new data in the NPPM are very similar to these already known from the literature Zha et al. (1994); Polian and Grimsditch (1993). As for the longitudinal mode, the numerical values for the two data sets shown are similar. The decrease observed between ambient pressure and 2 GPa under NPPM is reduced, but not suppressed.
One of the most surprising results of Refs Shen et al. (2011); Sato et al. (2011) is the very small change in volume of -SiO2 when compressed under He. Such a strong effect of the pressurizing medium on the static compressibility is usually observed in materials with an open porosity, such as e.g. zeolites Hazen (1983); Chapman et al. (2008); Haines et al. (2010). It results from pore filling by molecules of the pressurizing medium. For an homogeneous non-porous material, the relative change of volume under can be calculated from the sound velocities Cook (1957),
| (1) |
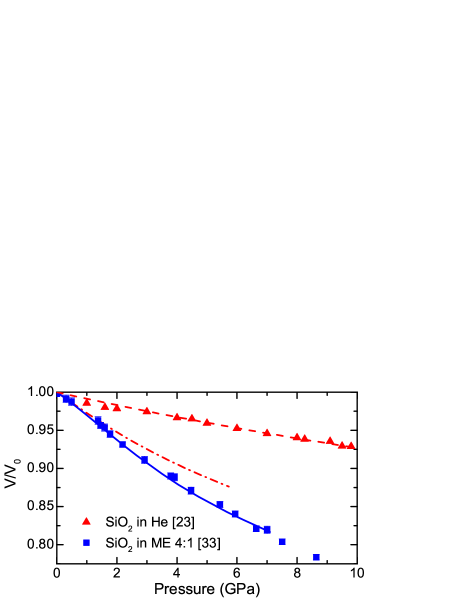
where and are the volume and the mass density at pressure . In Fig. 3, we plot the measured for -SiO2 in a NPPM. The experimental data (squares) are in excellent agreement with the values calculated from and in ME 4:1 (solid line), as already noted by several authors (see e.g. Ref Schroeder et al. (1990); Kondo et al. (1981)). If Eq. (1) is applied to -SiO2 pressurized under He using the results of Fig. 2, the dashed-dotted curve is found. The disagreement with the experimental data (triangles) is obvious. Eq. (1) fails because , which is a direct consequence of the He penetration.
Turning now to the pressure dependence of the bulk modulus, the static value for -SiO2 in He can be derived from the volume change. This is done using a 2nd order Birch-Murnaghan fit Birch (1947) of shown by the dashed line in Fig. 3. This allows calculating plotted in Fig. 4a. It shows a linear increase from GPa at GPa to 135 GPa at 6 GPa. These values are surprisingly high. It is worth posing here to clarify the meaning of this measurement. The static is obtained by comparing the sizes of the sample at different pressures. As He penetrates the network, a change in composition results from a pressure change. Hence, the static measurement of is not performed on a closed system. This is the effective compressibility of an open system. It is different from the acoustic compressibility. The BLS experiment probes the elastic moduli of the composite as a closed system. Indeed, the frequency of the strain wave is high, GHz, so that the He concentration in the sample cannot change over the period of the acoustic wave. The interest in comparing static and acoustic compressibilities is that their difference relates to the rate of He inclusion in -SiO2.
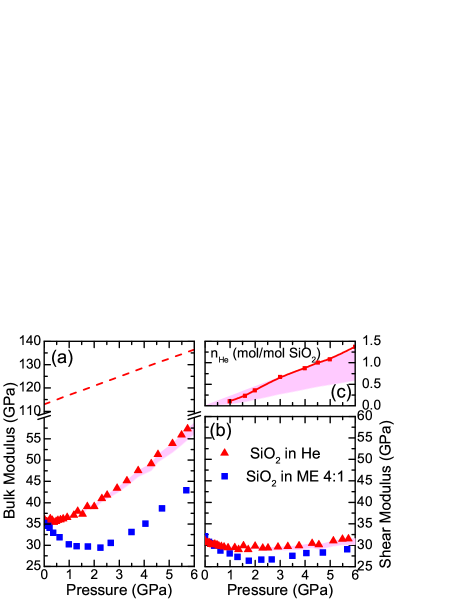
From the velocity measurements shown in Fig. 2 it is possible to calculate the variation with of the elastic moduli, provided the corresponding values of the density of the medium are known. In the NPPM case, this is easily achieved with Eq. 1. The results are shown as squares in Fig. 4a and Fig. 4b. As already known, the bulk modulus decreases to a minimum around 2 GPa and increases thereafter Bridgman and Simon (1953); Schroeder et al. (1990); Kondo et al. (1981). The shear modulus has a similar variation, with a much smaller amplitude. With He penetrating inside the network, the density to take into account in the equation of motion is that of a composite material made of -SiO2 and He atoms. It can be calculated if the change in volume of the sample and the amount of He are known. The latter can be evaluated by various methods. Starting from the solubility measured from ambient to 0.13 GPa Shelby (1976), and assuming that this remains valid at higher , the higher limit of the shadowed region in Fig. 4c is obtained. A second estimate is proposed in Ref. Sato et al. (2011). It assumes that the volume difference between the sample under He compression and the sample compressed in NPPM is filled with He fluid in equilibrium. This provides the lower limit of the shadowed region in Fig. 4c. These estimates are much larger than the value 0.1 mole per mole SiO2 calculated at ambient pressure from the distribution of voids in a numerical simulation Chan and Elliott (1991).
From the measured with , we can also derive an estimate of the amount of He entering -SiO2. To this effect we apply the Clausius-Mossotti relation to the composite sample,
| (2) |
where is the permittivity of free space. Here is the refractive index of the composite, and are the number densities of SiO2 and He, respectively, and the ’s are the polarizabilities. For He, we take cm3, approximated as constant. is available from the observed volume change in He shown in Fig. 3. To estimate , we assume that the volume calculated from measured by BLS, the dashed-dotted line in Fig. 3, is that occupied by the SiO2 skeleton in the composite. Its polarizability is taken equal to that of -SiO2 in NPPM at the same , known from applying the Clausius-Mossotti relation to . Eq. (2) gives then , shown as a solid line in Fig. 4c. Remarkably, this line extrapolates the known solubility at low pressures Shelby (1976), supporting this approach. It suggests that the He solubility remains constant over our -range, leading to 1.3 mole of He per mole of SiO2 at 6 GPa.
From these various evaluations of the He content, estimates for are obtained which are used together with the measured velocities to calculate the elastic moduli. The triangles in Fig. 4a and 4b are obtained using the values determined from , as just explained. The shadowed regions in the same figures correspond to the two limits for explained above. These shadowed regions are very narrow, as the contribution of the exact amount of He to is relatively minor. is almost constant over the range of . From measurements of the variation of the elastic constants with in crystals, it is known that compression quite generally produces an increase of the elastic constants associated with compressive modes, while those associated with shear modes can either increase or decrease Calderon et al. (2007); Jiang et al. (2009). The conclusion is that in -SiO2 shear is quite insensitive to compression.
The decrease of with increasing up to 2 GPa in NPPM can be explained by interstitial voids that are progressively suppressed, and that this collapse is associated to local structural changes making the network more compliant. Above 2 GPa, -SiO2 is sufficiently compact to start behaving as a normal homogeneous solid under further compression. Then increases almost linearly with . A striking result of our study is that, with He as pressurizing medium, the anomalous decrease of with increasing practically disappears. is nearly constant up to 1 GPa and increases thereafter. This indicates that, even in the first stages of compression, He penetrates in the largest voids and prevents their collapse, in line with the conclusions of earlier publications Shen et al. (2011); Sato et al. (2011). The structural rearrangements leading to the anomalous softening in a NPPM are no longer allowed, and the usual increase of with is then observed. At larger than 2 GPa, the compression of the network in presence of He is thus very similar to that observed with a NPPM.
In summary, our results demonstrate that the minima observed in and when is increased with a NPPM are suppressed when the compression is made under He. The minimum observed in a NPPM owing to the inter-tetrahedral flexibility is to a large extent hindered by the penetration of helium atoms in the silica network. It would be interesting knowing from numerical simulations how the presence of He changes the dynamics of SiOSi flips, or of the “soft modes”, in the two models described in the introduction Huang and Kieffer (2004); Liang et al. (2007); Walker et al. (2007). Another important result is that the acoustic bulk modulus is less than half the static one. It must be stressed that the former is measured at constant He concentration, owing to the high frequency of the probed acoustic waves, while the later describes a composite in which the amount of He varies. In an open system, the static measurement underestimates the compressibility by a term due to the gas charging the composite. The large difference found here demonstrates that He continues penetrating -SiO2 up to our highest investigated .
Acknowledgements.
The authors thank Eric Courtens for his critical and creative readings of the manuscript, as well as Julien Haines, Jérôme Rouquette and Benoît Coasne for stimulating discussion. It is also a pleasure to thank Sébastien Clément and Rémy Vialla for their help in the course of the experiments. This work was partially funded by Région Languedoc-Roussillon (Omega Platform).References
- Hemley et al. (1986) R. J. Hemley, H. K. Mao, P. M. Bell, and B. O. Mysen, Phys. Rev. Lett. 57, 747 (1986).
- Inamura et al. (2004) Y. Inamura, Y. Katayama, W. Utsumi, and K.-i. Funakoshi, Phys. Rev. Lett. 93, 015501 (2004).
- Sato and Funamori (2008) T. Sato and N. Funamori, Phys. Rev. Lett. 101, 255502 (2008).
- Benmore et al. (2010) C. J. Benmore, E. Soignard, S. A. Amin, M. Guthrie, S. D. Shastri, P. L. Lee, and J. L. Yarger, Phys. Rev. B 81, 054105 (2010).
- Rufflé et al. (2010) B. Rufflé, S. Ayrinhac, E. Courtens, R. Vacher, M. Foret, A. Wischnewski, and U. Buchenau, Phys. Rev. Lett. 104, 067402 (2010).
- Sen et al. (2004) S. Sen, R. L. Andrus, D. E. Baker, and M. T. Murtagh, Phys. Rev. Lett. 93, 125902 (2004).
- Trachenko et al. (2004) K. Trachenko, M. T. Dove, V. Brazhkin, and F. S. El’kin, Phys. Rev. Lett. 93, 135502 (2004).
- Bridgman and Simon (1953) P. W. Bridgman and I. Simon, J. Appl. Phys. 24, 405 (1953).
- Schroeder et al. (1990) J. Schroeder, T. G. Bilodeau, and X. Zhao, High Press. Res. 4, 531 (1990).
- Krause and Kurkjian (1968) J. Krause and C. Kurkjian, J. Am. Ceram. Soc. 51, 226 (1968).
- Polian et al. (2002) A. Polian, D. Vo-Thanh, and P. Richet, Europhys. Lett. 57, 375 (2002).
- Vacher et al. (2005) R. Vacher, E. Courtens, and M. Foret, Phys. Rev. B 72, 214205 (2005).
- Huang and Kieffer (2004) L. Huang and J. Kieffer, Phys. Rev. B 69, 224203 (2004).
- Liang et al. (2007) Y. Liang, C. R. Miranda, and S. Scandolo, Phys. Rev. B 75, 024205 (2007).
- Walker et al. (2007) A. M. Walker, L. A. Sullivan, K. Trachenko, R. P. Bruin, T. O. H. White, M. T. Dove, R. P. Tyer, I. T. Todorov, and S. A. Wells, J. Phys. Condens. Mat. 19, 275210 (2007).
- Susman et al. (1991) S. Susman, K. J. Volin, D. L. Price, M. Grimsditch, J. P. Rino, R. K. Kalia, P. Vashishta, G. Gwanmesia, Y. Wang, and R. C. Liebermann, Phys. Rev. B 43, 1194 (1991).
- Polian and Grimsditch (1990) A. Polian and M. Grimsditch, Phys. Rev. B 41, 6086 (1990).
- Shackelford and Masaryk (1978) J. F. Shackelford and J. S. Masaryk, J. Non-Cryst. Solids 30, 127 (1978).
- Shackelford (1999) J. F. Shackelford, J. Non-Cryst. Solids 253, 231 (1999).
- Chan and Elliott (1991) S. L. Chan and S. R. Elliott, Phys. Rev. B 43, 4423 (1991).
- Shelby (1976) J. E. Shelby, J. Appl. Phys. 47, 135 (1976).
- Shen et al. (2011) G. Shen, Q. Mei, V. B. Prakapenka, P. Lazor, S. Sinogeikin, Y. Meng, and C. Park, Proc. Natl. Acad. Sci. 108, 6004 (2011).
- Sato et al. (2011) T. Sato, N. Funamori, and T. Yagi, Nature Comm. 2, 345 (2011).
- (24) Our measurements are performed in the elastic reversible domain, well below the region in which permanent densification occurs in a non-penetrating pressurizing medium .
- Chervin et al. (1995) J. C. Chervin, B. Canny, J. M. Besson, and P. Pruzan, Rev. Sci. Instrum. 66, 2595 (1995).
- Chervin et al. (2001) J. C. Chervin, B. Canny, and M. Mancinelli, High Press. Res. 21, 305 (2001).
- Lindsay et al. (1981) S. M. Lindsay, M. W. Anderson, and J. R. Sandercock, Rev. Sci. Instrum. 52, 1478 (1981).
- Sussner and Vacher (1979) H. Sussner and R. Vacher, App. Optics 18, 3815–3818 (1979).
- Rat et al. (2005) E. Rat, M. Foret, G. Massiera, R. Vialla, M. Arai, R. Vacher, and E. Courtens, Phys. Rev. B 72, 214204 (2005).
- Vacher et al. (2006) R. Vacher, S. Ayrinhac, M. Foret, B. Rufflé, and E. Courtens, Phys. Rev. B 74, 012203 (2006).
- Zha et al. (1994) C.-S. Zha, R. J. Hemley, H.-K. Mao, T. S. Duffy, and C. Meade, Phys. Rev. B 50, 13105 (1994).
- Ayrinhac et al. (2011) S. Ayrinhac, B. Rufflé, M. Foret, H. Tran, S. Clément, R. Vialla, R. Vacher, J. C. Chervin, P. Munsch, and A. Polian, Phys. Rev. B 84, 024201 (2011).
- Polian and Grimsditch (1993) A. Polian and M. Grimsditch, Phys. Rev. B 47, 13979 (1993).
- Meade and Jeanloz (1987) C. Meade and R. Jeanloz, Phys. Rev. B 35, 236 (1987).
- Birch (1947) F. Birch, Phys. Rev. 71, 809 (1947).
- Hazen (1983) R. M. Hazen, Science 219, 1065 (1983).
- Chapman et al. (2008) K. W. Chapman, G. J. Halder, and P. J. Chupas, J. Am. Chem. Soc. 130, 10524 (2008).
- Haines et al. (2010) J. Haines, O. Cambon, C. Levelut, M. Santoro, F. Gorelli, and G. Garbarino, J. Am. Chem. Soc. 132, 8860 (2010).
- Cook (1957) R. K. Cook, J. Acoust. Soc. Am. 29, 445 (1957).
- Kondo et al. (1981) K.-I. Kondo, S. Iio, and A. Sawaoka, J. App. Phys. 52, 2826 (1981).
- Calderon et al. (2007) E. Calderon, M. Gauthier, F. Decremps, G. Hamel, G. Syfosse, and A. Polian, J. Phys. Condens. Mat. 19, 436228 (2007).
- Jiang et al. (2009) F. Jiang, G. D. Gwanmesia, T. I. Dyuzheva, and T. S. Duffy, Phys. Earth Planet. Inter. 172, 235 (2009).