Protoplanetary disk structure with grain evolution:
The ANDES model
Abstract
We present a self-consistent model of a protoplanetary disk: ‘ANDES’ (‘AccretioN disk with Dust Evolution and Sedimentation’). ANDES is based on a flexible and extendable modular structure that includes 1) a 1+1D frequency-dependent continuum radiative transfer module, 2) a module to calculate the chemical evolution using an extended gas-grain network with UV/X-ray-driven processes surface reactions, 3) a module to calculate the gas thermal energy balance, and 4) a 1+1D module that simulates dust grain evolution. For the first time, grain evolution and time-dependent molecular chemistry are included in a protoplanetary disk model. We find that grain growth and sedimentation of large grains to the disk midplane lead to a dust-depleted atmosphere. Consequently, dust and gas temperatures become higher in the inner disk ( AU) and lower in the outer disk ( AU), in comparison with the disk model with pristine dust. The response of disk chemical structure to the dust growth and sedimentation is twofold. First, due to higher transparency a partly UV-shielded molecular layer is shifted closer to the dense midplane. Second, the presence of big grains in the disk midplane delays the freeze-out of volatile gas-phase species such as CO there, while in adjacent upper layers the depletion is still effective. Molecular concentrations and thus column densities of many species are enhanced in the disk model with dust evolution, e.g., CO2, NH2CN, HNO, H2O, HCOOH, HCN, CO. We also show that time-dependent chemistry is important for a proper description of gas thermal balance.
Subject headings:
accretion, accretion disks – circumstellar matter – stars: formation – stars: pre-main-sequence, astrochemistry1. Introduction
The planet formation and, in particular, the origin of the Solar System are among the most fascinating astrophysical problems that are far from being fully understood. The quickly growing number of detected exoplanets hints to ubiquitous planet formation in our Galaxy. Space-born facilities (e.g., Hubble, Spitzer, Herschel) as well as ground-based observatories (e.g., VLT, Keck, Subaru, PdBI, IRAM 30-m, SMA, early ALMA) provide unique information on the appearance, structure, chemical composition, and evolution of nearby protoplanetary disks (e.g., Dutrey et al., 1997; Fukagawa et al., 2004; Andrews & Williams, 2005; Hernández et al., 2007; Natta et al., 2007; Semenov et al., 2010; Sturm et al., 2010; Muto et al., 2012). Relatively compact sizes of AU and low masses of M⊙ make disks a challenging target for observational studies.
Another obstacle to investigate the formation of planets is an enormous range of physical conditions encountered in a protoplanetary disk and a wide variety of interrelated processes (e.g., Williams & Cieza, 2011). The combined action of these processes defines the appearance of the disk in scattered light, dust continuum, and atomic and molecular lines. Modeling of continuum and line radiation implies knowing stellar spectrum, dust density, dust temperature, and size distribution as well as gas density, gas temperature, and molecular content throughout the disk, and in full 3D. If all this information is available, a multi-dimensional radiation transfer (RT) model can be used to build a synthetic disk map at any wavelength (e.g., Whitney & Hartmann, 1992; Men’shchikov & Henning, 1997; Wolf et al., 1999; Dullemond et al., 2002). Due to computational difficulties to follow global disk evolution in 3D-MHD, particularly, coupled with chemical kinetics models, and the lack of necessary constraints related to the magnetic field structure, turbulence, grain size distribution, etc., a disk model needs to be simplified. One can steadily approach the warranted level of physical complexity by adding new components to the model (e.g., going from 1D to 2D geometry or from gray to non-gray radiative transfer) and comparing with observations at each development step.
A number of disk models has been developed over time (see review in Dullemond et al., 2007b). These models have been based on an RT-based disk structure (either 1D, 1+1D/2D, or 3D), molecular abundances, and dust and gas thermal balance. Disk models with detailed vertical structure and thermal balance regulated solely by dust heating and cooling, and, in some cases, accretion heating, have been developed by, e.g., Bell et al. (1997); Chiang & Goldreich (1997); Men’shchikov & Henning (1997); Dullemond & Dominik (2004); Hueso & Guillot (2005). It has been typically assumed in such studies that the dust is well mixed with the gas, and its properties do not differ from properties of the ISM dust. One of the most widely used models of this kind has been developed by D’Alessio et al. (1998, 1999). It has been extensively used in many subsequent studies as a template of the disk density and temperature distribution (e.g., Chiang et al., 2001; Semenov et al., 2004; Furlan et al., 2006). Other similar models, utilizing more accurate frequency-dependent RT algorithms or other improvements (e.g., a full 2D geometry, evolving disk structure, more realistic dust opacities) have been presented by Malbet et al. (2001); Dullemond (2002); Nomura (2002); Gorti et al. (2009), to name a few.
An important development of the protoplanetary disk models was to account for the energy balance of dust and gas separately in dilute disk regions. There the rate of gas-dust collisions drops so low that the gas becomes thermally decoupled from the dust (e.g., Jonkheid et al., 2004; Kamp & Dullemond, 2004; Gorti & Hollenbach, 2008). The most recent and most advanced addition to this family, the “ProDiMo” model, is presented by Woitke et al. (2009) and updated in Thi et al. (2011) and Aresu et al. (2011). This model is based on iterative calculations of a 1+1D vertical hydrostatic disk structure, 2D frequency-dependent dust continuum RT, gas-grain and FUV-photochemistry to calculate abundances of molecular coolants, and an escape probability method to model non-LTE heating and cooling of the gas. It is derived from thermo-chemical models of Kamp & Bertoldi (2000), Kamp & van Zadelhoff (2001), and Kamp & Dullemond (2004). Since 2011 it includes X-ray-driven chemistry and heating via H2 ionization and Coulomb heating (Aresu et al., 2011). Uniform dust abundances and power-law size distributions are typically assumed (Aresu et al., 2012), with opacities for a dust mixture calculated by Effective Medium Theory (Bruggeman, 1935). Abundances of molecules are calculated assuming chemical equilibrium and element conservation, which may not be a valid approach to disk chemical evolution (e.g., Barshay & Lewis, 1976; Ilgner et al., 2004; Semenov & Wiebe, 2011).
Recent observations at IR and mm-/cm-wavelengths have shown that many disks around young stars of ages Myr have already a deficit of of small grains in the inner regions, AU and the presence of large, pebble-sized dust grains in the midplanes compared to the pristine ISM dust (e.g., Williams & Cieza, 2011; Williams, 2012). From the analysis of SEDs at millimeter and centimeter wavelengths, grain sizes of at least cm have been inferred for many disks (e.g., Rodmann et al., 2006; Lommen et al., 2009, 2010; Ricci et al., 2010; Melis et al., 2011; Pérez et al., 2012). Guilloteau et al. (2011) have used high-resolution interferometric PdBI observations to discern dust emissivity slopes at millimeter wavelengths in a sample of young stars. Their analysis has shown that in the Taurus-Auriga star-forming region some disks show very low dust emissivity indices in the inner regions, characteristic of grains with sizes of mm, and slopes that are indicative of smaller grains toward the disk edges. In addition, Spitzer IR spectroscopy of silicate bands at 10 and 20 m has revealed efficient crystallization and growth of the sub-micron-sized ISM grains in warm disk atmospheres in many young systems, regardless of their ages, accretion rates, and disk masses (e.g., Kessler-Silacci et al., 2006; Furlan et al., 2009; Juhász et al., 2010; McClure et al., 2010; Oliveira et al., 2011; Sicilia-Aguilar et al., 2011). The dust settling associated with grain growth reduces disk scale heights and flaring angles, and thus leads to less intense mid-IR disk emission than expected from conventional hydrostatic models with uniform dust, in accordance with observations of most T Tauri stars (Williams & Cieza, 2011).
As dust is a very important ingredient of the disk physics, evolution of its properties should also be considered in disk models. Usually both the grain growth and sedimentation are accounted for in disk models in a parameterized way, by assuming an increased upper limit of grain size and artificially changing the dust density and the slope of dust size distribution in various disk regions. For example, expanding on their earlier works, D’Alessio et al. (2001) have studied the influence of dust evolution on the disk structure and its spectral energy distribution (SED). Grain growth has been simulated as an increase of up to 10 cm and change of the dust size distribution slope from to . In these models dust has been assumed to be well-mixed with the gas.
To study the effect of dust settling, D’Alessio et al. (2006) have included two dust populations in the model, with different spatial distributions. D’Alessio et al. (2006) shown that the evolved dust model better reproduces observed millimeter fluxes and spectral slopes. A similar approach to study the effect of dust settling on the disk thermal and chemical structure has been taken by Jonkheid et al. (2004) and Fogel et al. (2011). Settling has been simulated using variable dust/gas mass ratio. A variable value has been used by Aikawa & Nomura (2006) to investigate changes in disk density, gas and dust temperature, and molecular abundances due to dust growth.
More accurate methods to model dust growth are mainly based on solving the coagulation (Smoluchowski) equation. Here the main attribute of the model is whether the dust evolution is computed for a fixed disk structure or the dust evolution and disk structure are mutually consistent. The first approach is used, e.g., in Nomura & Nakagawa (2006); Schräpler & Henning (2004); Tanaka et al. (2005); Ciesla (2007), who used parameterized disk structure. The second approach has been used by Schmitt et al. (1997); Tanaka et al. (2005); Nomura et al. (2007); Tannirkulam et al. (2007).
An efficient scheme to tackle the modeling of dust coagulation, fragmentation, sedimentation, turbulent stirring around a ‘snow line’ in a protoplanetary disk has been proposed by Brauer et al. (2008). They have found that major factors affecting grain evolution are trapping of dust particles in gas pressure maxima and the presence of a turbulently quiescent ‘dead zone’ in disk inner midplane. Birnstiel et al. (2010) have updated this model by considering time-dependent viscous evolution of a gas disk. They have found that dust properties, gas pressure gradients, and the strength of turbulence are more important factors for dust evolution than the initial conditions and the early formation phase of the protoplanetary disk. Birnstiel et al. (2011) have shown that, upon evolution, grain size distribution reaches a quasi-steady state, which however, does not follow the standard MRN-like power-law size distribution and is sensitive to the gas surface density, amount of turbulence, and disk thermal structure.
The next step in protoplanetary disk modeling was made by Vasyunin et al. (2011), where detailed dust evolution was considered along with comprehensive set of gas-phase and surface chemical reactions. However, to calculate disk thermal structure, they take into account only two heating sources, namely, viscous dissipation and dust grain irradiation by the central star. It was shown that column densities of some molecules (like C2H, HC2n+1N ( 0–3), H2O and C2H2/HCN abundance ratio) can be used as observational tracers of early stages of the grain evolution in protoplanetary disks.
In this paper, for the first time, we consider the influence of dust evolution on the disk structure by combining the detailed computation of the radiation field with the dust growth, fragmentation, and sedimentation model. When computing the disk density and temperature we take into account the full grain size distribution as a function of location in the disk. Gas temperature and dust temperature are computed separately, with taking into account the disk chemical structure. These two factors represent a major improvement in comparison with Vasyunin et al. (2011)’s model. Also, a new detailed RT treatment is implemented with high frequency resolution from ultraviolet to far infrared. The organization of the paper is the following. In Section 2 the disk model “ANDES” (AccretioN Disk with Dust Evolution and Sedimentation) is described. In Section 3 we present a physical structure for a typical protoplanetary disk computed both for both pristine dust and for evolved dust. Also, the chemical structure is described in this section, and specific features of the disk chemical compositions are presented for various dust models. Discussion and conclusions follow. Details of gas energy balance processes and benchmarking results are presented in Appendix A and B.
2. Disk physical structure
A multitude of processes (gas dynamics, dust evolution, energy transport processes, chemistry, etc.) makes modeling of protoplanetary disks a challenge. With the current level of computing resources a global 3D radiative MHD simulation, including gas and dust evolution and chemical kinetics, remains a topic for the future (but see, e.g., Flock et al. (2012) for such models). Nevertheless a sufficient understanding of protoplanetary disk physics may be achieved by detailed modeling of primary processes that govern its structure and observational characteristics, and simplified modeling of secondary processes. This makes the problem tractable. For Class II objects (Lada, 1987; Evans et al., 2009) it is usually assumed that a disk structure is in a steady-state regime over a time span of Myr. This is supported by observations of disk kinematics via molecular lines and disk surface densities via (sub-)millimeter dust emissivity. The line profiles are indicative of Keplerian motion in most of the disks (Koerner et al., 1993; Guilloteau & Dutrey, 1998; Piétu et al., 2007). The estimates of the disk masses and density distributions show that self-gravity is negligible for Class II objects (Isella et al., 2009). The assumption that these disks evolve on a diffusion timescale and not on a hydrodynamical one allows setting aside hydrodynamical simulations and reducing a 3D problem to a 1+1D problem. The azimuthal dimension is eliminated due to the axial symmetry of an unperturbed disk. The other two dimensions are usually split into the radial structure that is determined by diffusive evolution, and the vertical structure that is derived from the hydrostatic equilibrium equation (D’Alessio et al., 1998; Dullemond et al., 2002). The 1+1D description is suitable for dust continuum radiation transfer. For disk regions outward of a few AU a radial optical depth for a location close to the midplane is higher than the vertical optical depth, so that the dust temperature is mostly determined by vertical diffusion of radiation. A gain in computation time that is acquired by a 1D radiation transfer, compared to a 2D RT, allows better frequency resolution, which is important for dust temperature calculations (Dullemond et al., 2002) and for modeling photochemistry.
In this paper we adopt a 1+1D approach to calculate disk density and temperature. As the disk consist of two main ingredients (dust and gas), the overall problem is reduced to calculating four physical quantities: dust and gas temperatures (), and dust and gas densities (). This allows to split the disk model into four blocks, calculating the corresponding quantities at each disk radius :
-
I.
Dust temperature. Dust temperature and radiation field are found by solving the radiation transfer problem in vertical direction. The following quantities are considered as input: the dust density, its optical properties (absorption and scattering coefficients ), external irradiation and all necessary parameters describing non-radiative dust heating functions.
-
II.
Gas temperature. To determine the gas temperature, we solve the local energy balance equation, accounting for various heating and cooling processes. Since gas heating and cooling rates depend on abundances of main heating/cooling species and their level populations, it is necessary to include chemical reactions and simplified line radiation transport in the gas temperature calculation.
-
III.
Dust density. The dust evolution is an essential part of our disk model. The surface density of dust is assumed to be equal to 1% of the total gas density, whereas its detailed vertical structure and size distribution are determined from the dust growth and sedimentation physics. We consider coagulation and fragmentation of dust grains and their redistribution due to turbulent stirring and gravitational settling to the midplane. We also consider disk structure with for comparison.
-
IV.
Gas density. We assume that the gas vertical structure is defined by the local hydrostatic equilibrium. In this case the gas density can be found if its temperature , mean molecular weight , and surface density are known. The surface density is assumed to be given by the predefined function .
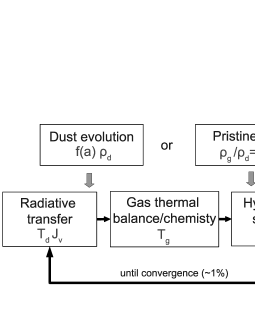
As all these quantities are not independent, we iterate between the modules until convergence is reached. The overall computational flowchart for ANDES is shown in Figure 1. Assuming the surface density profile, we calculate dust evolution for 2 Myr starting from the MRN initial distribution. The resultant dust structure is then used to derive radiation field and gas disk structure using radiation transfer, energy balance and hydrostatic structure modules. As a fiducial dust model we also consider pristine grains with the following parameters: 0.1m in size, astronomical silicate, dust to gas ratio 0.01 at every location in the disk. The list of basic assumptions is: (i) a disk is quasi-static, axially symmetric and treated in 1+1D approach; (ii) the gas surface density is assumed to be specified, and the dust surface density is 0.01 of the gas surface density; (iii) gas vertical structure is determined from the hydrostatic equilibrium, while dust vertical structure is a consequence of turbulent stirring and grain settling. Also, calculating the chemical evolution we keep the dust properties fixed both for pristine and evolved dust cases. Below we describe each part of the model in detail.
2.1. Radiative transfer
The radiation in a protoplanetary disk plays a two-fold role. First, it is a main energy carrier that redistributes energy coming from the stellar irradiation and viscous dissipation, and thus defines the overall disk structure. Second, it determines rates of photoreactions and thus shapes the disk chemical structure and observational appearance. These two aspects pose different requirements to the radiation transfer model. The radiation field as a contributor to the disk energy balance should be known in a wide range of wavelengths, from FUV (radiation from the accretion region and non-thermal radiation from the central star) to visual (thermal stellar radiation) to the infrared and submillimeter wavelengths (thermal disk radiation). This requirement makes multi-dimensional RT approaches with high spectral resolution too slow for iterative disk modeling.
On the other hand, in a narrow range of UV wavelengths (from 912 Å to, say, 4000 Å) such a good spectral resolution is important for accurate calculation of the photochemical rates, as the dependence of photoreaction cross-sections on is complicated. Protoplanetary disks usually have high optical depths at m (e.g., Beckwith & Sargent, 1991), which calls for using suitable methods to solve the radiation transfer (RT) problem for optically thick media. As our primary focus is on the chemical modeling in disks with evolved dust, we developed such a method with a particularly good wavelength resolution in the UV part of the spectrum.
2.1.1 Main equations
It is easy to show that in the cases of Schwarzschild-Schuster and Eddington approximations the RT equation for a plane-parallel 1D medium can be written using the mean intensity :
| (1) |
where [ cm-1] is the extinction coefficient, is the source function, and and for the Schwarzschild-Schuster and the Eddington approximation, respectively.
If we consider only dust continuum absorption, thermal emission, and coherent isotropic scattering, the source function is
| (2) |
Here ] is the absorption coefficient, is the scattering coefficient () and is the Planck function.
In the 1+1D approach the anisotropic scattering by dust grains can also be taken into account. It is important for UV photons interacting with small dust grains, whereas at IR wavelengths scattering can be considered negligible compared to absorption/emission. The parameter describing anisotropy of scattering ( and denote forward and backward scattering, respectively) can be introduced in our RT model in such a way that dust extinction efficiency is substituted by the combination . In the limit of predominantly forward scattering grains, the role of UV dust heating in deep disk layers renders less significant than in the case of the isotropic scattering used in our study. That is, our current approach tends to slightly overestimate the role of scattering and thus overall dust heating in disk upper layers.
Equations (1)–(2) are closed with the energy balance equation
| (3) |
Here [ erg cm-3s accounts for non-radiative heating/cooling mechanisms (gas-grain interaction, see Equation (A14)).
Equations (1)–(3) represent the complete system for and . We solve this system with the analogue of the Feautrier method (Mihalas, 1978). Specifically, we introduce a wavelength and coordinate grid where is defined, and linearize the Planck function, , with respect to . Equation (1) is approximated by a set of finite difference equations for each -grid point, while Equation (3) is represented by a finite sum. As a result, we get a system of linear equations for that can be written using a hypermatrix formalism. This hypermatrix system is solved with the tridiagonal Thomas algorithm (Press et al., 1992). After the new values of and are obtained we refine linearization for the Planck function, update the system, and repeat iterations until convergence is achieved.
The stellar and diffuse interstellar radiation fields can be treated as boundary conditions to the above system of equations. We use an approach developed by Dullemond et al. (2002) and consider stellar and interstellar fields as non-radiative additional source terms in Equation (3). This approach takes into account the shielding of the star by the inner parts of the disk. For that one needs to know the fraction of stellar radiation intercepted by the disk at each radius. We compute the corresponding grazing angle as an angle between dust density isoline at and the direction toward the star. For the stellar spectrum, we use a 4000 K blackbody for Å . For shorter wavelengths, we use the interstellar radiation field (Draine, 1978; Draine & Bertoldi, 1996) with an extension to longer wavelength (van Dishoeck & Black, 1982), where we have scaled the intensity so that it is continuous at the transition wavelength of 4000 Å . Such a normalization leads to typical values of stellar UV intensity at disk atmosphere being equal to “Draine units“ (Röllig et al., 2007) at a radius of 100 AU.
2.1.2 Dust opacities and size distributions
As a result of dust evolution modeling we get dust size distribution functions being the fraction of grains with sizes within interval. To compute dust opacities one should know efficiency factors for dust absorption and scattering :
| (4) |
| (5) |
and are computed from the Mie theory for astrosilicate grains (Laor & Draine, 1993), but any other opacity model can be easily adapted.
2.2. Gas thermal balance
The kinetic gas temperature is obtained by solving the thermal balance equation:
| (6) |
where and are gas heating and cooling rates in . They depend on absolute abundances of main heating/cooling species and their level populations , which in turn depend on the gas temperature. Therefore, the problem is solved iteratively at each grid point, starting from the disk atmosphere boundary toward the midplane for any given radius, by means of the Brent method (Press et al., 1992).
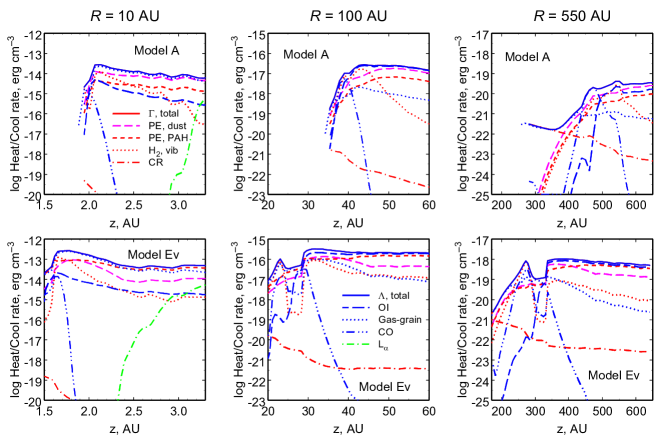
Stellar FUV radiation is the main gas heating source in protoplanetary disks, leading to a PDR-like structure of the upper disk regions. There, gas is mainly heated via the photoelectric (PE) effect on dust grains and PAHs. In addition, collisional de-excitation of H2 pumped by FUV photons, photodissociation of H2, and carbon photoionization are important heating sources in specific disk regions. Gas heating by exothermic chemical reactions plays only a minor role, with the largest contribution coming from H2 recombination on grains. In the optically thick, dense disk interiors, the dominant heating sources are the cosmic ray ionization of H and H2, and viscous heating due to dissipation of accretion energy. Gas mainly cools via non-LTE atomic and molecular line emission, collisions with grains, and, at high temperatures, by emitting Ly and metastable line emission. The details of heating and cooling processes can be found in Appendix A.
2.3. Chemistry
An important ingredient of the thermal balance calculations is chemistry. While often a fast, simplified equilibrium approach is adopted, time-dependent chemical modeling may be more appropriate for calculations of abundances of major molecular coolants. We adopted the same gas-grain chemical model as in Vasyunin et al. (2011). The reactions and reaction rates are based on the RATE’06 chemical ratefile (Woodall et al., 2007). For all photochemical reaction rates, we use the local mean intensity (as a function of ) computed with the RT model. To compute photoreaction rates, the dissociation and ionization cross-sections from van Dishoeck et al. (2006) and the AMOP database111http://amop.space.swri.edu/ are utilized. If cross-sections are not available for a certain reaction, we retain the standard formalism, with a value taken from RATE’06 ratefile, estimated at the upper disk boundary, and computed as . The same values are used to estimate photodesorption rates. Thus, the calculation of photoprocesses takes into account the detailed shape of the incident UV spectrum of the central star and its penetration through the disk. Self-shielding for H2 dissociation is computed using the Draine & Bertoldi (1996) formalism, with the modified values used to account for dust attenuation. The self- and mutual shielding for CO photodissociation are computed using recent tabular data of Visser et al. (2009).
The unattenuated cosmic ray (CR) ionization rate is assumed to be s-1. The surface reactions are taken from Garrod & Herbst (2006) and assumed to proceed without hydrogen tunneling via potential wells of the surface sites and reaction barriers. Thus only thermal hopping is a source of surface species mobility. A diffusion-to-desorption energy ratio of 0.77 is adopted for all species (Ruffle & Herbst, 2000). Under these conditions, stochastic effects in grain surface chemistry are negligible, and classical rate equations may be safely used (Vasyunin et al., 2009; Garrod et al., 2009). As the initial abundances, we utilize a set of “low metals” neutral abundances from Lee et al. (1998), where most of refractory elements are assumed to be locked in dust grains.
As the density and temperature distributions, computed here, are similar to those used in Vasyunin et al. (2011), we decided to use the same vertical distributions of X-ray ionization rates regarding them as reference values. In the chemical module they are simply added up to CR ionization rates. For the purpose of chemical evolution, we assume that dust is represented by grains with a single size which is computed from the local grain size distribution as described in Vasyunin et al. (2011). With this chemical model, a disk chemical structure is computed using dust properties and physical conditions from the previous iteration. We assume that the grain properties do not change over the computational time span of 2 Myr.
2.4. Vertical gas distribution
Given that the gas temperature and the mean molecular weight are known, the vertical gas density distribution can be found by integrating the hydrostatic equilibrium equation:
| (7) |
coupled to the equation of state of the ideal gas:
| (8) |
In this study we assume that the radial profile of the surface density is given by the known function .
2.5. Dust evolution
The evolution of the dust size distribution is calculated using the model presented in Birnstiel et al. (2010). In this work, we consider neither the viscous evolution of the gas disk nor the radial evolution of the dust surface density.
The grain evolution begins with grains sticking at low collision velocities. Disruptive collisions at higher impact velocities cause erosion or fragmentation, which poses an obstacle towards further grain growth and replenishes the population of small grains. Typical threshold collision velocities for the onset of fragmentation are found to be about 1 m s-1 for silicate dust grains (Blum & Wurm, 2008). Icy particles are expected to fragment at higher velocities due to the increased surface binding energies (Wada et al., 2008; Gundlach et al., 2011). We therefore use a threshold velocity for fragmenting collisions of 10 and 30 m s-1 in our dust models. Grain collisions are driven by relative velocities due to Brownian motion, turbulent motion (Ormel & Cuzzi, 2007), radial and azimuthal drift as well as vertical turbulent settling.
In order to make the calculation of the dust evolution feasible, we consider a radially constant, vertically integrated dust-to-gas ratio and an azimuthally symmetric disk. The vertical settling of dust is taken into account by using a vertically integrated kernel (see Brauer et al., 2008; Birnstiel et al., 2010). The integration implicitly assumes that the vertical distribution of each dust species follows a Gaussian distribution with a size-dependent scale height. This is a good approximation for the regions close to the disk midplane where coagulation is most effective. However, for modeling of the chemical evolution the detailed vertical distribution of each dust species needs to be known. We therefore use a vertical mixing/settling equilibrium distribution (Dullemond & Dominik, 2004), taking a vertical structure of the previously calculated dust surface densities.
3. Results
3.1. Disk physical structure for evolved and pristine dust cases
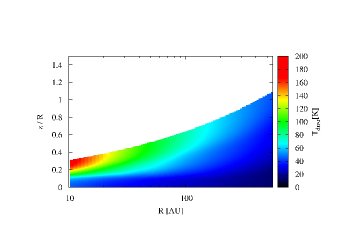
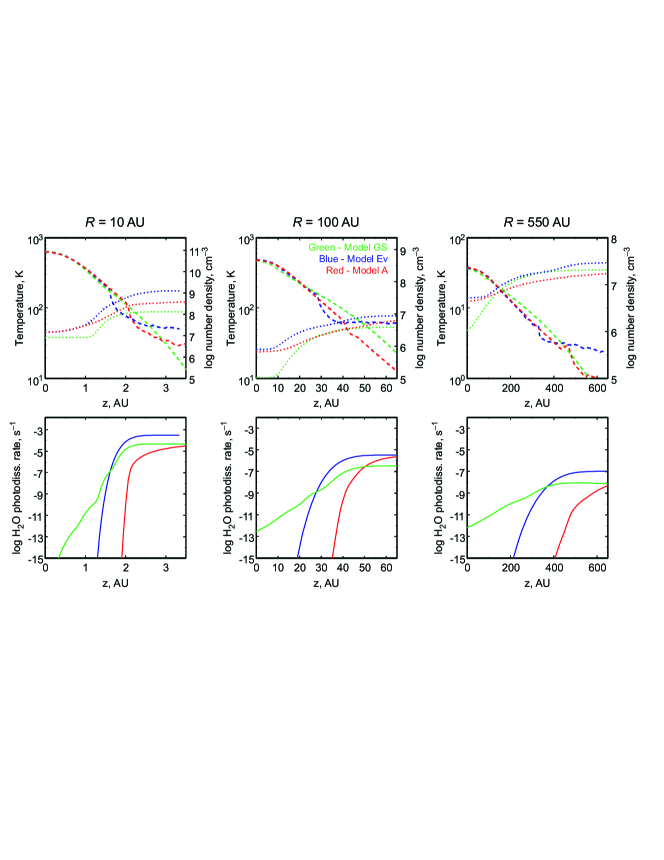
As an initial approximation, we adopt a disk from Vasyunin et al. (2011) with mass and gas surface density profile close to a power-law with index and g/cm2. The dust surface density is equal to of the gas surface density. We assume the following parameters for a central star: a mass , a radius and an effective temperature K. This system closely resembles the DM Tau disk. As UV-excess we use the standard interstellar diffuse radiation field (Draine, 1978) and its extension to longer wavelengths (van Dishoeck & Black, 1982) as described in Section 2.1.1 (“JD” case from Akimkin et al. (2011)). To show the influence of dust evolution on the disk thermal and density structure we present results for two cases: the pristine dust with uniform distribution and grain size of (Model A) and the dust distribution and sizes as obtained with the dust evolution model after 2 Myr of evolution (Model Ev). The maximum grain size, attained in the midplane in Model Ev, varies from cm at 550 AU to 0.02 cm at 10 AU. The minimum grain size is always cm.
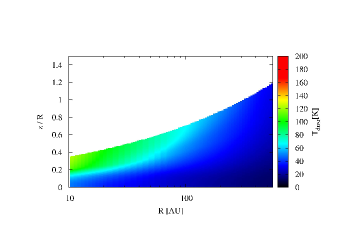
In Figure 2 the dust temperature distribution is shown for the both cases. The disk model with evolved dust is hotter by about 70 K in the inner disk atmosphere ( AU) and by K in the outer atmosphere ( AU) compared to the disk model with the pristine dust, whereas the dust midplane temperatures are quite similar in the both cases. Higher dust temperatures at the disk surface in the evolved dust model are explained by a steeper slope of dust opacities in the mid-IR, where such dust predominantly emits. Since both disk models have similar dust midplane temperatures and due to transparency of the bulk disk matter to the far-IR/millimeter emission, the emergent disk spectral energy distributions (SED) are similar. The difference in emergent spectra between Model A and Model Ev becomes apparent mostly at mid-IR wavelengths, where dust continuum emission from the inner disk parts peaks.
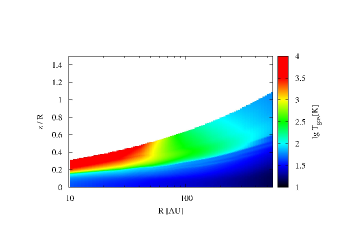

Gas temperature distributions in the disk models with the evolved and the pristine dust are shown in Figure 3 and can be compared with the dust temperatures in Figure 2. The extent of the gas-dust thermal coupling zone (where ) in Model Ev is slightly smaller than in Model A, primarily due to sedimentation. As the midplane dust temperatures for the two models do not significantly differ, the gas temperatures also inherit this behavior. On the other hand, the gas temperature distributions above the coupling zone are quite different. In the both cases, the inner disk atmosphere is heated up to several thousand Kelvin by photoelectric heating, but it is K cooler in Model Ev. This is due to the reduced abundance of grains in the Model Ev, where the main contribution to the photoelectric heating comes from PAHs.
In contrast, in Model A grains dominate photoelectric heating. Their intense heating in the upper atmosphere has to be balanced by cooling, while in Model Ev remaining grains in the inner disk and the [O I] line cooling at larger distances ( AU) can balance the photoelectric heating from PAHs. Radial extent of hot tenuous atmosphere is drastically different for the two disk models: it exceeds 100 AU in Model A, whereas in Model Ev gas is cooler than 1 000 K even at AU. Absence of grains in the disk atmosphere in Model Ev leads to an increase of the gas temperatures by about factor of 2 at between and 0.6 at AU. Somewhat smaller increase of the gas temperatures in the upper layers is also present in more distant regions of the disk. Rates of main heating and cooling processes are shown in Figure 4.
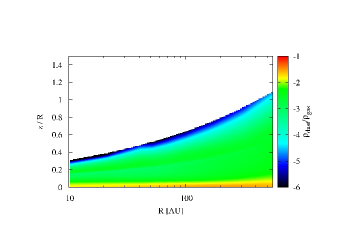
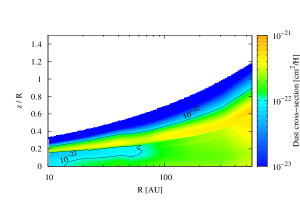
Dust density distributions for Models Ev and A are compared in Figure 5. The dust densities differ by several orders of magnitude, mainly due to sedimentation. This process also leads to dramatic changes in the dust-to-gas ratio. While in Model A this value is constant and equal to , in Model Ev we encounter the whole range of values, from to (see Figure 6). However, dust-to-gas ratios below lead to unstable solutions and poor convergence of the code, therefore in the calculations we assume that the minimal value of dust-to-gas ratio is . In Figure 7 the dust cross-section per hydrogen atom is presented for Model Ev. In case of Model A this value is equal to cm2/H everywhere in the disk.
3.2. Chemical structure
One of the main goals of our study is to probe potential changes in the disk chemical structure that may arise due to various processes related to the dust evolution. In the section we present a detailed comparison of molecular abundances in the disk models with pristine and evolved dust for radii of 10 AU, 100 AU, and 550 AU. These are the same radii that have been analyzed by Vasyunin et al. (2011). We consider only those species that have mean abundances exceeding at least in one of the two considered models. The mean abundance is computed as a ratio of the species column density to the column density of hydrogen nuclei. Remember that in all three cases we ignore and do not show the vertical structure at the height where the mass density of dust grains drops below the adopted limit of g cm-3 in the evolved model, and the medium can be considered as purely gaseous. In the case of the well-mixed dust disk model, this value corresponds to the hydrogen number density of cm-3, and is even lower for the dust evolving disk model.
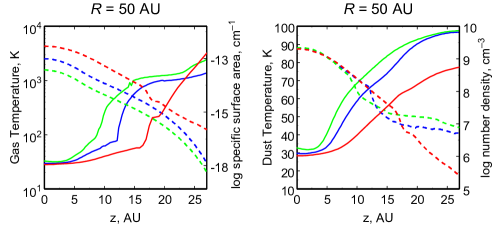
The key disk properties at the selected radii are shown in Figure 8. Up to a certain height the gas density is almost the same in both models. Above this height the vertical density profile flattens in Model Ev, because gas temperature either stops increasing or decreases with , and density stays nearly constant to keep the disk hydrostatically stable.
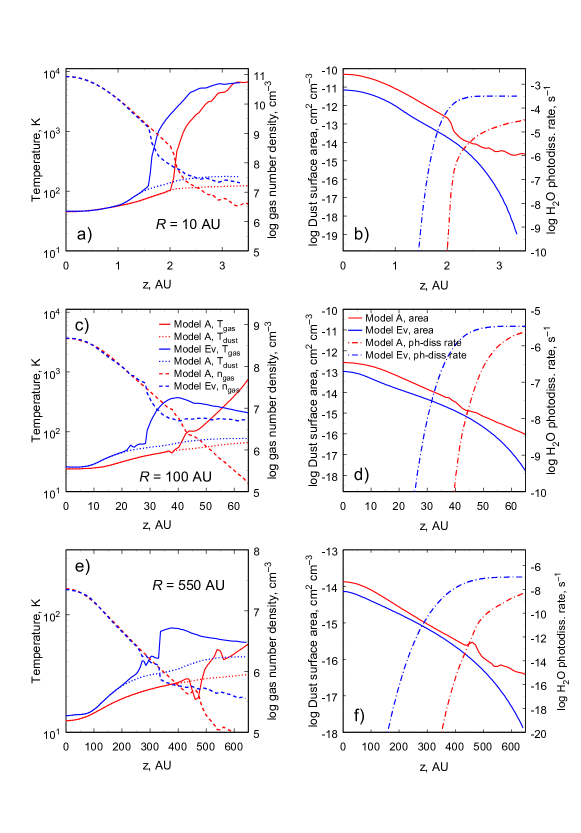
The main reason for that is the disk transparency. The dash-dotted lines in Figure 8 (b, d, f) show the water photodissociation rates that are used here as a descriptive characteristics of the radiation field strength. Obviously, in Model Ev the UV radiation penetrates deeper into the disk. Dust is warmer in this model than in Model A almost everywhere in the disk. In Model Ev gas is also significantly hotter that in the model with pristine dust in the more illuminated region that extends approximately from 1.5 AU to 3 AU at AU, from 30 AU to 50 AU at AU, and from 100 AU to 600 AU at AU.
We characterize the dust evolution using the total dust surface area per unit volume that is shown in Figure 8 (b, d, f) (solid lines). It is smaller in the evolved model as both grain growth and sedimentation reduce the total surface of dust grains. While in the midplane this reduction is mostly caused by the growth of dust grains and is quite moderate, from an order of magnitude at 10 AU to less than a factor of 2 at 550 AU, in the upper disk, where sedimentation is important, the total dust surface area in Model A is greater by orders of magnitude than in Model Ev. However, this difference may not necessarily be important for chemistry as it is mostly confined to the illuminated disk regions where dust mantles are evaporated anyway by the UV photons.
3.2.1 Outer disk
We start the description of the disk chemical structure from the outer disk, where only minor changes in the disk physical parameters are caused by the grain evolution. Because of ineffective grain growth the total grain surface area per unit volume is nearly the same in both models, except for the outermost disk atmosphere (Figure 8, f). Second, the dust temperature is quite low in the disk midplane, so surface reactions with heavy reactants should be mostly suppressed there.
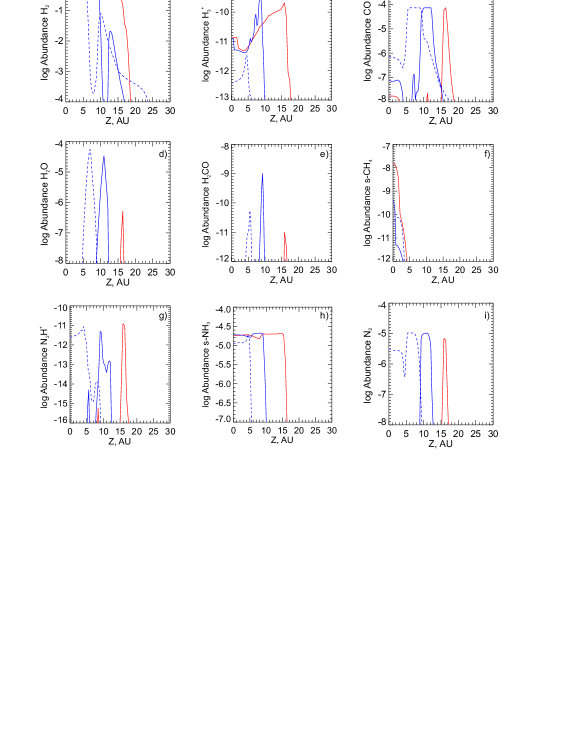
After 2 Myr of evolution we end up with 91 gas-phase species and 81 surface species that have mean abundances greater than either in Model A or in Model Ev. In most cases grain evolution increases column densities for gas-phase components. Among the 91 gas-phase species only 13 have column densities that are smaller in Model Ev than in Model A. The reason is quite straightforward. As grains grow and settle down toward the midplane, the so-called warm molecular layer moves down as well, to a denser disk region. Even if relative abundances do not change significantly in the process, column densities grow due to higher volume densities. Vertical abundance distributions for some species are shown in Figure 9.
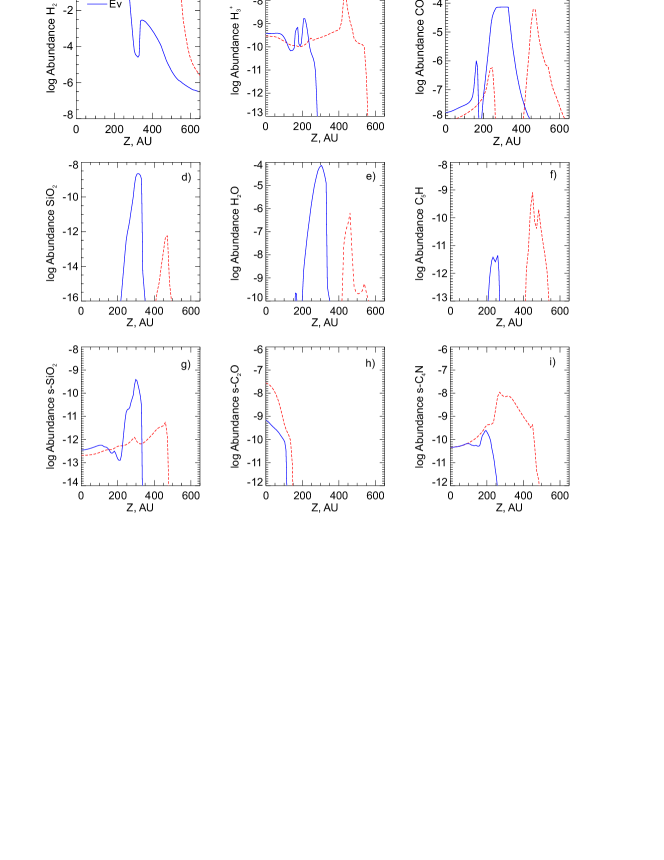
In the upper row of Figure 9 we present vertical abundance profiles for H2, H, and CO. The key difference between Model A and Model Ev is that in the former the warm molecular layer is located below the H2 dissociation boundary, while in the latter a portion of the molecular layer is located above this boundary, where free H atoms are abundant. This mutual disposition is not impossible as the molecular layer and the H2 photodissociation front are not directly related to each other. Grain absorption of the FUV photons responsible for the H2 dissociation is less significant in the model with evolved dust, and the H2 dissociation front is located deeper in Model Ev. However, the overall transparency of evolved dust in the entire UV range is smaller than for FUV photons only. Because of that the molecular layer that is controlled by desorption from dust grains and dissociation of trace molecules is located somewhat higher. This specific result, of course, depends on the adopted description of dust opacities and photoreaction rates.
Simple atomic and diatomic components dominate the list of the gas-phase species, whose column densities are enhanced in Model Ev. The largest column density increase at 550 AU is found for SiO2 (Figure 9, d), N2O, and water (Figure 9, e). In all cases it is related to higher abundance of a molecule in the molecular layer. Note that almost all physical characteristics of the medium are nearly the same in the molecular layers of the two disk models, except for the gas density and the X-ray ionization rate. Higher density in the molecular layer of Model Ev accelerates two-body processes and shifts equilibrium abundances of many molecules to higher values.
The relative location of the molecular layer and the H-H2 boundary, mentioned above, also plays a role in defining molecular column densities, especially, for species that are produced in reactions with atomic hydrogen, like water. In Model Ev a significant portion of the molecular layer is located above this transition, where abundant H atoms are available. This speeds up the gas-phase water synthesis in H + OH reaction as well as surface synthesis of water molecules that are immediately released into the gas-phase due to photodesorption. This explains a huge water spike located at height of about 300 AU. In Model A water is mostly produced in surface reactions that are less effective because of low H gas-phase abundance and lower rate of the UV photodesorption. Also, water molecules are more rapidly destroyed in reactions with ions such as HCO+ that are abundant in the molecular layer due to higher X-ray ionization rate. The sharp drop-off in water abundance in both models coincides with the carbon ionization front. Above the front, the main destruction routes for water molecules are the reaction with C+ and photodissociation.
The situation is somewhat different for complex hydrocarbons, in particular, for long carbon chains. Their abundances in Model A are significantly enhanced in the molecular layer in comparison with Model Ev. This is again related to a more elevated position of the molecular layer in Model A. Because of that, it is less protected not only from the UV irradiation but from X-rays as well. Accordingly, ionized helium is more abundant in the molecular layer of Model A than in the molecular layer of Model Ev. Abundant C-bearing molecules, like CO, are destroyed by He+ more efficiently in Model A in the disk upper region. Then, C+ is consumed to produce simple CH species that stick to grains and produce long carbon chains by surface processes. The dust temperature of the order of 30 K is high enough to drive desorption of these molecules into the gas-phase.
This effect should not be overestimated. Even though the total column densities of carbon chains are greater in Model A than in Model Ev, their absolute values are low, with the mean abundance exceeding only for C2H, C4, C4H, C5, C5H, and C6H. The effect is most pronounced for C5H (Figure 9, f), with the ratio of column densities in Model A and Model Ev of 15. For the observed C2H molecule the higher relative abundance in Model A (related to more effective He+ chemistry) is nearly compensated by the higher absolute abundance in Model Ev (related to deeper location of the molecular layer), so its column densities are nearly the same in both models.
The behavior of surface species is different in the two disk models. While column densities of gas-phase species are increased by grain evolution, column densities of many surface species decrease. There are 81 abundant surface species at 550 AU, and only 30 of them have greater column densities in Model Ev. Also the difference of column densities of surface species is quite modest in the two models. Only for ten of 81 species column densities differ by more than a factor of 3. Dominant surface carbon compounds (in terms of column densities) in both models are carbon monoxide and methane. Because of low dust temperature, s-CO2 production is suppressed, and this molecule in neither model reaches the high abundance seen at smaller radii (see below).
Surface species that have greater column densities in Model Ev are mostly silicon and phosphorus compounds, which are not involved in surface chemistry (relevant reactions are not included in our chemical network). Their abundances are enhanced in the ‘main’ molecular layer as are abundances of their gas-phase counterparts (Figure 9, g).
Abundances of some surface carbon chains are enhanced in Model A by about an order of magnitude due to more intense X-ray ionization than in Model Ev (see above). Also, species like s-C2O (Figure 9, h) and s-C2N involved in surface chemistry have greater column densities in Model A because their midplane abundances are higher in this model due to greater available surface area for their synthesis. Carbon chains not involved in surface chemistry in our chemical model, like s-C4N (Figure 9, i), mirror evolution of their gas-phase counterparts and have higher abundances in the upper carbon chain layer described above.
3.2.2 Intermediate disk
As we move closer to the star, at distances of about 50–100 AU, the fingerprint of dust evolution becomes more pronounced. While the mass density of dust is greater in the midplane of Model Ev due to sedimentation, the total surface area is still 2.5 times less than in Model A. In the upper disk the difference in the surface area reaches a factor of 70. It is interesting to note that the uppermost disk atmosphere is actually colder in Model Ev than in Model A, despite being more transparent (Figure 8, c). This is because dust is not only the main source of opacity but also an important heating agent (due to photo-effect). As dust is depleted in the upper disk, the equilibrium temperature shifts to lower values, dictated by the PAH heating.
At AU, among 78 gas-phase species, having mean abundances higher than at least in one of the two models, most species (72) have higher column densities in Model Ev, as at AU, but the list of these species is somewhat different. Some examples of vertical abundance profiles for gas-phase species at AU are shown in the top and middle row of Figure 10.
The main features of the chemical structure are the same as at 550 AU. In Model Ev the molecular layer, as marked by the CO distribution (Figure 10, c), is located above the H2 photodissociation front (Figure 10, a). In Model A the situation is the opposite. Also, in Model A ions, like H (Figure 10, b) are somewhat more abundant in the molecular layer which further decreases abundances of neutral unsaturated molecules.
The largest difference between the two models is again observed for SiO2 that has a column density cm-2 in Model A and cm-2 in Model Ev. Grain evolution causes water column density to increase from cm-2 to cm-2. This is again related to the different arrangement of the molecular layer and H–H2 transition in Model A and Model Ev (Figure 10, a). The upper boundary of the water layer is defined by the location of the C ionization front.
Many complex gas-phase hydrocarbons, like formaldehyde (Figure 10, d) and cyanoacetylene (Figure 10, e), are also affected. Among more or less abundant molecules the only exception to this rule is methane (Figure 10, f), with column density being about 3 times larger in Model A than in Model Ev. This difference is related to the surface chemistry as we will explain below.
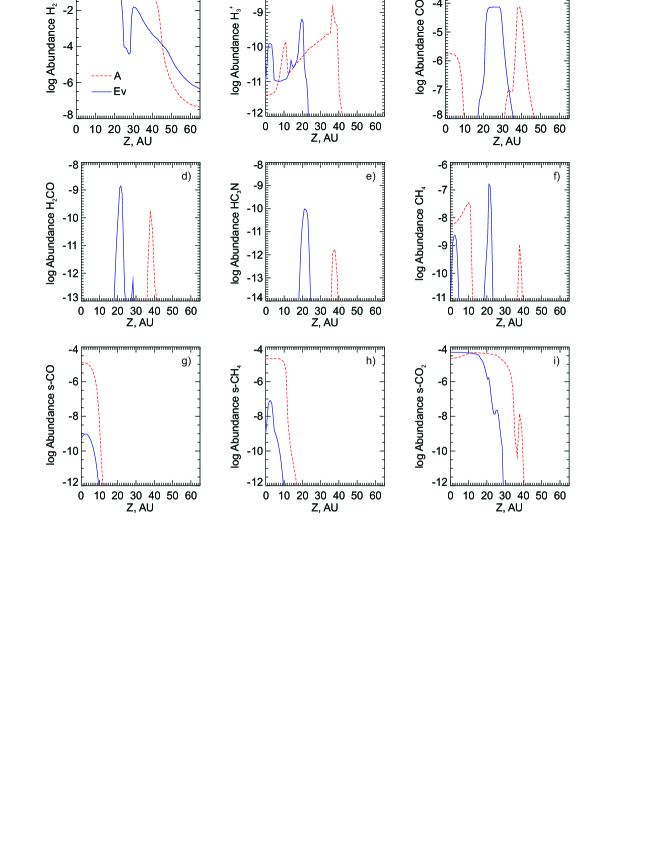
The chemical evolution of surface species is complicated as it is affected by at least two competing factors related to grain growth. Less grain surface is available to the mantle formation in Model Ev, but because of higher grain temperature surface species are more mobile than in Model A, which intensifies the surface recombination. The interplay between these processes causes various responses of surface species to the grain evolution.
Thirty five of 72 abundant mantle components have higher column densities in Model Ev. Only for 24 species the ratio of column densities in the two models exceeds a factor of 3. Higher abundances in Model Ev are mostly typical for complex surface molecules with large desorption energies that have accreted from the gas phase and are not involved in surface chemistry. These species mirror the behavior of their gas-phase counterparts. Two striking examples of greater column densities in Model A are presented by s-CO and s-CH4 (Figure 10, g and h). Surface methane is underabundant by about 3 orders of magnitude in Model Ev, while surface CO is underabundant by more than 4 orders of magnitude in this model. As surface species are mostly concentrated in the midplane, to explain this difference we need to consider chemistry in this disk region.
Surface methane chemistry is quite limited in the adopted network. Methane is synthesized in a sequence of hydrogen addition reactions, while the only effective route of its removal from the mantle is desorption. So, its abundance is regulated by the balance between hydrogen addition and desorption. As the desorption energy of methane is not very large (1300 K), desorption wins in this competition, and the steady-state s-CH4 abundance in Model Ev shifts toward lower values. This does not work for other saturated molecules (like water and ammonia), as they have much higher desorption energies, so their midplane abundances in both models are just (nearly) equal to the abundances of the corresponding atoms.
Carbon monoxide is different from methane in the sense that it is not a ‘dead end’ of some surface chemistry route, but rather an intermediary on the route to s-CO2 formation and synthesis of complex organic molecules like CH3OH. The reaction between s-OH and s-CO, leading to s-CO2, has a 80 K barrier. This implies very strong dependence on the dust temperature at critical K. Because of this dependence, s-CO2 formation is much more efficient in Model Ev. While s-CO2 is the most abundant carbon compound in the disk midplane in both models, in Model A its abundance is about two times lower than in Model Ev (Figure 10, i). Thus, in Model A, carbon atoms that are not bound in s-CO2 are available for other surface processes and are almost equally distributed between surface methane, surface CO, and some other species, with s-CH4 having almost the same abundance as s-CO2. In Model Ev, s-CO2 synthesis proceeds faster, and this component becomes not only the dominant C carrier, but also the dominant oxygen carrier, leaving almost no place for either surface or gas-phase CO.
The described trends are mostly preserved at AU. At this radius, dust evolution also causes column densities of abundant gas-phase species to increase (mostly due to enhanced photodesorption). Water, carbon dioxide, formaldehyde, and cyanoacetylene are among species mostly affected. Gas-phase methane column density is nearly the same in both models. Surface methane and CO ice are underabundant in Model Ev at AU, but to a less degree than at AU. Dust temperatures in Model A and in Model Ev are nearly equal at this radius, so that in both cases surface s-CO2 synthesis is very effective, decreasing s-CO and s-CH4 abundances and leveling differences between the two models. Abundances at 50 AU will be further discussed in the last subsection of Section 3.
3.2.3 Inner disk
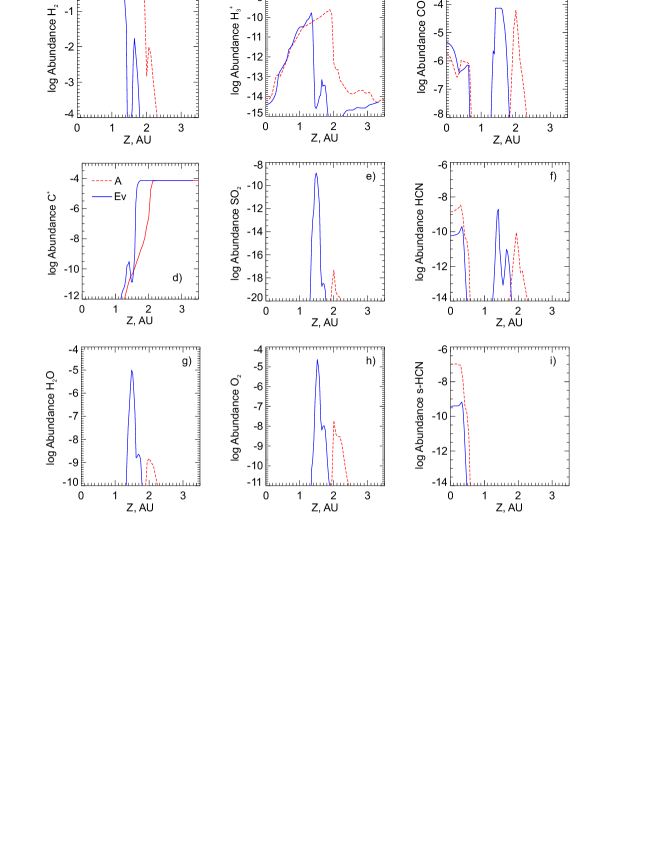
At AU we have 75 abundant gas-phase molecules, and 62 of them share the common trend to be more abundant in the model with evolved dust. However, the magnitude of the difference in column densities as well as its origin are related to other factors. The molecular layers both in Model A and in Model Ev are located above the H-H2 transition (Figure 11, a). In both cases abundant H atoms are available both for surface and gas-phase reactions. Despite the fact, water column density in Model Ev exceeds that in Model A by more than 4 orders of magnitude (Figure 11, g). This difference is much greater than at other radii where we related it to the difference in atomic hydrogen abundance. At these warm temperatures of K (see Figure 8, a), the formation of water is dominated by neutral-neutral reaction of O with H2 (with the barrier of K), followed by the neutral-neutral reaction of OH with H2 (with the barrier of K), see Woodall et al. (2007) and Najita et al. (2011).
As H abundances in the molecular layers are nearly the same in both models, we need to find another explanation for the raise in water abundance in Model Ev. It is obviously related to the difference in physical parameters in the two molecular layers. Again, the molecular layer in Model Ev is shifted toward the midplane and, thus, resides in a denser disk region. Because of higher density in the molecular layer of Model Ev, surface water synthesis is more effective there, increasing its gas-phase abundance as well. Higher X-ray ionization rate in the molecular layer of Model A leads to higher ion abundances. In particular, it greatly enhances abundance of H+ that is one of the major water destroyers. Another difference is the UV radiation spectrum that favors carbon ionization in Model A. In the adopted photoionization model, carbon atoms are ionized by the UV radiation with wavelengths shorter than 1100 Å. This radiation is absorbed less efficiently in Model A, and because of that the C/C+ transition zone is further vertically expanded, so that the water layer falls in the region where C+ abundance is still significant (Figure 11, d). This also leads to rapid water destruction.
Different water abundances cause even greater differences in column densities of SO and SO2. In the case of SO2 the difference exceeds 9 orders of magnitude (Figure 11, e). Significant growth of SO and SO2 abundances can be traced to the greater abundance of O2 in Model Ev. An SO2 molecule is produced from SO, SO is produced in reaction S + OH, atomic sulfur is the product of SO+ dissociative recombination, and SO+ is produced in the reaction between S+ and O2. Abundance of molecular oxygen in Model Ev is greater by almost 4 orders of magnitude than in Model A (Figure 11, h), which is also related to different H+ abundances, as the H+ + O2 reaction is one of the major O2 destruction pathways. Thus, we conclude that at AU chemical differences between Model Ev and Model A arise because grain evolution shifts the molecular layer in the region of the disk that is more protected from X-rays and FUV radiation.
Among species, that have their column densities decreased by grain growth, are HCN (Figure 11, f) and HNC. They are mostly concentrated in the midplane, and their midplane abundances in Model A exceed those in Model Ev by an order of magnitude. Analysis of chemical processes indicates that this difference is related to surface processes, that is, higher gas-phase HCN abundance in Model A simply reflects more effective surface synthesis of the molecule because the available surface area is greater in this model (Figure 11, i). Then, HCN desorbs into the gas-phase and gets protonated by reactions with HCO+ or H. Dissociative recombination of HCNH+ produces either HCN or HNC, so the overabundance of HCN in Model A is partially transferred into the overabundance of HNC.
As for surface species, at this radius there are 64 abundant surface components, mainly heavy molecules. Nearly half of them are more abundant in Model Ev, but the increase in column densities is not significant for most molecules. Two extreme examples of greater column densities in Model A are represented by s-HCN and s-HNC, for the reasons described above.
3.3. Model with more efficient dust growth
To check the sensitivity of our results to some details of the adopted grain physics, we considered additional models for dust evolution. In this subsection we present a detailed description of Model Evx with a threshold velocity for fragmenting collisions increased from 10 to 30 m s-1, which leads to more significant grain growth in the dense regions.
Models A, Ev, and Evx can be viewed as successive stages of the grain evolution process. So, in Model Evx we may expect to see a continuation of the same trends as were noted above for Model Ev. In Figure 12 we show the main disk structural properties at AU in the three models. Obviously, more advanced grain evolution causes the disk to become more transparent. As a result, hot atmosphere becomes more extended, and dust becomes warmer, with the midplane grain temperature raising from 28 K in Model A to 33 K in Model Evx. As we will see below, this relatively small difference has a noticeable effect on the disk chemical structure. Dust surface, available for chemical reactions, is an order of magnitude smaller in Model Evx than in Model A.
Vertical profiles of some species for Models A, Ev, and Evx are shown in Figure 13. As in previous cases, we start from H2 (Figure 13, a) and notice that the H2 photodissociation front sinks even deeper, so that hydrogen is almost fully atomic above AU. Due to warmer dust, gas-phase abundances of some molecules with low desorption energy are increased in the midplane of Model Evx (like in Model Ev at AU). One can see the progressive growth of CO midplane abundance from Model A to Model Evx in Figure 13 (c). Similar to CO, gaseous N2 appears in the disk midplane in Model Evx. Protonation of such abundant molecules lowers the H abundance in the Evx model midplane (Figure 13, b), which affects abundances of some other ions, like H3O+.
A typical example of the molecular abundance evolution is shown in Figure 13 (d). A peak of water abundance shifts toward the midplane and grows higher. Due to increasing overall gas density and more intense photodesorption, gas-phase water column density increases up to cm-2 in Model Evx. The upper boundary of water layer is defined by the C+ ionization front (Figure 13, e).
A significant growth is observed for N2H+ column density. It increases from cm-2 to cm-2 in Model Ev and cm-2 in Model Evx (vertical abundance profile is shown in Figure 13 (g)). This is related to increased thermal desorption of the N2 ice and lower abundances of surface species that are mostly synthesized on grains, like methane (Figure 13, f) or ammonia (Figure 13, h). In the latter case, some nitrogen atoms in the midplane are free to be incorporated into N2 molecules (Figure 13, i) and further into N2H+ molecules. Species, significantly affected by the advanced grain growth, also include other gas-phase molecules, related to surface chemistry. Column densities are increased by more than an order of magnitude in Model Evx relative to Model Ev for H2O2, CH4, CO2, and some others.
We have also considered the effects of dust radial mixing. The radial mixing is modeled as diffusion, using the Schmidt number from Youdin & Lithwick (2007), i.e. . The dust diffusivity is taken to be the dust viscosity () which is the Shakura & Sunyaev (1973) viscosity for the given alpha value. We found that radial mixing does not change the disk physical and chemical structure significantly and leads to the gas/dust temperature increase by several K at intermediate radii.
4. Discussion
4.1. Comparison to Vasyunin et al. (2011)
While many aspects of the presented model are derived from the model used by Vasyunin et al. (2011), the new treatment of the disk structure results in parameters that are too different to allow a direct comparison of the ‘old’ and ‘new’ results. While density profiles are nearly the same in both studies, there are two key differences in the disk dust temperature and in the disk radiation field (Figure 14). First, the improved radiation transfer model makes dust in the ‘new’ disk midplane significantly warmer than dust in the ‘old’ disk midplane, at least, in the remote parts of the disk ( AU). Second, because of scattering the ‘new’ disk is less transparent to dissociating far-UV radiation than the ‘old’ one. These two differences are related to the radiation transfer treatment, so we may expect that basic inferences of Vasyunin et al. (2011) on the disk chemical structure should be retained in the new results, if they are mostly related to the dust evolution.
This is indeed the case, with a few exceptions. First, the general conclusion of Vasyunin et al. (2011) that dust evolution increases gas-phase column densities of most species is entirely confirmed in the present study. Second, almost all species, designated as sensitive to grain evolution in Vasyunin et al. (2011), like CO, CO2, H2O, C2H, retain this status in the present study222A species is marked as sensitive if its abundances in models with pristine and evolved dust differ by more than an order of magnitude at least at one of the considered radii..
In Table 1 we show column densities for species listed in Table 2 from Vasyunin et al. (2011), along with the newly calculated column densities. Few remarks are needed. Some species, like methanol, cyanopolyynes or formic acid, are significantly less abundant in the new model. This is due to generally less effective surface chemistry in a warmer disk midplane, where depletion of CO and other similar volatile ices is less severe and where a desorption rate of hydrogen atoms from dust surfaces is higher. The chances for them to be observed are, thus, slim (within the framework of our modeling approach). For some species from this list the ‘sensitivity region’ (the region where the two models differ most) shifts or extends to other radii (typically, from ten to hundred AU). These are HCNH+ (derived mainly from HCN), NH3, and OH. Surface hydrogenation also plays an important role in the synthesis of these species.
Column densities of three species, H2CS, HC5N, and HCO+, while still enhanced by the dust growth, differ by less than an order of magnitude in the new calculation, so they do not conform to our sensitivity criterion. Thioformaldehyde that has been mentioned in Vasyunin et al. (2011) as a molecule most sensitive to dust growth and HCO+ are now significantly more abundant in the midplane of Model A due to higher dust temperature and less severe depletion of their parental species, CO and (H)CS. This shortens the break between the pristine and evolved dust models.
Abundance of CH3CH3 is also significantly enhanced in the midplane at AU, relative to results of Vasyunin et al. (2011), and is nearly the same both in Model A and in Model Ev. As our model has a warmer inner midplane, surface radicals out of which CH3CH3 is formed become more mobile and reactive. A molecular layer no more dominates in its column density, so the molecule loses its sensitivity to the dust growth in the inner disk. In the outer disk the situation is more complicated. There, CH3CH3 is still sensitive to dust growth, but the sign of the sensitivity is different. While in Vasyunin et al. (2011) its column density was greater in the model with pristine dust, now CH3CH3 shares the common behavior and is enhanced in the molecular layer of Model Ev due to higher density there.
Another molecule that shows the ‘reversed’ sensitivity is HCN. As we mentioned above, its abundance in the midplane is higher in Model A because of more effective surface synthesis. It also exceeds HCN column density in Model A5 from Vasyunin et al. (2011) due to somewhat higher dust temperature, that also intensifies HCN ice production (as surface production of CN is faster in the warmer ANDES model). At larger radii, HCN behavior is similar in both studies. These findings demonstrate the importance of the correct treatment of the radiation transport and also imply that the stellar and interstellar radiation fields need to be discretized as good as possible.
| Species | Column densities, cm-2 | Observed column | |||||
|---|---|---|---|---|---|---|---|
| 10 AU | 100 AU | 550 AU | densities, cm-2 | ||||
| Pristine | Evolved | Pristine | Evolved | Pristine | Evolved | DM Tau | |
| CO | 2.0(17) 6.5(17) | 1.1(18) 1.8(18) | 2.0(17) 1.1(17) | 9.4(17) 4.3(17) | 1.7(17) 1.3(16) | 2.9(17) 1.7(17) | 1.4(17) |
| CO2 | 6.8(10) 6.9(13) | 9.5(13) 7.3(14) | 2.4(12) 1.0(11) | 8.5(14) 6.1(13) | 8.2(13) 1.5(13) | 9.8(14) 7.0(14) | - |
| CH3OH | 1.1(03) 5.8(06) | 3.5(08) 2.6(08) | 1.9(08) 3.8(05) | 1.0(10) 4.6(07) | 4.6(09) 1.2(07) | 1.4(10) 2.0(08) | - |
| H2O | 2.5(13) 1.3(12) | 1.1(16) 2.3(16) | 3.6(14) 7.1(13) | 7.0(15) 5.2(16) | 1.4(14) 8.2(13) | 2.0(15) 6.4(16) | |
| H2S | 1.7(05) 2.9(06) | 1.3(10) 7.8(06) | 2.0(09) 1.2(06) | 1.1(11) 5.1(07) | 2.9(10) 6.3(09) | 3.6(10) 5.0(11) | - |
| C2H | 6.3(10) 1.8(11) | 2.0(12) 1.0(13) | 2.6(12) 3.0(11) | 2.2(12) 2.9(12) | 6.7(12) 5.7(12) | 5.0(12) 5.1(12) | 2.8(13) |
| C2H2 | 6.2(10) 3.1(12) | 4.6(12) 1.2(13) | 4.5(12) 3.9(11) | 3.0(12) 6.1(12) | 4.4(12) 3.0(12) | 1.6(12) 8.3(12) | - |
| CH3CH3 | 3.0(09) 1.1(14) | 1.5(12) 6.9(14) | 1.8(10) 1.6(08) | 3.3(08) 4.1(11) | 1.3(07) 5.1(05) | 2.5(06) 8.4(07) | - |
| H2CS | 8.0(05) 6.4(09) | 3.5(11) 1.8(10) | 2.7(11) 5.3(06) | 8.3(11) 1.5(07) | 2.7(10) 2.2(07) | 1.8(11) 2.2(07) | - |
| HCN | 2.6(12) 8.7(14) | 5.0(13) 4.5(13) | 6.9(12) 2.5(11) | 4.2(13) 1.5(13) | 9.0(12) 2.0(12) | 2.1(13) 2.5(13) | 6.5(12) |
| HC3N | 6.8(08) 6.8(07) | 1.7(12) 7.5(11) | 4.1(11) 5.4(08) | 2.8(11) 2.8(11) | 1.1(12) 8.9(10) | 4.3(10) 6.6(11) | - |
| HC5N | 4.9(08) 6.7(06) | 1.5(12) 1.9(07) | 2.1(11) 9.9(05) | 1.5(11) 1.0(06) | 1.8(11) 1.6(07) | 8.8(10) 2.4(07) | - |
| HC7N | 4.7(06) 5.8(02) | 1.2(12) 2.1(06) | 6.1(10) 1.6(04) | 5.3(10) 8.5(04) | 9.2(10) 2.2(06) | 2.8(10) 9.8(06) | - |
| HCNH+ | 2.0(10) 2.1(11) | 2.7(11) 2.1(11) | 5.7(10) 2.1(09) | 1.3(11) 4.6(10) | 6.6(10) 2.5(10) | 6.8(10) 8.6(10) | - |
| HCOOH | 1.4(11) 6.6(06) | 6.3(13) 4.5(08) | 1.1(12) 2.5(07) | 1.3(13) 3.2(08) | 2.6(11) 1.3(09) | 2.1(12) 1.3(09) | - |
| OCN | 3.2(07) 3.0(06) | 4.3(09) 5.5(07) | 2.3(10) 4.5(09) | 1.5(12) 4.2(09) | 1.3(11) 1.6(11) | 4.2(12) 4.3(11) | - |
| OCS | 1.6(07) 1.9(06) | 9.3(10) 9.6(10) | 1.6(10) 3.9(08) | 1.5(10) 9.5(10) | 2.7(08) 1.4(08) | 4.5(08) 3.9(09) | - |
| NH3 | 1.7(11) 3.7(10) | 3.2(13) 7.3(12) | 1.1(13) 9.7(11) | 3.5(13) 1.8(13) | 8.5(12) 4.5(12) | 1.2(13) 2.3(13) | - |
| HCO+ | 1.1(11) 2.7(12) | 5.2(12) 8.1(12) | 2.6(12) 4.6(12) | 2.2(12) 1.8(12) | 2.2(12) 7.9(11) | 1.9(12) 1.3(12) | 6.5(12) |
| OH | 6.1(13) 1.9(13) | 1.9(14) 2.1(14) | 2.7(13) 1.0(13) | 1.2(14) 9.8(13) | 1.9(13) 9.6(12) | 1.5(14) 2.2(14) | - |
Table 1 contains only a few representative species. To have a broader perspective, we perform a general comparison relating the column density ratios in the models with pristine and evolved dust computed in Vasyunin et al. (2011) and in the present study, for all species at 10, 100, and 550 AU. Results of comparison for AU are shown in Figure 15. Only gas-phase species with mean abundances greater than are shown. Most species are concentrated around a red line that corresponds to equal old and new ratios. This indicates that most column densities respond similarly to dust growth both in Vasyunin et al. (2011) and in the present study. Also, most species reside in the upper right quadrant, showing that in both studies dust evolution, as a rule, increases molecular column densities.
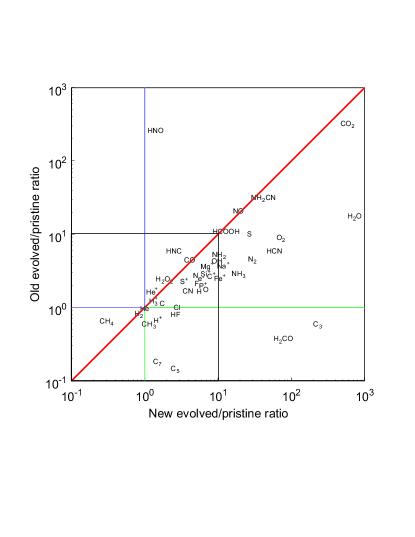
Carbon dioxide is most sensitive to dust growth and is, thus, located in the upper right corner. This is not surprising as its production mostly occurs on grain surfaces via slightly endothermic reactions of CO and OH. A quite high water sensitivity was obtained in Vasyunin et al. (2011), and now it becomes even higher. Similar to water and carbon dioxide, HNO was very sensitive to dust growth in our old computation because its main production route is surface synthesis. In the new computation this route is less effective due to warmer dust, so HNO is mostly produced in the gas phase. This makes it less susceptible to changes in dust properties. It must be kept in mind that warmer dust has dual effect on surface chemistry. On one hand, a larger temperature implies more rapid hopping and larger reaction rates. On the other hand, more volatile reactants evaporate faster from warmer grains, thus, quenching the formation of some species.
An opposite example is represented by formaldehyde. This species was barely sensitive to dust growth in the old computation, with column density being slightly smaller in the model with evolved dust. In the present study, H2CO column density is significantly greater in the model with evolved dust. This behavior is related to details of the UV penetration. In the old models, where only the UV absorption has been taken into account, the UV field intensity falls off quite slowly as we go deeper into the disk. Because of that abundance maxima in the molecular layer for molecules that are mostly susceptible to photodesorption and photodissociation are extended and shallow. Thus, their column densities are less sensitive to dust evolution. Detailed treatment of the radiation transfer in the new model predicts a sharper transition from the illuminated atmosphere to the dark interior. The molecular layer becomes significantly narrower and is, thus, much more sensitive to the extent of dust growth and sedimentation.
The overall conclusion from the presented comparison is the following. We confirm that dust evolution changes column densities of many molecules (see Table 1 and Figure 15). Most species that have been listed as especially sensitive to dust evolution in Vasyunin et al. (2011) retain this status in the present study. However, column densities of some species turn out to depend on the details of the radiation transfer treatment, and this dependence will become even stronger when we will proceed from column densities to line intensities. ANDES makes all the necessary preparatory work for that, providing us with both abundances and gas temperatures.
However, there is another aspect, apart from the radiation transfer, that may affect our conclusions. This aspect is related to possible evolutionary changes. As in ANDES we use time-dependent chemistry, we can provisionally estimate its importance.
4.2. Disk structure with time-dependent chemistry
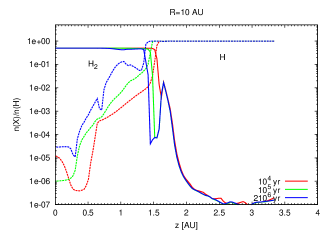
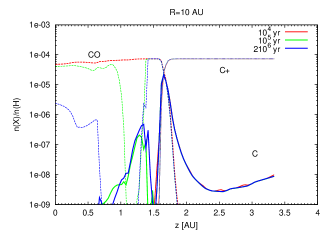
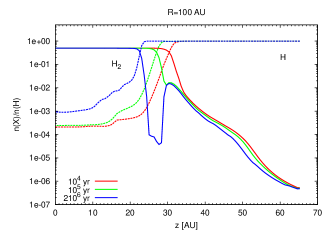
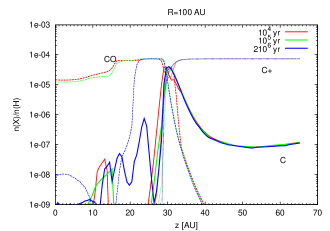
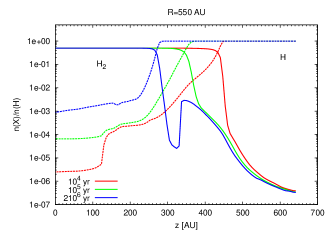
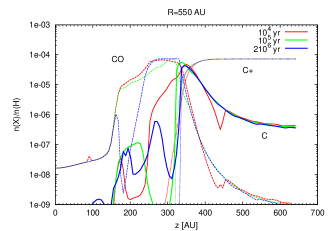
In order to demonstrate the effect of time-dependent chemistry on the disk chemical structure we perform model calculations with abundances of major molecular coolants at , , and years. We assume that the disk chemically evolves from mostly neutral atomic gas, with molecular hydrogen and a low fraction of atomic hydrogen ( to the total number of hydrogen nuclei). We do not consider the time evolution of dust grain distribution in order to focus on effects of chemical evolution, and utilize vertical dust distribution after 2 Myr. Results are presented in Figure 16, showing the relative abundances of H2, H, CO, C, and C+ as a function of height at the distinct epochs for disk radii of 10, 100 and 550 AU.
As can be clearly seen, the location of the H2/H transition shifts toward the midplane with time for all the considered radii due to slow photodissociation of molecular hydrogen, self-shielded from the strong FUV stellar radiation. H2 cannot be quickly re-formed in this region in Model Ev due to overall lack of grains, providing catalytic surface for H + H reaction. Consequently, between and years, at radii of 10, 100, and 550 AU, the PDR zone shifts from 1.6 to AU, from 31 to 22 AU, and from 425 till 290 AU, respectively. This effect is more pronounced in the outer disk, where densities and density gradient are lower.
An interesting feature of the chemical structure in Model Ev is the presence of a ‘dip’ in H2 vertical distribution at the final time moment at all radii. This region with depression in H2 concentration is caused by its slow X-ray/UV destruction, which cannot be compensated by the H2 surface production on a few remaining grains. However, just above this depression region dust-to-gas ratio locally increases, and so does the available surface for hydrogen recombination (per unit gas volume). The reason for the elevated dust-to-gas ratio is a gas redistribution from the top of the coupling region to greater heights due to extra heating.
In contrast, the evolution of ionized carbon reaches a chemical steady-state rapidly everywhere in the disk thanks to its fast ion-molecule chemistry pathways, so the C+ concentration is not time-sensitive (after years), see Figure 16. The chemical evolution of C+ is governed by a simple and limited gas-phase reaction network in the disk atmosphere, where it is an important coolant with a relative abundance of (see, e.g. Semenov et al., 2004; Semenov & Wiebe, 2011). Neutral atomic carbon shows little time evolution, if any, in the disk regions adjacent to the midplane at radii smaller than AU. Due to relatively large densities in disk equatorial regions, neutral carbon is rapidly converted to CO and hydrocarbons. This is not true for lower-density outer disk regions, at AU and , where the C abundance changes substantially with time. Since initially all elemental carbon is in the atomic form, in the outer disk, less dense and more transparent to the interstellar FUV radiation, conversion of C into CO and hydrocarbons takes more than years (see Figure 16, bottom row).
The gas-phase CO abundances follow the pattern of H2/H and C and do not reach a steady-state within 2 Myr everywhere in the disk model with evolved dust. The grain growth increases the CO freeze-out timescale to Myr in the inner and intermediate radii (Figure 16, top and middle rows). In the midplane, where gas-phase CO abundance is low, this molecule is present as CO ice. The final distribution of the CO abundance at AU shows an interesting feature: due to severe grain growth CO freeze-out is inefficient in the midplane, but still effective at disk heights of AU. At even larger heights the CO molecular layer starts, so CO emission lines are excited both in the very cold and warm regions. Since 12CO, 13CO and C18O isotopologue lines, having vastly different opacities, allow probing these two temperature zones, this should be visible with modern radio-interferometers. Intriguingly, evidence for the presence of very cold CO gas was found by Dartois et al. (2003), and, later, for other molecules like HCO+, CCH, CN, and HCN (see discussion in Semenov & Wiebe, 2011).
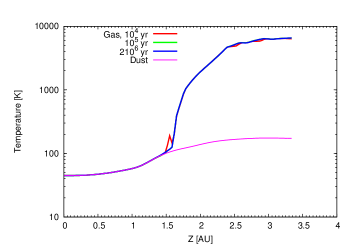
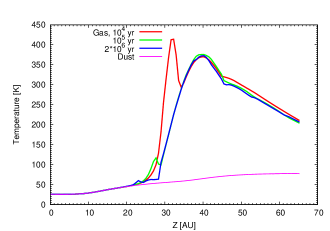
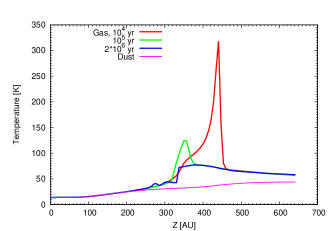
Enhanced amounts of H2 at years in disk regions with high FUV radiation intensities lead to additional heating by the UV-excited H2. Since the H2/H boundary is moving down, the gas thermal structure of the disk responds accordingly and also shows strong variations of in a narrow disk layer, in particular, at AU (see Figure 17). While the gas temperature varies from 250 K to K (25%) at AU, at the outer disk region, AU, the gas temperature difference at various times is about 250 K (from 320 K to K, or a factor of 4), compare top and bottom panels of Figure 17. Naturally, it should also have a strong impact on chemical composition and appearance of the disk molecular layer, from which most of line emission emerges. More importantly, it demonstrates the importance of using the time-dependent chemistry for calculating abundances of key gaseous coolant instead of the commonly applied steady-state approach.
5. Conclusions
A multi-dimensional self-consistent model of protoplanetary disks ‘ANDES’ is introduced and described. The purpose of ANDES is to provide researchers with a state-of-the-art, most up-to-date detailed thermo-chemical model of a protoplanetary disk that can be used to analyze high-quality IR and (sub-)millimeter observations of individual nearby disks. For the first time grain evolution and large-scale time-dependent molecular chemistry are included in modeling of physical structure of protoplanetary disks.
The iterative ANDES code is based on a flexible modular structure that includes 1) a 1+1D continuum radiative transfer module to calculate dust temperature, 2) a module to calculate gas-grain chemical evolution, 3) a 1+1D module to calculate detailed gas energy balance, and 4) a 1+1D module that calculates dust grain evolution. The disk structure is computed iteratively, assuming fixed dust density structure after the first iteration. Typically it takes iterations to reach convergence at 1% level of accuracy.
The continuum radiative transfer module is based on the two-stream Feautrier method with a high-resolution frequency grid. We consider dust continuum absorption, thermal emission, and coherent isotropic scattering. The dust evolution is modeled by accounting for coagulation, fragmentation, and gravitational sedimentation towards the disk midplane balanced by turbulent upward stirring. The chemical model is based on a gas-grain realization of the RATE’06 network, and includes surface reactions and X-ray/UV processes. All modules have been thoroughly benchmarked with previous studies, with overall good agreement and performance.
We study the impact of dust evolution on dust temperature, gas temperature, and chemical composition by comparing results of the disk models with evolved and pristine dust. We compute gas thermal structure corresponding to chemical abundances evolving from the initial abundances for , , and years. We show that time-dependent chemistry is important for a proper description of gas thermal balance. The strongest impact on the gas temperature (up to 100 K) occurs in the outer, low-density region beyond 100 AU. This is mainly due to the shift of H2/H PDR transition deeper into the disk with time.
In accordance with previous studies, it is found that the gas becomes hotter than the dust in elevated disk regions reaching 1 000–10 000 K in the inner atmosphere. However, the main heating source is different for the two dust models. In the disk with pristine dust it is photoelectric heating by grains. In the atmosphere of disk with evolved dust grains are strongly depleted, therefore photoelectric heating by PAHs becomes a dominant heating process. Thus a realistic, observationally-based estimates of absolute PAH abundances and sizes are required to calculate accurately gas temperature in the inner, AU disk atmosphere accessible with Spitzer, Herschel, and ALMA.
The response of disk chemical structure to the dust growth and sedimentation is twofold. First, due to higher transparency a partly UV-shielded molecular layer is shifted closer to the dense midplane. Second, the presence of big grains in the disk midplane delays the freeze-out of volatile gas-phase species such as CO there, while in adjacent upper layers the depletion is still effective. Even though the dust evolution shifts the molecular layer of the water vapor closer toward the cooler, midplane disk region, it increases its overall concentration. This aggravates the disagreement between the water vapor column densities predicted by modern astrochemical models, which are higher than those observed with Herschel in the disks around TW Hya (Hogerheijde et al., 2011) and DM Tau (Bergin et al., 2010) by factors of at least several (see also discussion in Semenov & Wiebe (2011)). Overall, molecular concentrations and thus column densities of many species are enhanced in the disk model with dust evolution, e.g., CO2, NH2CN, HNO, H2O, HCOOH, HCN, CO.
Acknowledgements
This research made use of NASA’s Astrophysics Data System. This work is supported by the RFBR grants 10-02-00612, 12-02-31248, Federal Targeted Program “Scientific resources of Innovation-Driven Russia” for 2009-2013 and NSh-3602.2012.2. SZ is supported by the Deutsche Forschungsgemeinschaft through SPP 1573: “Physics of the Interstellar Medium”. DS acknowledges support by the Deutsche Forschungsgemeinschaft through SPP 1385: “The first ten million years of the solar system — a planetary materials approach” (SE 1962/1-1 and 1-2). A. V. acknowledges the support of the National Science Foundation (US) for the astrochemistry program at the University of Virginia. We thank Kees Dullemond, Andras Zsom, Ewine F. van Dishoeck and Simon Bruderer for valuable discussions. We highly appreciate comments and suggestions of an anonymous referee, that helped us a lot to improve the quality of the paper.
References
- Acke et al. (2010) Acke, B., Bouwman, J., Juhász, A., Henning, T., van den Ancker, M. E., Meeus, G., Tielens, A. G. G. M., & Waters, L. B. F. M. 2010, ApJ, 718, 558
- Aikawa & Nomura (2006) Aikawa, Y. & Nomura, H. 2006, ApJ, 642, 1152
- Akimkin et al. (2011) Akimkin, V. V., Pavlyuchenkov, Y. N., Vasyunin, A. I., Wiebe, D. S., Kirsanova, M. S., & Henning, T. 2011, Ap&SS, 280
- Andrews & Williams (2005) Andrews, S. M. & Williams, J. P. 2005, ApJ, 631, 1134
- Aresu et al. (2011) Aresu, G., Kamp, I., Meijerink, R., Woitke, P., Thi, W.-F., & Spaans, M. 2011, A&A, 526, A163
- Aresu et al. (2012) Aresu, G., Meijerink, R., Kamp, I., Spaans, M., Thi, W.-F., & Woitke, P. 2012, A&A, 547, A69
- Bakes & Tielens (1994) Bakes, E. & Tielens, A. 1994, A&A, 427, 822
- Barshay & Lewis (1976) Barshay, S. S. & Lewis, J. S. 1976, ARA&A, 14, 81
- Beckwith & Sargent (1991) Beckwith, S. V. W. & Sargent, A. I. 1991, ApJ, 381, 250
- Bell et al. (1997) Bell, K. R., Cassen, P. M., Klahr, H. H., & Henning, T. 1997, ApJ, 486, 372
- Bergin et al. (2010) Bergin, E. A., Hogerheijde, M. R., Brinch, C., Fogel, J., Yıldız, U. A., Kristensen, L. E., van Dishoeck, E. F., Bell, T. A., Blake, G. A., Cernicharo, J., Dominik, C., Lis, D., Melnick, G., Neufeld, D., Panić, O., Pearson, J. C., Bachiller, R., Baudry, A., Benedettini, M., Benz, A. O., Bjerkeli, P., Bontemps, S., Braine, J., Bruderer, S., Caselli, P., Codella, C., Daniel, F., di Giorgio, A. M., Doty, S. D., Encrenaz, P., Fich, M., Fuente, A., Giannini, T., Goicoechea, J. R., de Graauw, T., Helmich, F., Herczeg, G. J., Herpin, F., Jacq, T., Johnstone, D., Jørgensen, J. K., Larsson, B., Liseau, R., Marseille, M., McCoey, C., Nisini, B., Olberg, M., Parise, B., Plume, R., Risacher, C., Santiago-García, J., Saraceno, P., Shipman, R., Tafalla, M., van Kempen, T. A., Visser, R., Wampfler, S. F., Wyrowski, F., van der Tak, F., Jellema, W., Tielens, A. G. G. M., Hartogh, P., Stützki, J., & Szczerba, R. 2010, A&A, 521, L33
- Birnstiel et al. (2010) Birnstiel, T., Dullemond, C. P., & Brauer, F. 2010, A&A, 513, 79
- Birnstiel et al. (2011) Birnstiel, T., Ormel, C. W., & Dullemond, C. P. 2011, A&A, 525, A11+
- Black (1987) Black, J. H. 1987, in Astrophysics and Space Science Library, Vol. 134, Interstellar Processes, ed. D. J. Hollenbach & H. A. Thronson Jr., 731–744
- Black & Dalgarno (1976) Black, J. H. & Dalgarno, A. 1976, ApJ, 203, 132
- Blum & Wurm (2008) Blum, J. & Wurm, G. 2008, ARA&A, 46, 21
- Brauer et al. (2008) Brauer, F., Dullemond, C. P., & Henning, T. 2008, A&A, 480, 859
- Brauer et al. (2008) Brauer, F., Henning, T., & Dullemond, C. P. 2008, A&A, 487, L1
- Bruggeman (1935) Bruggeman, D. A. G. 1935, Annalen der Physik, 416, 636
- Burke & Hollenbach (1983) Burke, J. R. & Hollenbach, D. J. 1983, A&A, 265, 223
- Chapillon et al. (2012) Chapillon, E., Guilloteau, S., Dutrey, A., Piétu, V., & Guélin, M. 2012, A&A, 537, A60
- Chiang & Goldreich (1997) Chiang, E. I. & Goldreich, P. 1997, ApJ, 490, 368
- Chiang et al. (2001) Chiang, E. I., Joung, M. K., Creech-Eakman, M. J., Qi, C., Kessler, J. E., Blake, G. A., & van Dishoeck, E. F. 2001, ApJ, 547, 1077
- Ciesla (2007) Ciesla, F. J. 2007, ApJ, 654, L159
- D’Alessio et al. (2001) D’Alessio, P., Calvet, N., & Hartmann, L. 2001, ApJ, 553, 321
- D’Alessio et al. (2006) D’Alessio, P., Calvet, N., Hartmann, L., Franco-Hernández, R., & Servín, H. 2006, ApJ, 638, 314
- D’Alessio et al. (1999) D’Alessio, P., Calvet, N., Hartmann, L., Lizano, S., & Cantó, J. 1999, ApJ, 527, 893
- D’Alessio et al. (1998) D’Alessio, P., Canto, J., Calvet, N., & Lizano, S. 1998, ApJ, 500, 411
- Dalgarno & McCray (1972) Dalgarno, A. & McCray, R. A. 1972, Annual Review of Astronomy and Astrophysics, 10, 375
- Dartois et al. (2003) Dartois, E., Dutrey, A., & Guilloteau, S. 2003, A&A, 399, 773
- Draine & Li (2007) Draine, B. & Li, A. 2007, The Astrophysical Journal, 657, 810
- Draine (1978) Draine, B. T. 1978, ApJS, 36, 595
- Draine & Bertoldi (1996) Draine, B. T. & Bertoldi, F. 1996, ApJ, 468, 269
- Dullemond (2002) Dullemond, C. P. 2002, A&A, 395, 853
- Dullemond & Dominik (2004) Dullemond, C. P. & Dominik, C. 2004, A&A, 421, 1075
- Dullemond & Dominik (2004) Dullemond, C. P. & Dominik, C. 2004, A&A, 417, 159
- Dullemond et al. (2007a) Dullemond, C. P., Henning, T., Visser, R., Geers, V. C., van Dishoeck, E. F., & Pontoppidan, K. M. 2007a, A&A, 473, 457
- Dullemond et al. (2007b) Dullemond, C. P., Hollenbach, D., Kamp, I., & D’Alessio, P. 2007b, Protostars and Planets V, 555
- Dullemond et al. (2002) Dullemond, C. P., van Zadelhoff, G. J., & Natta, A. 2002, A&A, 389, 464
- Dutrey et al. (1997) Dutrey, A., Guilloteau, S., & Guelin, M. 1997, A&A, 317, L55
- Dutrey et al. (2007) Dutrey, A., Henning, T., Guilloteau, S., Semenov, D., Piétu, V., Schreyer, K., Bacmann, A., Launhardt, R., Pety, J., & Gueth, F. 2007, A&A, 464, 615
- Evans et al. (2009) Evans, N., Calvet, N., Cieza, L., Forbrich, J., Hillenbrand, L., Lada, C., Merín, B., Strom, S., & Watson, D. 2009, ArXiv e-prints
- Flock et al. (2012) Flock, M., Henning, T., & Klahr, H. 2012, ApJ, 761, 95
- Fogel et al. (2011) Fogel, J. K. J., Bethell, T. J., Bergin, E. A., Calvet, N., & Semenov, D. 2011, ApJ, 726, 29
- Frank et al. (1992) Frank, J., King, A., & Raine, D. 1992, Accretion power in astrophysics., ed. Frank, J., King, A., & Raine, D.
- Fukagawa et al. (2004) Fukagawa, M., Hayashi, M., Tamura, M., Itoh, Y., Hayashi, S. S., Oasa, Y., Takeuchi, T., Morino, J.-i., Murakawa, K., Oya, S., Yamashita, T., Suto, H., Mayama, S., Naoi, T., Ishii, M., Pyo, T.-S., Nishikawa, T., Takato, N., Usuda, T., Ando, H., Iye, M., Miyama, S. M., & Kaifu, N. 2004, ApJ, 605, L53
- Furlan et al. (2006) Furlan, E., Hartmann, L., Calvet, N., D’Alessio, P., Franco-Hernández, R., Forrest, W. J., Watson, D. M., Uchida, K. I., Sargent, B., Green, J. D., Keller, L. D., & Herter, T. L. 2006, ApJS, 165, 568
- Furlan et al. (2009) Furlan, E., Watson, D. M., McClure, M. K., Manoj, P., Espaillat, C., D’Alessio, P., Calvet, N., Kim, K. H., Sargent, B. A., Forrest, W. J., & Hartmann, L. 2009, ApJ, 703, 1964
- Garrod & Herbst (2006) Garrod, R. T. & Herbst, E. 2006, A&A, 457, 927
- Garrod et al. (2009) Garrod, R. T., Vasyunin, A. I., Semenov, D. A., Wiebe, D. S., & Henning, T. 2009, ApJ, 700, L43
- Gorti et al. (2009) Gorti, U., Dullemond, C. P., & Hollenbach, D. 2009, ApJ, 705, 1237
- Gorti & Hollenbach (2008) Gorti, U. & Hollenbach, D. 2008, ApJ, 683, 287
- Guilloteau & Dutrey (1998) Guilloteau, S. & Dutrey, A. 1998, A&A, 339, 467
- Guilloteau et al. (2011) Guilloteau, S., Dutrey, A., Piétu, V., & Boehler, Y. 2011, A&A, 529, A105+
- Gundlach et al. (2011) Gundlach, B., Kilias, S., Beitz, E., & Blum, J. 2011, Icarus, 214, 717
- Henning et al. (2010) Henning, T., Semenov, D., Guilloteau, S., Dutrey, A., Hersant, F., Wakelam, V., Chapillon, E., Launhardt, R., Piétu, V., & Schreyer, K. 2010, ApJ, 714, 1511
- Hernández et al. (2007) Hernández, J., Hartmann, L., Megeath, T., Gutermuth, R., Muzerolle, J., Calvet, N., Vivas, A. K., Briceño, C., Allen, L., Stauffer, J., Young, E., & Fazio, G. 2007, ApJ, 662, 1067
- Hogerheijde et al. (2011) Hogerheijde, M. R., Bergin, E. A., Brinch, C., Cleeves, L. I., Fogel, J. K. J., Blake, G. A., Dominik, C., Lis, D. C., Melnick, G., Neufeld, D., Panić, O., Pearson, J. C., Kristensen, L., Yıldız, U. A., & van Dishoeck, E. F. 2011, Science, 334, 338
- Hueso & Guillot (2005) Hueso, R. & Guillot, T. 2005, A&A, 442, 703
- Ilgner et al. (2004) Ilgner, M., Henning, T., Markwick, A. J., & Millar, T. J. 2004, A&A, 415, 643
- Isella et al. (2009) Isella, A., Carpenter, J. M., & Sargent, A. I. 2009, ApJ, 701, 260
- Jonkheid et al. (2004) Jonkheid, B., Faas, F. G. A., van Zadelhoff, G.-J., & van Dishoeck, E. F. 2004, A&A, 428, 511
- Juhász et al. (2010) Juhász, A., Bouwman, J., Henning, T., Acke, B., van den Ancker, M. E., Meeus, G., Dominik, C., Min, M., Tielens, A. G. G. M., & Waters, L. B. F. M. 2010, ApJ, 721, 431
- Kamp (2011) Kamp, I. 2011, in EAS Publications Series, Vol. 46, EAS Publications Series, ed. C. Joblin & A. G. G. M. Tielens, 271–283
- Kamp & Bertoldi (2000) Kamp, I. & Bertoldi, F. 2000, A&A, 353, 276
- Kamp & Dullemond (2004) Kamp, I. & Dullemond, C. P. 2004, ApJ, 615, 991
- Kamp & van Zadelhoff (2001) Kamp, I. & van Zadelhoff, G.-J. 2001, A&A, 373, 641
- Keller et al. (2008) Keller, L. D., Sloan, G. C., Forrest, W. J., Ayala, S., D’Alessio, P., Shah, S., Calvet, N., Najita, J., Li, A., Hartmann, L., Sargent, B., Watson, D. M., & Chen, C. H. 2008, ApJ, 684, 411
- Kessler-Silacci et al. (2006) Kessler-Silacci, J., Augereau, J.-C., Dullemond, C. P., Geers, V., Lahuis, F., Evans, II, N. J., van Dishoeck, E. F., Blake, G. A., Boogert, A. C. A., Brown, J., Jørgensen, J. K., Knez, C., & Pontoppidan, K. M. 2006, ApJ, 639, 275
- Koerner et al. (1993) Koerner, D. W., Sargent, A. I., & Beckwith, S. V. W. 1993, Icarus, 106, 2
- Lada (1987) Lada, C. J. 1987, in IAU Symposium, Vol. 115, Star Forming Regions, ed. M. Peimbert & J. Jugaku, 1–17
- Laor & Draine (1993) Laor, A. & Draine, B. T. 1993, ApJ, 402, 441
- Lee et al. (1998) Lee, H.-H., Roueff, E., Pineau des Forets, G., Shalabiea, O. M., Terzieva, R., & Herbst, E. 1998, A&A, 334, 1047
- Lommen et al. (2009) Lommen, D., Maddison, S. T., Wright, C. M., van Dishoeck, E. F., Wilner, D. J., & Bourke, T. L. 2009, A&A, 495, 869
- Lommen et al. (2010) Lommen, D. J. P., van Dishoeck, E. F., Wright, C. M., Maddison, S. T., Min, M., Wilner, D. J., Salter, D. M., van Langevelde, H. J., Bourke, T. L., van der Burg, R. F. J., & Blake, G. A. 2010, A&A, 515, A77+
- Malbet et al. (2001) Malbet, F., Lachaume, R., & Monin, J.-L. 2001, A&A, 379, 515
- McClure et al. (2010) McClure, M. K., Furlan, E., Manoj, P., Luhman, K. L., Watson, D. M., Forrest, W. J., Espaillat, C., Calvet, N., D’Alessio, P., Sargent, B., Tobin, J. J., & Chiang, H.-F. 2010, ApJS, 188, 75
- Melis et al. (2011) Melis, C., Duchêne, G., Chomiuk, L., Palmer, P., Perrin, M. D., Maddison, S. T., Ménard, F., Stapelfeldt, K., Pinte, C., & Duvert, G. 2011, ApJ, 739, L7+
- Men’shchikov & Henning (1997) Men’shchikov, A. B. & Henning, T. 1997, A&A, 318, 879
- Mihalas (1978) Mihalas, D. 1978, Stellar atmospheres /2nd edition/, ed. Hevelius, J.
- Muto et al. (2012) Muto, T., Grady, C. A., Hashimoto, J., Fukagawa, M., Hornbeck, J. B., Sitko, M., Russell, R., Werren, C., Curé, M., Currie, T., Ohashi, N., Okamoto, Y., Momose, M., Honda, M., Inutsuka, S., Takeuchi, T., Dong, R., Abe, L., Brandner, W., Brandt, T., Carson, J., Egner, S., Feldt, M., Fukue, T., Goto, M., Guyon, O., Hayano, Y., Hayashi, M., Hayashi, S., Henning, T., Hodapp, K. W., Ishii, M., Iye, M., Janson, M., Kandori, R., Knapp, G. R., Kudo, T., Kusakabe, N., Kuzuhara, M., Matsuo, T., Mayama, S., McElwain, M. W., Miyama, S., Morino, J.-I., Moro-Martin, A., Nishimura, T., Pyo, T.-S., Serabyn, E., Suto, H., Suzuki, R., Takami, M., Takato, N., Terada, H., Thalmann, C., Tomono, D., Turner, E. L., Watanabe, M., Wisniewski, J. P., Yamada, T., Takami, H., Usuda, T., & Tamura, M. 2012, ApJ, 748, L22
- Najita et al. (2011) Najita, J. R., Ádámkovics, M., & Glassgold, A. E. 2011, ApJ, 743, 147
- Natta et al. (2007) Natta, A., Testi, L., Calvet, N., Henning, T., Waters, R., & Wilner, D. 2007, Protostars and Planets V, 767
- Neufeld & Kaufman (1993) Neufeld, D. A. & Kaufman, M. J. 1993, Astrophysical Journal v.418, 418, 263
- Neufeld et al. (1995) Neufeld, D. A., Lepp, S., & Melnick, G. J. 1995, Astrophysical Journal Supplement v.100, 100, 132
- Nomura (2002) Nomura, H. 2002, ApJ, 567, 587
- Nomura et al. (2007) Nomura, H., Aikawa, Y., Tsujimoto, M., Nakagawa, Y., & Millar, T. J. 2007, ApJ, 661, 334
- Nomura & Nakagawa (2006) Nomura, H. & Nakagawa, Y. 2006, ApJ, 640, 1099
- Oliveira et al. (2011) Oliveira, I., Olofsson, J., Pontoppidan, K. M., van Dishoeck, E. F., Augereau, J.-C., & Merín, B. 2011, ApJ, 734, 51
- Ormel & Cuzzi (2007) Ormel, C. W. & Cuzzi, J. N. 2007, A&A, 466, 413
- Pérez et al. (2012) Pérez, L. M., Carpenter, J. M., Chandler, C. J., Isella, A., Andrews, S. M., Ricci, L., Calvet, N., Corder, S. A., Deller, A. T., Dullemond, C. P., Greaves, J. S., Harris, R. J., Henning, T., Kwon, W., Lazio, J., Linz, H., Mundy, L. G., Sargent, A. I., Storm, S., Testi, L., & Wilner, D. J. 2012, ApJ, 760, L17
- Piétu et al. (2007) Piétu, V., Dutrey, A., & Guilloteau, S. 2007, A&A, 467, 163
- Press et al. (1992) Press, W., Teukolsky, S., Vetterling, W., & Flannery, B. 1992, Numerical recipes in FORTRAN. The art of scientific computing
- Ricci et al. (2010) Ricci, L., Testi, L., Natta, A., Neri, R., Cabrit, S., & Herczeg, G. J. 2010, A&A, 512, A15+
- Rodmann et al. (2006) Rodmann, J., Henning, T., Chandler, C. J., Mundy, L. G., & Wilner, D. J. 2006, A&A, 446, 211
- Röllig et al. (2007) Röllig, M., Abel, N., Bell, T., Bensch, F., Black, J., Ferland, G., Jonkheid, B., Kamp, I., Kaufman, M., Bourlot, J. L., Petit, F. L., Meijerink, R., Morata, O., Ossenkopf, V., Roueff, E., Shaw, G., Spaans, M., Sternberg, A., Stutzki, J., Thi, W., Dishoeck, E. V., Hoof, P. V., Viti, S., & Wolfire, M. 2007, A&A, 467, 187
- Röllig et al. (2006) Röllig, M., Ossenkopf, V., Jeyakumar, S., Stutzki, J., & Sternberg, A. 2006, A&A, 451, 917
- Ruffle & Herbst (2000) Ruffle, D. P. & Herbst, E. 2000, MNRAS, 319, 837
- Schmitt et al. (1997) Schmitt, W., Henning, T., & Mucha, R. 1997, A&A, 325, 569
- Schöier et al. (2005) Schöier, F. L., van der Tak, F. F. S., van Dishoeck, E. F., & Black, J. H. 2005, Astronomy and Astrophysics, 432, 369
- Schräpler & Henning (2004) Schräpler, R. & Henning, T. 2004, ApJ, 614, 960
- Semenov et al. (2010) Semenov, D., Chakraborty, S., & Thiemens, M. 2010, Chemical and Isotopic Evolution of the Solar Nebula and Protoplanetary Disks, ed. Apai, D. A. & Lauretta, D. S., 97–127
- Semenov & Wiebe (2011) Semenov, D. & Wiebe, D. 2011, ApJS, 196, 25
- Semenov et al. (2004) Semenov, D., Wiebe, D., & Henning, T. 2004, A&A, 417, 93
- Shakura & Sunyaev (1973) Shakura, N. I. & Sunyaev, R. A. 1973, A&A, 24, 337
- Sicilia-Aguilar et al. (2011) Sicilia-Aguilar, A., Henning, T., Dullemond, C. P., Patel, N., Juhász, A., Bouwman, J., & Sturm, B. 2011, ApJ, 742, 39
- Siebenmorgen & Heymann (2012) Siebenmorgen, R. & Heymann, F. 2012, ArXiv e-prints
- Siebenmorgen & Krügel (2010) Siebenmorgen, R. & Krügel, E. 2010, A&A, 511, A6
- Spitzer (1978) Spitzer, Jr., L. 1978, Physical processes in the interstellar medium., ed. Spitzer, L., Jr.
- Stephens & Dalgarno (1973) Stephens, T. L. & Dalgarno, A. 1973, ApJ, 186, 165
- Sternberg & Dalgarno (1989) Sternberg, A. & Dalgarno, A. 1989, The Astrophysical Journal, 338, 197
- Sternberg & Dalgarno (1995) Sternberg, A. & Dalgarno, A. 1995, ApJS, 99, 565
- Sturm et al. (2010) Sturm, B., Bouwman, J., Henning, T., Evans, N. J., Acke, B., Mulders, G. D., Waters, L. B. F. M., van Dishoeck, E. F., Meeus, G., Green, J. D., Augereau, J. C., Olofsson, J., Salyk, C., Najita, J., Herczeg, G. J., van Kempen, T. A., Kristensen, L. E., Dominik, C., Carr, J. S., Waelkens, C., Bergin, E., Blake, G. A., Brown, J. M., Chen, J.-H., Cieza, L., Dunham, M. M., Glassgold, A., Güdel, M., Harvey, P. M., Hogerheijde, M. R., Jaffe, D., Jørgensen, J. K., Kim, H. J., Knez, C., Lacy, J. H., Lee, J.-E., Maret, S., Meijerink, R., Merín, B., Mundy, L., Pontoppidan, K. M., Visser, R., & Yıldız, U. A. 2010, A&A, 518, L129+
- Tanaka et al. (2005) Tanaka, H., Himeno, Y., & Ida, S. 2005, ApJ, 625, 414
- Tannirkulam et al. (2007) Tannirkulam, A., Harries, T. J., & Monnier, J. D. 2007, ApJ, 661, 374
- Thi et al. (2011) Thi, W.-F., Woitke, P., & Kamp, I. 2011, MNRAS, 412, 711
- Tielens & Hollenbach (1985) Tielens, A. G. G. M. & Hollenbach, D. 1985, ApJ, 291, 722
- van Dishoeck & Black (1982) van Dishoeck, E. F. & Black, J. H. 1982, ApJ, 258, 533
- van Dishoeck et al. (2006) van Dishoeck, E. F., Jonkheid, B., & van Hemert, M. C. 2006, in Faraday discussion, Vol. 133, Chemical evolution of the Universe, ed. I. R. Sims & D. A. Williams, 231–244
- Vasyunin et al. (2009) Vasyunin, A. I., Semenov, D. A., Wiebe, D. S., & Henning, T. 2009, ApJ, 691, 1459
- Vasyunin et al. (2011) Vasyunin, A. I., Wiebe, D. S., Birnstiel, T., Zhukovska, S., Henning, T., & Dullemond, C. P. 2011, ApJ, 727, 76
- Visser et al. (2009) Visser, R., van Dishoeck, E. F., & Black, J. H. 2009, A&A, 503, 323
- Wada et al. (2008) Wada, K., Tanaka, H., Suyama, T., Kimura, H., & Yamamoto, T. 2008, ApJ, 677, 1296
- Whitney & Hartmann (1992) Whitney, B. A. & Hartmann, L. 1992, ApJ, 395, 529
- Williams (2012) Williams, J. P. 2012, Meteoritics and Planetary Science, 232
- Williams & Cieza (2011) Williams, J. P. & Cieza, L. A. 2011, ARA&A, 49, 67
- Woitke et al. (2009) Woitke, P., Kamp, I., & Thi, W.-F. 2009, A&A, 501, 383
- Wolf et al. (1999) Wolf, S., Henning, T., & Stecklum, B. 1999, A&A, 349, 839
- Woodall et al. (2007) Woodall, J., Agúndez, M., Markwick-Kemper, A. J., & Millar, T. J. 2007, A&A, 466, 1197
- Youdin & Lithwick (2007) Youdin, A. N. & Lithwick, Y. 2007, Icarus, 192, 588
Appendix A Main gas heating and cooling processes
A.1. Main heating processes
Photoelectric heating by grains
We follow Kamp & van Zadelhoff (2001) and calculate the photoelectric heating rate by silicate grains as
| (A1) |
where is the dust absorption coefficient at UV wavelengths, is the strength of the UV radiation field in units of the Draine FUV interstellar field (Draine, 1978), and is the photoelectric efficiency determined by the grain charge parameter (here is the electron number density). For we adopt expressions from Kamp & van Zadelhoff (2001). The relative strength of the FUV, , is defined as
| (A2) |
The average dust opacity at UV wavelengths is determined by integration of frequency-dependent dust absorption cross-sections in the UV frequency range
| (A3) |
where is given by the dust evolution model.
Photoelectric heating by PAHs
Polycyclic aromatic hydrocarbons (PAHs) possess large cross-sections for UV photon absorption and therefore can efficiently heat gas by photoelectric emission, even if their abundance is low. Heating by PAHs can be particularly important for disks with evolved dust, since PAHs are better mixed with gas than macroscopic dust particles, and thus remain in the disk atmosphere while bigger grains settle towards the midplane (Dullemond et al., 2007a). Bakes & Tielens (1994) derived a simple analytical expression for their PE heating rate:
| (A4) |
where is the hydrogen nuclei number density, and . The parameter is the depletion factor of the PAH abundance relative to the diffuse ISM value, which is estimated to be of the total carbon budget (Draine & Li, 2007). The details of the evolution of PAHs in protoplanetary disks are far from being fully understood, though it is clear that high-energy stellar radiation may play an enormous role in their destruction and chemical transformation (Acke et al., 2010; Siebenmorgen & Krügel, 2010; Siebenmorgen & Heymann, 2012). Therefore, we do not consider PAHs in the simulations of dust evolution and treat as a free parameter of the model. In the present paper we assume based on estimates from observations of PAH spectra in disks surrounding young T Tauri and Herbig Ae stars (Keller et al., 2008; Kamp, 2011). A detailed study of the effects of PAHs heating on the structure of protoplanetary disks with evolved dust is beyond the scope of the present paper.
Cosmic ray heating
Cosmic ray (CR) particles deposit energy mainly through ionization of H2 and H at the rate (Bakes & Tielens, 1994):
| (A5) |
where s-1 is the attenuated CR ionization rate and denotes concentration of a species X.
Heating by surface H2 formation
Formation of one molecule on the grain surface liberates 4.48 eV of energy, but the exact partitioning of this energy into vibration, rotation, translation and accommodation by a grain lattice remains uncertain. It is commonly assumed that this energy is equally redistributed between rotational, vibrational and translational movements. We assume that formation of one hydrogen molecule returns only 1.5 eV ( erg) to the gas (Black & Dalgarno, 1976). Then, the corresponding heating rate is
| (A6) |
where is the formation rate in s-1. The further details of calculation of chemical reactions rates are described in Sect. 2.3.
Photodissociation of H2
We take into account only spontaneous radiative dissociation of : . Assuming that the average kinetic energy of dissociation products is 0.45 eV (Stephens & Dalgarno, 1973), the corresponding heating rate is
| (A7) |
where is the photodissociation rate of . To calculate this rate, we take into account self-shielding of H2 molecules as given by Eq.(37) from Draine & Bertoldi (1996).
Collisional de-excitation of H2
In dense PDR regions collisional de-excitation of FUV-pumped H is the second most important heating mechanism (Sternberg & Dalgarno, 1995). Here we adopt a simple two-level approximation of vibrational heating and cooling from Röllig et al. (2006), which nevertheless well reproduces the net heating rate computed by Sternberg & Dalgarno (1995) with 15 vibrational levels. The net vibrational heating is given by the following expression:
| (A8) |
where is the vibrational heating rate by collisional de-excitation and is the vibrational cooling rate. For details of the calculation of the heating and cooling rates we refer to the Appendix C in Röllig et al. (2006).
C photoionization
Ionization of atomic carbon releases electrons with kinetic energies of eV (Black, 1987). The corresponding heating rate can be approximated as:
| (A9) |
where is the photoionization rate of the C atoms.
Viscous heating
A.2. Main cooling processes
NLTE line cooling
The net line cooling rate for a given species is determined by the total amount of upwards and downwards radiative transitions. Level populations for each coolant are calculated from statistical equilibrium equations. Unlike FUV, the local FIR intensity that enters these equations depends on the temperature and level populations over the large part of the disk. This requires iterations over all vertical grid points simultaneously. To simplify a calculation, we adopt an escape probability approach using the expression (B9) in Tielens & Hollenbach (1985).
We perform the full non-LTE calculations, considering the major coolants for a typical PDR: fine structure lines of C, O, C+ and rotational lines for the CO molecule. The data for energy levels, collision, emission and absorption coefficients for computation of the NLTE line cooling are taken from the LAMDA database (Schöier et al., 2005). The data include collision rate coefficients for collisions of , H, e-, He, and H+ with O and C atoms, as well as collisions of , H, and e- with C+, and with CO. For minor coolants we use approximate formulas presented below.
High-temperature coolants
The cooling by emission from metastable levels of neutral and ionic species becomes important at temperatures exceeding several thousand Kelvin. We calculate the cooling rate from emission by O I (630 nm) according to Sternberg & Dalgarno (1989):
| (A11) |
where is the neutral oxygen concentration.
The cooling by electron impact excitation of metastable levels of ionic species (e.g., Fe+, Fe++, Si+) is calculated by approximate formula from Dalgarno & McCray (1972):
| (A12) |
where parameters and for each ion are given in Dalgarno & McCray (1972).
Another important cooling process at high temperatures is Ly emission. We adopt the cooling rate by Ly emission from Spitzer (1978):
| (A13) |
H2O line emission
Thermal accommodation
Thermal accommodation is the energy exchange by inelastic collisions between dust and gas. In disk models with standard ISM-like dust it is a dominant cooling process, with the exception of the upper, tenuous atmosphere and outer radii ( AU) (e.g., Woitke et al., 2009). We utilize the corresponding cooling rate from Burke & Hollenbach (1983):
| (A14) |
where the thermal accommodation coefficient is set to 0.3 ( a typical value for silicates and carbon).
Appendix B Radiative transfer and gas thermal balance benchmarking
The RT module of the ANDES code was checked for the following cases which allow an analytic or semi-analytic solution:
-
•
Optically thin case, zero non-radiative heating source (A14), arbitrary incident radiation. In this case the mean intensity in the media is equal to the incident one and temperature may be derived from (3) and it is the same for every position in media. Tests show an equality of temperatures which are derived by our RT code and by independent numerical solution of the energy balance equation (3).
-
•
Arbitrary media (optically thick, non-gray opacities) with the non-diluted Planck incident radiation. In this case the media becomes isothermal with temperature of radiation. Test show an equality of temperatures and radiation field derived from analytical and numerical solutions.
-
•
Optically thick media with gray opacities, arbitrary incident radiation and non-radiative dust heating function which is proportional to dust density and has no other -dependence. In this case the system of Equations (1)–(3) narrow down to the second order linear ODE and may be solved analytically. A comparison of the analytical and numerical solutions is presented in Figure 18. The mean intensity parabolic profile is shown in the inset graph as well.
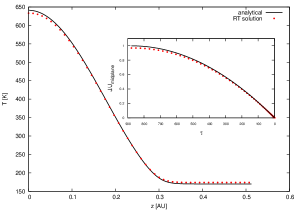
The surface of the disk is a photodissociation region (PDR) controlled by UV radiation from a star and interstellar radiation field. Therefore, we perform benchmarking of the thermal balance in our code as proposed in the PDR code comparison study (Röllig et al., 2007). For benchmarking purposes we use a reduced chemical network restricted to the most abundant elements (H, He, O, C, e-) and 31 species(Table 4 in Röllig et al., 2007). The reaction rates are taken from the UMIST99 database with some corrections from A. Sternberg. dissociation rate is . Cosmic ray H ionization rate is . For more details of benchmark test we refer to Röllig et al. (2007).
All benchmark models assume plane-parallel, semi-infinite geometry of clouds of total constant hydrogen density of and . The values of the standard far UV field were taken as and times the Draine (1978) field. There are two sets of benchmark models: four with fixed dust and gas temperatures of 30 and 50 K, respectively, and the other set of four models with the gas temperature resulting from thermal balance. The first set of models with fixed temperature aims at testing main ingredients of the thermal balance: solutions of chemistry and statistical equilibrium equations for level populations of main coolants, while the second set examines solution of thermal balance. Here we present results of benchmark tests for both kinds of models with density and far UV field strength (models F4 and V4 in Röllig et al. (2007)).
The left panel of Figure 19 shows comparison of our calculations with post-benchmark results for the H/ transition zone typical for PDR environment. Right panel of Figure 19 shows the C+/CO/C transition zone.
Main heating and cooling rates included in benchmarking are shown in the left panel of Figure 20. Gas-grain cooling and [OI] 63line are the dominant cooling processes for . CO lines dominate cooling at high attenuated regions. Our line cooling rates show remarkable agreement with data from Röllig et al. (2007) for dominant cooling processes: [CII] 158, [OI] 63, 145, [CI] 370, 610lines. Comparison of our model results for gas temperature in the slab with other PDR codes is shown in Figure 20. At small the gas temperature is much higher than the dust temperature due to photoelectric heating and agrees well with other PDR codes.