Quasar host galaxies in the SDSS Stripe 82
Abstract:
We present first results from our study of the properties of 400 low redshift (z 0.5) quasars, based on a large homogeneous dataset derived from the Stripe 82 area of the Sloan Digital Sky Survey (SDSS) Data Release 7 (DR7). For this sky region, deep (r22.4) u,g,r,i,z images are available, up to 2 mag deeper than standard SDSS images, allowing us to study both the host galaxies and the Mpc-scale environments of the quasars. This sample greatly outnumbers previous studies of low redshift quasar hosts, from the ground or from space. Here we report the preliminary results for the quasar host galaxies. We are able to resolve the host galaxy in 80 % of the quasars. The quasar hosts are luminous and large, the majority of them in the range between M*-1 and M*-2, and with 10 kpc galaxy scale-lengths. Almost half of the host galaxies are best fit with an exponential disk, while the rest are spheroid-dominated. There is a reasonable relation between the central black hole mass and the host galaxy luminosity.
1 Introduction
Supermassive black holes (SMBHs) are ubiquitously found in the centres of massive galaxies and the BH masses correlate with the large-scale properties of the galaxies, e.g., the stellar velocity dispersion, the luminosity, and the mass of the spheroidal component (e.g. Gultekin et al. 2009). These relations have been interpreted as the outcome of a joint evolution between BHs and their host galaxies and are therefore of critical importance for understanding the processes that link nuclear activity to galaxy formation and evolution (e.g. Decarli et al. 2010; Merloni et al. 2010; Cisternas et al. 2011).
Nuclear activity, i.e. accretion onto the SMBH, appears to be a common phase in the evolution of normal galaxies. Furthermore, SMBHs may well have a period of maximum growth (maximum nuclear luminosity) contemporaneous with the bulk of the initial star formation in the bulge.
Both ground-based and HST studies have established that practically all luminous low redshift (z0.5) quasars reside in massive, spheroid-dominated host galaxies, whereas at lower luminosities quasars can also be found also in early-type spiral hosts at (e.g. Bahcall et al. 1997; Dunlop et al. 2003; Pagani et al. 2003; Floyd et al. 2004; Jahnke et al. 2004). This is in good agreement with the BH – bulge relationship in inactive galaxies (e.g. Gultekin et al. 2009), since very massive BHs power luminous quasars. Only 15% are mergers but it is difficult to determine clear merger signatures from morphology alone.
At high redshift (z 1) HST observations of quasar host galaxies (e.g. Floyd et al. 2013 and references therein) have been complemented by significant contributions from 8-m class ground- based telescopes under superb seeing conditions (Kotilainen et al. 2007, 2009) or with adaptive optics (Falomo et al. 2005, 2008; Wang et al 2013).
Comparison of host galaxies of AGN at high and low redshift constrain host galaxy evolution, in comparison to the evolution of normal galaxies. Most of the quoted studies of quasar hosts have considered only few tens of objects, therefore in order to derive a picture of the host properties at various redshifts one needs to combine many different, often heterogeneous, samples. Observations carried out by the HST are more homogeneous than samples based on ground-based observations but the size of these samples remains relatively small. For instance in the range 0.25 z 0.5 only about 50 quasar hosts have been imaged by HST.
In order to explore a significantly larger dataset of quasars, one should refer to large surveys that include both imaging and spectroscopic data. In this respect one of the most productive recent surveys is the Sloan Digital Sky Survey (SDSS). Standard SDSS images are, however, too shallow and the faint nebulosity around the nucleus of quasars is not easily detected. This problem has been overcome in the case of a special sky region mapped by the SDSS called the Stripe82 (Annis et al. 2011). It covers a total area of 270 sq.deg that was observed 80 times, and the co-added images are up to 2 mag deeper than the standard SDSS images.
Here we present preliminary results from our study of the properties of the host galaxies of the largest so far, homogeneous sample of low redshift (z 0.5) quasars in the Stripe 82 area of the SDSS DR7. Full results on the host galaxies will be discussed in Falomo et al. (in prep.) and on the environments in Karhunen et al. (in prep.) We adopt the concordance cosmology with H0 = 70 km s-1 Mpc-1, = 0.3 and = 0.7.
2 The SDSS Stripe 82 quasar sample
To derive the sample of low redshift quasars, we used the fifth release of the SDSS Quasar Catalog (Schneider et al. 2010) that is based on the SDSS DR7. It consists of quasars that have a highly reliable redshift measurement, , absolute magnitude -21.0, and at least one emission line with FWHM1000 km/sec. This catalog contain 105 spectroscopically confirmed quasars. Our analysis is done for low redshift objects that are in the Stripe82 region, thus making possible the study of the host galaxies.
The final sample consists of 416 quasars at 0.1 z 0.5. The sample is dominated by radio-quiet quasars: only 24 (5%) are radio-loud. The mean redshift of the sample is = and the mean absolute magnitude is = . We also selected a comparison sample of 580 inactive galaxies matched closely in redshift with the quasars, that will be used in a later stage of this project to compare the properties of the environments.
3 Image analysis
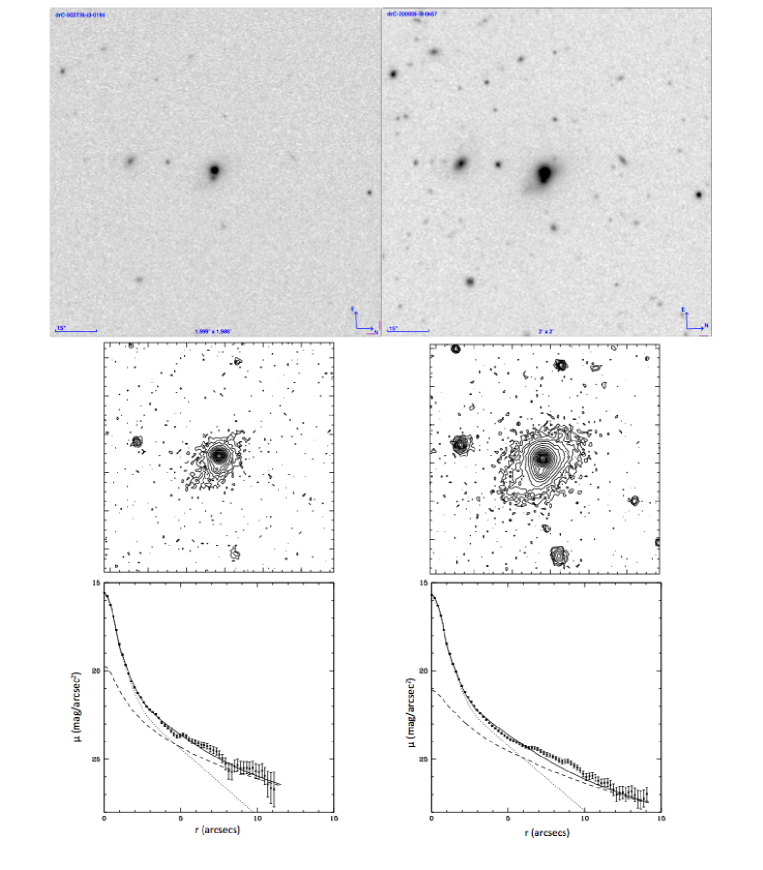
In order to derive the properties of the quasar host galaxies, we performed a 2D fit of the images of the quasars, assuming the superposition of two components: the nucleus and the surrounding nebulosity. The first is described by the local Point Spread Function (PSF) of the image, while the second is described by a galaxy model following a Sersic law convolved with the PSF. The analysis was performed using the Astronomical Image Decomposition Analysis (AIDA, Uslenghi & Falomo 2011).
The most critical aspect of the decomposition is the determination of the PSF. The field of view of SDSS images is large enough to always contain many stars to derive the most suitable PSF. In each field, we have selected a number of stars (between 5 and 15) around the target, based on various parameters such as their magnitude, FWHM and ellipticity. We then defined a radius to compute the PSF model and a ring around each star where to compute the sky background. The PSF model was then obtained from the fit of all selected stars using a multifunction 2D model composed of three gaussians and one exponential function.
The next step of the analysis is to fit each quasar with both a scaled PSF and a two-component model (PSF + galaxy). In order to distinguish resolved from unresolved objects, we compared the of the two fits and visually inspected all the fits. In Figure 1 we show an example of the adopted procedure.
4 Quasar host galaxies
From the above procedure, we are able to classify 354 (85%) quasars as resolved, and 56 (13%) quasars as unresolved. Further 6 (1%) quasars were contaminated by nearby bright sources or defects, and were removed from following analysis. Of all the quasars in the sample 155 (37%) have a nearby companion or tidal features.
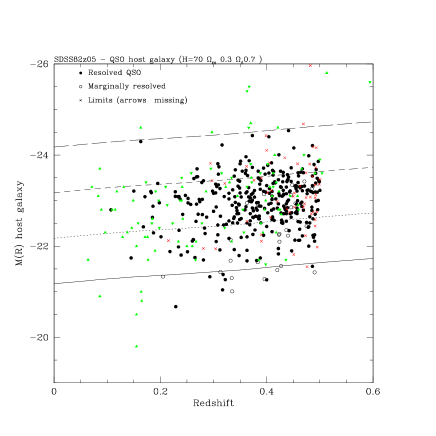
The average K-corrected rest-frame R-band absolute magnitude of the host galaxies for all the resolved quasars is = -22.96 0.62. This is in excellent agreement with a smaller sample of quasar hosts in the same redshift range observed by HST (Floyd et al. 2004), = -23.00 1.05.
The distribution of the quasar host galaxies in the redshift-luminosity plane (Fig 2, left) shows that they are encompassed between M(R) -21 and M(R) -24, corresponding to a range between M* and M*-3 with the majority of them in the range between M*-1 and M*-2.
The host galaxy sizes of the resolved quasars range from 2 kpc to 15 kpc, with average value 8 kpc. This is in good agreement with previous studies (Dunlop et al. 2003, Bennert et al. 2008) and indicates that quasars preferentially live in large host galaxies. Both spheroid- and disc-dominated morphologies were found in our sample, with almost half of the sample best fit with n=1, i.e. an exponential disk profile. Work is in progress to determine if there is a dependence of the host galaxy morphology (Sersic index) with the luminosity of the quasar, as found in previous studies (e.g., Dunlop et al. 2003).
5 Black hole – galaxy relationship
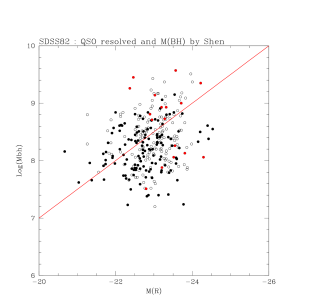
Our large and homogeneous dataset allows us to investigate the relationship between the BH mass and host galaxy mass for low redshift quasars. For the BH mass, we adopted the measurements obtained by Shen et al. (2011) who estimate the virial BH mass using the FWHM of for all the quasar with . All the spectra have been visually inspected and 31 objects (7%) have been removed from the final sample because of very low S/N ratio of the spectra. For three objects we have obtained a new measurement of the BH mass.
In Figure 2, right, we show the relationship between the BH mass and the absolute magnitude of the host galaxy in the R band for all the resolved quasars that have good S/N spectra. The absolute magnitude of the host galaxies is in the range -22 M(R) -24 and BH masses between 107 and 109 M. The average BH mass of the quasars is log(MBH) = 8.330.43. The relation between the BH masses and the host galaxy luminosities (masses), albeit on average agrees with the relation in the local Universe, exhibits quite large scatter.
6 Future work
For the 100 well resolved quasars at z 0.25 and m(host) 21, we shall investigate the host galaxy colours in the bgr rest-frame. These will have implications on the fraction of blue star forming host galaxies as a function of quasar type, luminosity and environment (e.g. Jahnke et al. 2004; Floyd et al. 2013). We are also investigating the properties of the close ( 0.5 Mpc) environment of the quasars.
References
- [1] Annis,J., Soares-Santos,M., Strauss,M.A. et al. 2011, astro-ph1111.6619
- [2] Bahcall,J.N., Kirhakos,S., Saxe,D.H., Schneider,D.P., 1997, ApJ, 479, 642
- [3] Bennert,N., Canalizo, G., Junwiert, B. et al. 2008, ApJ, 677, 846
- [4] Bettoni,D., Falomo,R., Fasano,G., Govoni,F., 2003, A&A, 399, 869
- [5] Cisternas,M., Jahnke,K., Bongiorno,A., et al., 2011, ApJ, 741, L11
- [6] Decarli,R., Falomo,R., Treves,A., et al., 2010, MNRAS, 402, 2453
- [7] Dunlop J.S., McLure R.J., Kukula M.J., et al., 2003, MNRAS, 340, 1095
- [8] Falomo,R., Kotilainen,J.K., Scarpa,R., Treves,A. 2005, AA 434, 469
- [9] Falomo,R., Treves,A., Kotilainen,J.K., Scarpa,R., Uslenghi,M., 2008, ApJ 673 694
- [10] Floyd, D., Kukula,M., Dunlop,J. et al., 2004, MNRAS, 355, 196
- [11] Floyd, D., Dunlop,J., Kukula,M., et al. 2013, MNRAS, 429, 2
- [12] Gultekin,K., Richstone,D.O., Gebhardt,K. et al., 2009, ApJ 698, 198
- [13] Jahnke K., Kuhlbrodt B., Wisotzki L., 2004, MNRAS, 352, 399
- [14] Kotilainen,J.K.; Falomo,R; Labita,M; Treves,A; Uslenghi,M, 2007, ApJ 660 1039
- [15] Kotilainen,J.K.; Falomo,R; Decarli,R et al. 2009, ApJ, 703, 1663
- [16] Merloni,A.; Bongiorno,A.; Bolzonella,M. et al., 2010, ApJ 708, 137
- [17] Pagani C., Falomo R., Treves A., 2003, ApJ 596, 830
- [18] Schneider, D.P., Richards, G.T., Hall, P.B., et al. 2010, AJ, 139, 2360
- [19] Shen,Y., Richards,G.T., Strauss,M.A. et al., 2011, ApJS, 194, 45
- [20] Uslenghi,M., Falomo,R., 2011 Proc. SPIE 8135, 813524
- [21] Wang,Y.P., Yamada,T., Tanaka,I., Iye,M., Ji,T., 2013, PASJ, submitted (arXiv:1301.1129)