Genetic draft, selective interference, and population genetics of rapid adaptation
Abstract
To learn about the past from a sample of genomic sequences, one needs to understand how evolutionary processes shape genetic diversity. Most population genetic inference is based on frameworks assuming adaptive evolution is rare. But if positive selection operates on many loci simultaneously, as has recently been suggested for many species including animals such as flies, a different approach is necessary. In this review, I discuss recent progress in characterizing and understanding evolution in rapidly adapting populations where random associations of mutations with genetic backgrounds of different fitness, i.e., genetic draft, dominate over genetic drift. As a result, neutral genetic diversity depends weakly on population size, but strongly on the rate of adaptation or more generally the variance in fitness. Coalescent processes with multiple mergers, rather than Kingman’s coalescent, are appropriate genealogical models for rapidly adapting populations with important implications for population genetic inference.
I Introduction
Neutral diffusion or coalescent models (Kimura, 1964; Kingman, 1982) predict that genetic diversity at unconstrained sites is proportional to the (effective) population size – for a simple reason: Two randomly chosen individuals have a common parent with a probability of order and the first common ancestor of two individuals lived of order generations ago. Forward in time, this neutral coalescence corresponds to genetic drift. However, the observed correlation between genetic diversity and population size is rather weak (Lewontin, 1974; Leffler et al., 2012), implying that processes other than genetic drift dominate coalescence in large populations. This notion is reinforced by the observation that pesticide resistance in insects can evolve independently on multiple genetic backgrounds (Karasov et al., 2010; Labbé et al., 2007) and can involve several adaptive steps in rapid succession (Schmidt et al., 2010). This high mutational input suggests that the short-term effective population size of D. melanogaster is greater than and conventional genetic drift should be negligible. Possible forces that accelerate coalescence and reduce diversity are purifying and positive selection. Historically, the effects of purifying selection have received most attention (reviewed by Charlesworth (2012)) and my focus here will be on the role of positive selection.
A selective sweep reduces nearby polymorphims through hitch-hiking. Polymorphisms linked to the sweeping allele are brought to higher frequency, while others are driven out (Maynard Smith and Haigh, 1974). Linked selection not only reduces diversity, but also slows down adaptation in other regions of the genome – an effect known as Hill-Robertson interference (Hill and Robertson, 1966). Hill-Roberston interference has been intensively studied in two locus models (Barton, 1994) where the effect is quite intuitive: two linked beneficial mutations arising in different individuals compete and the probability that both mutations fix increases with the recombination rate between the loci. Pervasive selection, however, requires many-locus-models. Here, I will review recent progress in understanding how selection at many loci limits adaptation and shapes genetic diversity. Linked selection is most pronounced in asexual organisms. The theory of asexual evolution is partly motivated by evolution experiments with microbes, which have provided us with detailed information about the spectrum of adaptive molecular changes and their dynamics. I will then turn to facultatively sexual organisms which include many important human pathogens such as HIV and influenza as well as some plants and nematodes. Finally, I will discuss obligately sexual organisms, where the effect of linked selection is dominated by nearby loci on the chromosome.
The common aspect of all these models is the source of stochastic fluctuations: random associations with backgrounds of different fitness. In contrast to genetic drift, such associations persist for many generations, which amplifies their effect. In analogy to genetic drift, the fluctuations in allele frequencies through linked selection have been termed genetic draft (Gillespie, 2000). The (census) population size determines how readily adaptive mutations and combinations thereof are discovered but has little influence on coalescent properties and genetic diversity. Instead, selection determines genetic diversity and sets the time scale of coalescence. The latter should not be rebranded as as this suggests that a rescaled neutral model is an accurate description of reality. In fact, many features are qualitatively different. Negligible drift does not imply that selection is efficient and only beneficial mutations matter. On the contrary, deleterious mutations can reach high frequency through linkage to favorable backgrounds and the dynamics of genotype frequencies in the population remains very stochastic. Genealogies of samples from populations governed by draft do not follow the standard binary coalescent process. Instead coalescent processes allowing for multiple mergers seem to be appropriate approximations which capture the large and anomalous fluctuations associated with selection. Those coalescent models thus form the basis for a population genetics of rapid adaptation and serve as null-models to analyze data when Kingman’s coalescent is inappropriate. To illustrate clonal interference, draft, and genealogies in presence of selection, this review is accompanied by a collection of scripts based on FFPopSim (Zanini and Neher, 2012) at webdav.tuebingen.mpg.de/interference.
II Adaptation of large and diverse asexual populations
Evolution experiments (reviewed in Kawecki et al. (2012); Burke (2012)) have demonstrated that adaptive evolution is ubiquitous among microbes. Experiments with RNA viruses have shown that the rate of adaptation increases only slowly with the population size (Miralles et al., 1999; de Visser et al., 1999), suggesting that adaptation is limited by competition between different mutations and not by the availability of beneficial mutations. The competition between clones, also known as clonal interference, was directly observed in E. coli populations using fluorescent markers (Hegreness et al., 2006). Similar observations have been made in Rich Lenski’s experiments in which E. coli populations were followed for more that 50000 generations (Barrick et al., 2009). A different experiment selecting E. coli populations for heat tolerance has shown that there are 1000s of sites available for adaptive substitutions, that there is extensive parallelism among lines in the genes and pathways bearing mutations, and that mutations frequently interact epistatically (Tenaillon et al., 2012). By following the frequencies of microsatellite markers in populations of E. coli, Perfeito et al. (2007) estimated the beneficial mutation rate to be per genome and generation with average effects of about . Similarly, it has been shown that beneficial mutations are readily available in yeast and compete with each other in the population for fixation (Desai et al., 2007; Lang et al., 2011; Kao and Sherlock, 2008). At any given instant, the population is thus characterized by a large number of segregating clones giving rise to a broad fitness distribution (Desai et al., 2007). The fate of a novel mutation is mainly determined by the genetic background it arises on (Lang et al., 2011). Similar rapid adaptation and competition is observed in the global populations of influenza, which experience several adaptive substitutions per year (Bhatt et al., 2011; Strelkowa and Lässig, 2012; Smith et al., 2004), mainly driven by immune responses of the host. In summary, evolution of asexual microbes does not seem to be limited by finding the necessary single point mutations, but rather by overcoming clonal interference and combining multiple mutations.
These observations have triggered intense theoretical research on clonal interference and adaptation in asexuals. In the models studied, rare events, e.g. the fittest individual acquiring additional mutations, dramatically affect the future dynamics. Intuition is a poor guide in such situations and careful mathematical treatment is warranted. Nevertheless, it is often possible to rationalize the results in a simple and intuitive way with hindsight, and I will try to present the important aspects in accessible form.
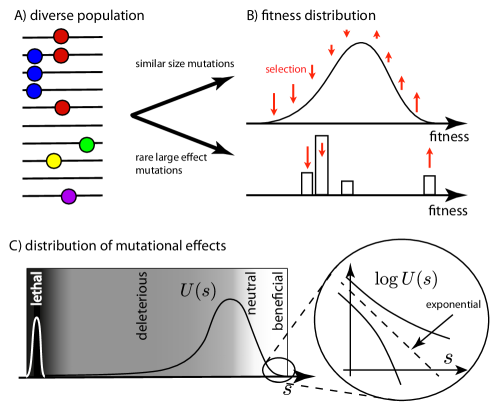
Our discussion assumes that fitness is a unique function of the genotype. Thereby, we ignore the possibility of frequency-dependent selection. A diverse population with many different genotypes can then be summarized by its distribution along this fitness-axis; see Fig. 1A&B. Fitness distributions are shaped by a balance between injection of variation via mutation and the removal of poorly adapted variants. Most mutations have detrimental effects on fitness, while only a small minority of mutations is beneficial. The distribution of mutational effects in RNA virus has been estimated by mutagenesis (Sanjuán et al., 2004; Lalić et al., 2011). Roughly half of random mutations are effectively lethal, while were found to be beneficial in this experiment. A distribution of mutational effects, , is sketched in Fig. 1C. General properties of are largely unknown and will depend on the environment.
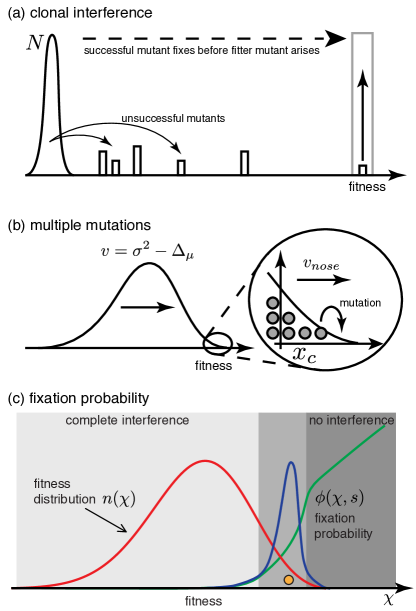
Deleterious mutations rarely reach high frequencies but are numerous, while beneficial mutations are rare but amplified by selection. But in order to spread and fix, a beneficial mutation has to arise on an already fit genetic background or have a sufficiently large effect on fitness to get ahead of everybody else. Two lines of theoretical works have put emphasis either on the large effect mutations (clonal interference theory) or “coalitions” of multiple mutations of similar effect. Both approaches, sketched in Fig. 2 are good approximations depending on the distribution of fitness effects.
II.1 Clonal Interference
Consider a homogeneous population in which mutations with effect on fitness between and arise with rate as sketched in Fig. 1C. In a large population many beneficial mutations arise every generation. In order to fix, a beneficial mutation has to outcompete all others; see Fig. 2A. In other words, a mutation fixes only if no mutation with a larger effect arises before it has reached high frequencies in the population. This is the essence of clonal interference theory by Gerrish and Lenski (1998). The Gerrish-Lenski theory of clonal interference is an approximation since it ignores the possibility that two or more mutations with moderate effects combine to outcompete a large effect mutation – a process I will discuss below. Its accuracy depends on the functional form of and the population size (Park and Krug, 2007). One central prediction of clonal interference is that the rate of adaptation increases only slowly with the population size and the beneficial mutation rate . This is a consequence of the fact that the probability that a particular mutation is successful decreases with since there are more mutations competing. This basic prediction has been confirmed in evolution experiments with virus (Miralles et al., 1999, 2000; de Visser et al., 1999). How the rate of adaptation depends on and is sensitive to the distribution of fitness effects . Generically, one finds that the rate of adaptation is , where depends on the properties of (Park et al., 2010).
Clonal interference theory places all the emphasis on the mutation with the largest effect and ignores variation in genetic background or equivalently the possibility that multiple mutations accumulate in one lineage. It is therefore expected to work if the distribution of effect sizes has a long tail allowing for mutations of widely different sizes. It fails if most mutations have similar effects on fitness. A careful discussion of the theory of clonal interference and its limitations can be found in Park et al. (2010).
II.2 Genetic background and multiple mutations
If most beneficial mutations have similar effects, a lineage cannot fix by acquiring a mutation with very large effect but has to accumulate more beneficial mutations than the competing lineages. If population sizes and mutation rates are large enough that many mutations segregate, the distribution of fitness in the population is roughly Gaussian, see Fig. 2B, and the problem becomes tractable (Tsimring et al., 1996; Rouzine et al., 2003; Desai and Fisher, 2007). More precisely, is governed by the deterministic equation
| (1) |
where accounts for amplification by selection of individuals fitter than the fitness mean and elimination of the less fit ones. The second term accounts for mutations that move individuals from to at rate . Integrating this equation over the fitness yields Fisher’s “Fundamental Theorem of Natural Selection”, which states that the rate of increase in mean fitness is
| (2) |
where is the variance in fitness and is the average mutation load a genome accumulates in one generation. A steadily moving mean fitness suggests a traveling wave solution of the form where is the fitness relative to the mean. Eq. (2) is analogous to the breeder’s equation that links the response to selection to additive variances and co-variances. In quantitative genetics, the trait variances are determined empirically and often assumed constant, while we will try to understand how is determined by a balance between selection and mutation.
To determine the average , we need an additional relation between and the mutational input. To this end, it is important to realize that the population is thinning out at higher and higher fitness and only very few individuals are expected to be present above some as sketched in Fig. 2B. The dynamics of this high fitness “nose” is very stochastic and not accurately described by Eq. (1). However, the nose is the most important part where most successful mutations arise. There have been two strategies to account for the stochastic effects and derive an additional relation for the velocity. (i) The average velocity, , of the nose is determined by a detailed study of the stochastic dynamics of the nose. At steady state, this velocity has to equal the average velocity of the mean fitness given by Eq. (2), which produces the additional relation required to determine (Tsimring et al., 1996; Rouzine et al., 2003; Cohen et al., 2005a; Desai and Fisher, 2007; Goyal et al., 2012; Brunet et al., 2008). (ii) Alternatively, assuming additivity of mutations, has to equal the average rate at which fitness increases due to fixed mutations (Neher et al., 2010; Good et al., 2012) (see (Hallatschek, 2011) for a related idea). I will largely focus on this latter approach, as it generalizes to sexual populations below. In essence, we need to calculate the probability of fixation of mutations with effect size that arise in random individuals in the population. depends on and implicitly on the traveling fitness distribution . Using this notation, we can express as the sum of effects of mutations that fix per unit time:
| (3) |
Note that the mutational input is proportional to the census population size . To solve Eq. (3), we first have to calculate the fixation probability , which in turn is a weighted average of the fixation probability, , given the mutation appears on a genetic background with relative fitness . The latter can be approximated by branching processes (Neher et al., 2010; Good et al., 2012). A detailed derivation of is given in the supplement of Good et al. (2012), while the subtleties associated with approximations are discussed in Fisher (2013). The qualitative features of are sketched in Fig. 2C.
The product describes the distribution of backgrounds on which successful mutations arise. This distribution is often narrowly peaked right below the high fitness nose (see Fig. 2C). Mutations on backgrounds with lower fitness are doomed, while there are very few individuals with even higher background fitness. The larger , the broader this region is.
To determine the rate of adaptation, one has to substitute the results for into Eq. (3) and solve for (Desai and Fisher, 2007; Good et al., 2012). A general consequence of the form of the self-consistency condition Eq. (3) is that if is weakly dependent on , we will find proportional to . In this case the speed of evolution is proportional to the mutational input. With increasing fitness variance, , the genetic background fitness starts to influence fixation probabilities, such that eventually increases only slowly with . For models in which beneficial mutations of fixed effect arise at rate , the rate of adaptation in large populations is given by
| (4) |
(Desai and Fisher, 2007; Cohen et al., 2005a). The above has assumed that is constant, but these expressions hold for more general models with a short-tailed distribution with suitably defined effective and (Good et al., 2012).
Synthesis
Clonal interference and multiple mutation models both predict diminishing returns as the population increases, but the underlying dynamics are rather different. In the clonal interference picture, population take-overs are driven by single mutations and the genetic background on which they occur is largely irrelevant ( depends little on ). The mutations that are successful, however, have the very largest effects. In the multiple mutation regime, the effect of the mutations is not that crucial, but they have to occur in very fit individuals to be successful ( increases rapidly with ). In both models, the speed of adaptation continues to increase slowly with the population size and there is no hard “speed limit”. Distinguishing a speed limit from diminishing returns in experiments is hard (de Visser et al., 1999; Miralles et al., 2000).
Whether one or the other picture is more appropriate depends on the distribution of available mutations . If falls off faster than exponential, adaptation occurs via many small steps (Desai and Fisher, 2007; Good et al., 2012); if the distribution is broader, the clonal interference picture is a reasonable approximation (Park and Krug, 2007; Park et al., 2010). The borderline case of an exponential fitness distribution has been investigated more closely, finding that large effect mutations on a pretty good background make the dominant contributions (Good et al., 2012; Schiffels et al., 2011), i.e., a little bit of both.
Empirical observations favor this intermediate situation. Influenza evolution has been analyzed in great detail and is was found that a few rather than a single mutation drive the fixation of a particular strain (Strelkowa and Lässig, 2012). Similarly, evolution experiments suggest that the genetic background is important, but a moderate number of large effect mutations account for most of the observed adaptation (Lang et al., 2011).
Note the somewhat unintuitive dependence of on parameters in Eq. (4). Instead of the mutational input and , depends on and for . In large populations, the dominant time scale of population turnover is goverened by selection and is of order . and measure the strength of reproduction noise (drift) and mutations relative to , respectively (see Neher and Shraiman (2012) for a discussion of this issue in the context of deleterious mutations). In large populations, the infinite sites model starts to break down and the same mutations can occur independently in several lineages limiting interference (Bollback and Huelsenbeck, 2007; Kim and Orr, 2005).
III Evolution of facultatively sexual populations
Competition between beneficial mutations in asexuals results in a slow (logarithmic) growth of the speed of adaptation with the population size (Eq. (4)). How does gradually increasing the outcrossing rate alleviate this competition? The associated advantages of sex and recombination have been studied extensively (Fisher, 1930; Muller, 1932; Crow and Kimura, 1965; Charlesworth, 1993; Rice and Chippindale, 2001). It is instructive to consider facultatively sexual organisms that outcross at rate , and in the event of outcrossing have many independently segregating loci. Facultatively sexual species are common among RNA viruses, yeasts, nematodes, and plants.
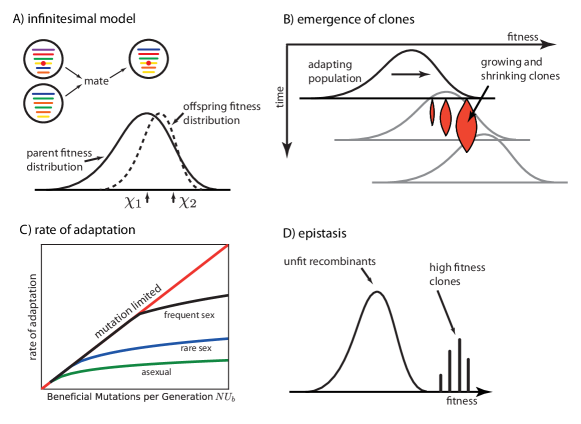
Most of our theoretical understanding of evolution in large facultatively mating populations comes from models similar to those introduced above for asexual populations. In addition to mutation, we have to introduce a term that describes how an allele can move from one genetic background to another by recombination; see Fig. 3A. Given the fitness values of the two parents and and assuming many independently segregating loci, the offspring fitness is symmetrically distributed around the mid-parent value with half the population variance; see illustration in Fig. 3A and (Bulmer, 1980; Turelli and Barton, 1994). To understand the process of fixation in such a population, the following is a useful intuition: An outcrossing event places a beneficial mutation onto a novel genotype, which is amplified by selection into a clone whose size grows rapidly with the fitness of the founder; see Fig. 3B. These clones are transient, since even an initially fit clone falls behind the increasing mean fitness. However, large clones produce many recombinant offspring (daughter clones), which greatly enhances the chance of fixation of mutations they carry. Since clone size increases rapidly with founder fitness, the fixation probability is still a very steep function of the background fitness and qualitatively similar to the asexual case (Fig. 2C). With increasing outcrossing rate, the fitness window from which successful clones originate becomes broader and broader.
If outcrossing rates are large enough that genotypes are disassembled by recombination faster than selection can amplify them, is essentially flat and the genetic background does not matter much. This transition was examined by Neher et al. (2010):
| (5) |
The essence of this result is that adaptation is limited by recombination whenever is smaller than the standard deviation in fitness in the absence of interference. In this regime, depends weakly on , but increases rapidly with . This behavior is sketched in Fig. 3C. Similar results can be found in Weissman and Barton (2012). The above analysis assumed that recombination is rare, but still frequent enough to ensure that mutations that rise to high frequencies are essentially in linkage equilibrium. This requires . Rouzine and Coffin (2005, 2010) studied the selection on standing variation at intermediate and low recombination rates. Adaptation in presence of horizontal gene transfer was investigated by Cohen et al. (2005b), Wylie et al. (2010), and Neher et al. (2010).
In contrast to asexual evolution, epistasis can dramatically affect the evolutionary dynamics in sexual populations. Epistasis implies that the effect of mutations depends on the state at other loci in the genome. In the absence of sex, the only quantity that matters is the distribution of available mutations, . The precise nature of epistasis is not crucial. In sexual populations, however, epistasis can affect the evolutionary dynamics dramatically: When different individuals mix their genomes, it matters whether mutations acquired in different lineages are compatible. Since selection favors well adapted combinations of alleles, recombination is expected to be on average disruptive and recombinant offspring have on average lower fitness than their parents (the so-called “recombination load”). This competition between selection for good genotypes and recombination can result in a condensation of the population into fit clones; see Fig. 3D, Neher and Shraiman (2009) and Neher et al. (2013).
IV Selective interference in obligately sexual organisms
Selective interference has historically received most attention in obligately sexual organisms most relevant to crop and animal breeding. Artificial selection has been performed by farmers and breeders for thousands of years with remarkable success (Hill and Kirkpatrick, 2010). Evolution experiments with diverse species, including chicken, mice and Drosophila, have shown that standing variation at a large number of loci responds to diverse selection pressures (Chan et al., 2012; Burke et al., 2010; Turner et al., 2011; Zhou et al., 2011; Johansson et al., 2010); see Burke (2012) for a recent review. In obligately sexual populations, distant loci can respond independently to selection and remain in approximate linkage equilibrium. The frequencies of different alleles change according to their effect on fitness averaged over all possible fitness backgrounds in the population. Small deviations from linkage equilibrium can be accounted for perturbatively using the so-called Quasi-Linkage Equilibrium (QLE) approximation Kimura (1965); Barton and Turelli (1991); Neher and Shraiman (2011a).
This approximate independence, however, does not hold for loci that are tightly linked. Hill and Robertson (1966) observed that interference between linked competing loci can slow down the response to selection – an effect now termed Hill-Robertson interference (Felsenstein, 1974). Felsenstein realized that interference is not restricted to competing beneficial mutations but that linked deleterious mutations also impede fixation of beneficial mutations (see background selection below). The term Hill-Robertson interference is now used for any reduction in the efficacy of selection caused by linked fitness variation. A deeper understanding of selective interference was gained in the 1990ies (Barton, 1994, 1995b). The key insight of Barton was to calculate the fate of a novel mutation considering all possible genetic backgrounds on which it can arise and summing over all possible trajectories it can take through the population. For a small number of loci, the equations describing the probability of fixation can be integrated explicitly.
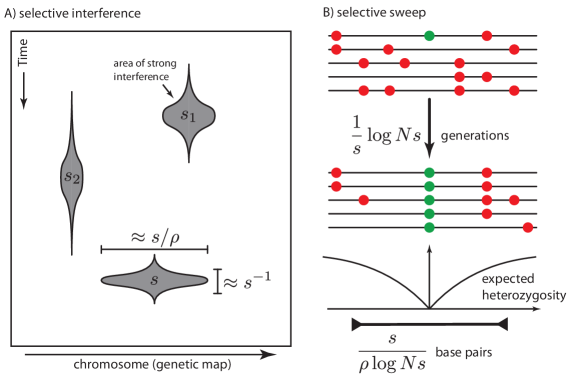
Weakly-linked sweeps cause a cumulative reduction of the fixation probability at a focal site that is roughly given by the ratio of additive variance in fitness and the squared degree of linkage (Barton, 1995b; Santiago and Caballero, 1998). Barton (1994) further identified a critical rate of strong selective sweeps that effectively prevents the fixation of mutations with an advantage smaller than . If sweeps are too frequent, the weakly selected mutation has little chance of spreading before its frequency is reduced again by the next strong sweep.
At short distances, selective sweeps impede each other’s fixation more strongly. This interference is limited to a time interval of order generations where one of the sweeping mutations is at intermediate frequencies. During this time, a new beneficial mutation will often fall onto the wildtype background and is lost again if it is not rapidly recombined onto the competing sweep. The latter is likely only if it is further than nucleotides away from the competing sweep, where is the crossover rate per basepair (Barton, 1994). In other words, a sweeping mutation with effect prevents other sweeps in a region of width , and occupies this chromosomal “real estate” for a time ; see Fig. 4A (Weissman and Barton, 2012). Hence strong sweeps briefly interfere with other sweeps in a large region, while weak sweeps affect a narrow region for a longer time. The amount of interference is therefore roughly independent of the strength of the sweeps, and the total number of sweeps per unit time is limited by the map-length , where the integral is over the entire genome and is the local crossover rate. Larger populations can squeeze slightly more sweeps into (Weissman and Barton, 2012). In most obligately sexual organisms, sweeps rarely cover more than a few percent of the total map length such that recombination is not limiting adaptation unless sweeps cluster in certain regions (Sella et al., 2009). However, as I will discuss below, even rare selective sweeps have dramatic effects on neutral diversity.
V Genetic diversity, draft, and coalescence
Interference between selected mutations reduces the fixation probability of beneficial mutations, slows adaptation, and weakens purifying selection. These effects are very important, but hard to observe since significant adaptation often takes longer than our window of observation. Typically, data consists of a sample of sequences from a population. These sequences differ by single nucleotide polymorphisms, insertions, or deletions, and we rarely know the effect of these differences on the organism’s fitness.
From a sequence sample of this sort, the genealogy of the population is reconstructed and compared to models of evolution – in most cases a neutral model governed by Kingman’s coalescent (Kingman, 1982). From this comparison we hope to learn about evolutionary processes. However, linked selection, be it in asexual organisms, facultatively sexuals, or obligately sexuals, has dramatic effects on the genealogies. Substantial effects on neutral diversity are observed at rates of sweeps that do not yet cause strong interference between selected loci for the simple reason that neutral alleles segregate for longer times (Weissman and Barton, 2012).
V.1 Genetic draft in obligately sexual populations
Selective sweeps have strong effects on linked neutral diversity and genealogies (Maynard Smith and Haigh, 1974; Kaplan et al., 1989; Stephan et al., 1992; Wiehe and Stephan, 1993; Barton, 1998; Barton and Etheridge, 2004). A sweeping mutation takes about generations to rise to high frequency. Linked neutral variation is preserved only when substantial recombination happens during this time. Given a crossover rate per base, recombination will separate the sweep from a locus at distance with probability per generation (assuming ). Hence a sweep leaves a dip of width in the neutral diversity (see Fig. 4B). Within this region, selection causes massive and rapid coalescence and only a fraction of the lineages continue into the ancestral population (see Fig. 5A). This effect has been further investigated by Durrett and Schweinsberg (2005), who showed that the effect of recurrent selective sweeps is well approximated by a coalescent process that allows for multiple mergers: each sweep forces the almost simultaneous coalescence of a large number of lineages (a fraction ). Similar arguments had been made previously by Gillespie (2000), who called the stochastic force responsible for coalescence genetic draft. Coop and Ralph (2012) extended the analysis of Durret and Schweinsberg partial sweeps that could be common in structured populations, with over-dominance, or frequency dependent selection.
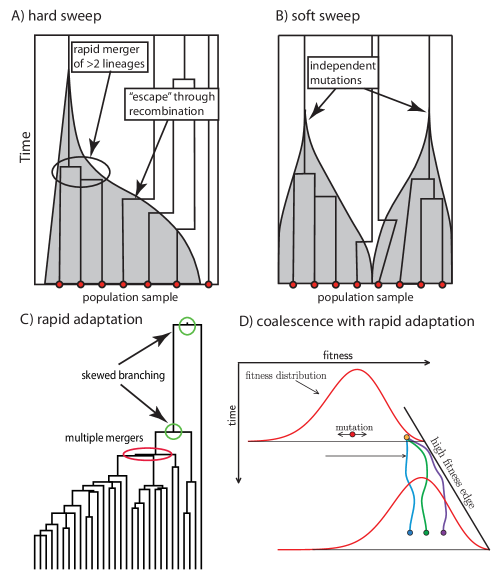
The rapid coalescence of multiple lineages is unexpected in the standard neutral coalescent (a merger of lineages occurs with probability ). In coalescence induced by a selective sweep, however, multiple mergers are common and dramatically change the statistical properties of genealogies. A burst of coalescence corresponds to a portion of the tree with almost star-like shape (Slatkin and Hudson, 1991). Alleles that arose before the burst are common, those after the burst rare. This causes a relative increase of rare alleles, as well as alleles very close to fixation (Braverman et al., 1995; Fay and Wu, 2000; Gillespie, 2000).
The degree to which linked selective sweeps reduce genetic diversity depends primarily on the rate of sweeps per map length (Weissman and Barton, 2012). In accord with this expectation, it is found that diversity increases with recombination rate and decreases with the density of functional sites (Begun et al., 2007; Shapiro et al., 2007). In addition to occasional selective sweeps, genetic diversity and the degree of adaptation can be strongly affected by a large number of weakly selected sites, e.g. weakly deleterious mutations, that generate a broad fitness distribution (McVean and Charlesworth, 2000).
V.2 Soft sweeps
Soft sweeps refer to events when a selective sweep originates from multiple genomic backgrounds (Hermisson and Pennings, 2005; Pennings and Hermisson, 2006), either because the favored allele arose independently multiple times or because it has been segregating for a long time prior to a environmental change. Soft sweeps have recently been observed in pesticide resistance of Drosophila (Karasov et al., 2010) and are a common phenomenon in viruses with high mutation rates.
A genealogy of individuals sampled after a soft sweep is illustrated in Fig. 5B. The majority of the individuals trace back to one of two or more ancestral haplotypes on which the selected mutation arose. Hence coalescence is again dominated by multiple merger events, except that several of those events happen almost simultaneously. This type of coalescent process has been described in Schweinsberg (2000).
Despite dramatic effects on genealogies, soft sweeps can be difficult to detect by standard methods that scan for selective sweeps. Those methods use local reductions in genetic diversity, which can be modest if the population traces back to several ancestral haplotypes. The number of ancestral haplotypes in a sample after a soft sweep depends on the product of , the per-site mutations rate , and selection against the allele before the sweep (Pennings and Hermisson, 2006). To detect soft sweeps, methods are required that explicitly search for signatures of rapid coalescence into several lineages in linkage disequilibrium or haplotype patterns (Pennings and Hermisson, 2006; Messer and Neher, 2012).
V.3 The Bolthausen-Sznitman coalescent and rapidly adapting populations
Individual selective sweeps have an intuitive effect on genetic diversity, but what do genealogies look like when many mutations are competing in asexual or facultatively sexual populations? It has recently been argued that the genealogies of populations in many models of rapid adaptation are well described by coalescent processes with multiple mergers (Pitman, 1999; Berestycki, 2009). This was first discovered by Brunet et al. (2007), who studied a model where a population expands its range. The genealogies of individuals at the front are described by the Bolthausen-Sznitman coalescent, a special case of coalescent processes with multiple mergers. Recently, it has been shown that a similar coalescent process emerges in models of adaptation in panmictic populations (Neher and Hallatschek, 2013; Desai et al., 2012).
Fig. 5C shows a tree sampled from a model of a rapidly adapting population. A typical sample from a rapidly adapting population will consist of individuals from the center of the fitness distribution. Their ancestors tend to be among the fittest in the population (Rouzine and Coffin, 2007; Hermisson et al., 2002). Substantial coalescence happens only once the ancestral lineages have reached the high fitness tip, resulting in long terminal branches of the trees. Once in the tip, coalescence is driven by the competition of lineages against each other and happens in bursts whenever one lineage gets ahead of everybody else. These bursts correspond to the event that a large fraction of the population descends from one particular individual. These coalescent events have approximately the same statistics as neutral coalescent processes with very broad but non-heritable offspring distributions (Eldon and Wakeley, 2006; Schweinsberg, 2003; Der et al., 2011).
In the case of rapidly adapting asexual populations, the effective distribution of the number of offspring is given by which gives rise to the Bolthausen-Sznitman coalescent. This type of distribution seems to be universal to populations in which individual lineages are amplified while they diversify and is found in facultatively sexual populations (Neher and Shraiman, 2011b), asexual populations adapting by small steps, as well as populations in a dynamic balance between deleterious and beneficial mutations. Asymptotic features of the site frequency spectrum can be derived analytically (Berestycki, 2009; Neher and Hallatschek, 2013; Desai et al., 2012). One finds that the frequency spectrum diverges as at low frequencies corresponding to many singletons. Furthermore, neutral alleles close to fixation are common with diverging again as . This relative excess of rare and very common alleles is a consequence multiple mergers which produce star-like sub-trees and the very asymmetric branching at nodes deep in the tree (compare Fig. 5C).
The time scale of coalescence, and with it the level of genetic diversity, is mostly determined by the strength of selection and only weakly increases with population size. Essentially, the average time to a common ancestor of two randomly chosen individuals is given by the time it takes until the fittest individuals dominate the population. In most models, this time depends only logarithmically on the population size .
V.4 Background selection and genetic diversity
Background selection refers to the effect of purifying selection on linked loci, which is particularly important if linked regions are long. If deleterious mutations incur a fitness decrement of and arise with genome wide rate , a sufficiently large population settles in a state where the number of mutations in individuals follows a Poisson distribution with mean (Haigh, 1978). Individuals loaded with many mutations are selected against, but continually produced by de novo mutations. All individuals in the population ultimately descent from individuals carrying least deleterious mutations. Within this model, the least loaded class has size and coalescence in this class is accelerated by compared to a neutrally evolving population of size (Charlesworth et al., 1993). For large ratios , the Poisson distribution of background fitness spans a large number of fitness classes and this heterogeneity substantially reduces the efficacy of selection (McVean and Charlesworth, 2000).
The effect of background selection is best appreciated in a genealogical picture. Genetic backgrounds sampled from the population tend to come from the center of the distribution. Since the deleterious mutations they carry were accumulated in the recent past, lineages “shed” mutations as we trace them back in time until they arrive in the mutation free class akin to Fig. 5D. This resulting genealogical process, a fitness class coalescent, has been described in Walczak et al. (2012). A recent study on the genetic diversity of whale lice (Seger et al., 2010) suggests that purifying selection and frequent deleterious mutations can severely distort genealogies. O’Fallon et al. (2010) present methods for the analysis of sequence samples under purifying selection.
The fitness class coalescent is appropriate as long as Muller’s ratchet does not yet click. More generally, fixation of deleterious mutations, adaptation, and environmental change will balance approximately. It has been shown that a small fraction of beneficial mutations can be sufficient to halt Muller’s ratchet (Goyal et al., 2012). In this dynamic balance between frequent deleterious and rare beneficial mutations, the genealogies tend to be similar to genealogies under rapid adaptation discussed above.
VI Conclusions and future directions
Contradicting neutral theory, genetic diversity correlates only weakly with population size (Leffler et al., 2012), suggesting that linked selection or genetic draft are more important than conventional genetic drift. Draft is most severe in asexual populations, for which models predict that the fitness differences rather than the population size determine the level of neutral diversity. As outcrossing becomes more frequent, the strength of draft decreases and diversity increases. With increasing coalescence times, selection becomes more efficient as there is more time to differentiate deleterious from beneficial alleles. In obligately sexual populations, most interference is restricted to tightly linked loci and the number of sweeps per map length and generation determines genetic diversity.
Since interference slows adaptation, one expects that adaptation can select for higher recombination rates (Charlesworth, 1993). Indeed, positive selection results in indirect selection on recombination modifiers (Barton, 1995a; Otto and Barton, 1997; Barton and Otto, 2005; Hartfield et al., 2010). Changing frequencies of outcrossing have been observed in evolution experiments (Becks and Agrawal, 2010). However, the evolution of recombination and outcrossing rates in rapidly adapting populations remains poorly understood, both theoretically and empirically.
The traveling wave models discussed above assume a large number of polymorphisms with similar effects on fitness and a smooth fitness distribution, which are drastic idealizations. More typically, one finds a handful of polymorphisms with a distribution of effects (Barrick et al., 2009; Lang et al., 2011; Strelkowa and Lässig, 2012). Simulations indicate, however, that statistical properties of genealogies are rather robust regarding model assumptions as long as draft dominates over drift (Neher and Hallatschek, 2013). Appropriate genealogical models are prerequisite for demographic inference. If, for example, a neutral coalescent model is used to infer the population size history of a rapidly adapting population, one would conclude that the population has been expanding. Incidentally, this is inferred in most cases. Some progress towards incorporating the effect of purifying selection into estimates from reconstructed genealogies has been made recently (O’Fallon, 2011; Nicolaisen and Desai, 2012). Alternative genealogical models accounting for selection should be included into popular analysis programs such as BEAST (Drummond and Rambaut, 2007).
It is still common to assign an “effective” size, , to various populations. In most cases, is a proxy for genetic diversity, which depends on the time to the most recent common ancestor. With the realization that coalescence times depend on linked selection and genetic draft, rather than the population size and genetic drift, the term should be avoided and replaced by , the time scale of coalescence. Defining suggests that the neutral model is valid as long as is used instead of . We have seen multiple times that drift and draft are of rather different natures and that this difference cannot be captured by a simple rescaling. Each quantity then requires its own private , rendering the concept essentially useless. Some quantities like site frequency spectra are qualitatively different and no maps them to a neutral model. The (census) population size is nevertheless important in discovering beneficial mutations. For this reason, large populations are expect to respond more quickly to environmental change as we are painfully aware in the case of antibiotic resistance of pathogens. Large populations might therefore track phenotypic optima more closely resulting in beneficial mutations with smaller effect, which in turn might explain their greater diversity.
The majority of models discussed assume a time invariant fitness landscape. This assumption reflects our ignorance regarding the degree and timescale of environmental fluctuations (for work on selection in time-dependent fitness landscapes, see Mustonen and Lässig (2009)). Time-variable selection pressures, combined with spatial variation, could potentially have strong effects. Similarly, frequency-dependent selection and more generally the interaction of evolution with ecology are important avenues for future work. The challenge consists of choosing useful models that are tractable, appropriate, and predictive.
Acknowledgements.
I would like to thank Boris Shraiman, Sally Otto, Frank Chan, Philipp Messer, Aleksandra Walczak and Michael Desai for stimulating discussions and helpful comments on the manuscript. This work is supported by the ERC starting grant HIVEVO 260686.References
- Barrick et al. (2009) Barrick, J. E., D. S. Yu, S. H. Yoon, H. Jeong, T. K. Oh, D. Schneider, R. E. Lenski, and J. F. Kim, 2009, Nature 461(7268), 1243.
- Barton (1994) Barton, N., 1994, Genet Res 64(03), 199.
- Barton (1998) Barton, N., 1998, Genet Res 72(02), 123.
- Barton (1995a) Barton, N. H., 1995a, Genet Res 65(2), 123.
- Barton (1995b) Barton, N. H., 1995b, Genetics 140(2), 821.
- Barton and Etheridge (2004) Barton, N. H., and A. M. Etheridge, 2004, Genetics 166(2), 1115.
- Barton and Otto (2005) Barton, N. H., and S. P. Otto, 2005, Genetics 169(4), 2353.
- Barton and Turelli (1991) Barton, N. H., and M. Turelli, 1991, Genetics 127(1), 229.
- Becks and Agrawal (2010) Becks, L., and A. F. Agrawal, 2010, Nature 468(7320), 89.
- Begun et al. (2007) Begun, D. J., A. K. Holloway, K. Stevens, L. W. Hillier, Y.-P. Poh, M. W. Hahn, P. M. Nista, C. D. Jones, A. D. Kern, C. N. Dewey, L. Pachter, E. Myers, et al., 2007, PLoS Biol 5(11), 2534.
- Berestycki (2009) Berestycki, N., 2009, ENSAIOS MATEMÁTICOS 16, 1.
- Bhatt et al. (2011) Bhatt, S., E. C. Holmes, and O. G. Pybus, 2011, Molecular Biology and Evolution 28(9), 2443.
- Bollback and Huelsenbeck (2007) Bollback, J. P., and J. P. Huelsenbeck, 2007, Molecular Biology and Evolution 24(6), 1397.
- Braverman et al. (1995) Braverman, J. M., R. R. Hudson, N. L. Kaplan, C. H. Langley, and W. Stephan, 1995, Genetics 140(2), 783.
- Brunet et al. (2007) Brunet, E., B. Derrida, A. H. Mueller, and S. Munier, 2007, Physical review E, Statistical, nonlinear, and soft matter physics 76(4 Pt 1), 041104.
- Brunet et al. (2008) Brunet, E., I. Rouzine, and C. Wilke, 2008, Genetics 179(1), 603.
- Bulmer (1980) Bulmer, M. G., 1980, The Mathematical Theory of Quantitative Genetics (Oxford University Press, Oxford).
- Burke (2012) Burke, M. K., 2012, Proceedings of the Royal Society B: Biological Sciences 279(1749), 5029.
- Burke et al. (2010) Burke, M. K., J. P. Dunham, P. Shahrestani, K. R. Thornton, M. R. Rose, and A. D. Long, 2010, Nature 467(7315), 587.
- Chan et al. (2012) Chan, Y. F., F. C. Jones, E. McConnell, J. Bryk, L. Bünger, and D. Tautz, 2012, Curr Biol 22(9), 794.
- Charlesworth (1993) Charlesworth, B., 1993, Genet Res 61(3), 205.
- Charlesworth (2012) Charlesworth, B., 2012, Genetics 190, 5.
- Charlesworth et al. (1993) Charlesworth, B., M. T. Morgan, and D. Charlesworth, 1993, Genetics 134(4), 1289.
- Cohen et al. (2005a) Cohen, E., D. A. Kessler, and H. Levine, 2005a, Phys Rev E Stat Nonlin Soft Matter Phys 72(6 Pt 2), 066126.
- Cohen et al. (2005b) Cohen, E., D. A. Kessler, and H. Levine, 2005b, Phys Rev Lett 94(9), 098102.
- Coop and Ralph (2012) Coop, G., and P. L. Ralph, 2012, Genetics .
- Crow and Kimura (1965) Crow, J., and M. Kimura, 1965, The American Naturalist 99(909), 439.
- Der et al. (2011) Der, R., C. L. Epstein, and J. B. Plotkin, 2011, Theor Popul Biol 80(2), 80.
- Desai and Fisher (2007) Desai, M. M., and D. S. Fisher, 2007, Genetics 176(3), 1759.
- Desai et al. (2007) Desai, M. M., D. S. Fisher, and A. W. Murray, 2007, Curr Biol 17(5), 385.
- Desai et al. (2012) Desai, M. M., A. M. Walczak, and D. S. Fisher, 2012, Genetics .
- Drummond and Rambaut (2007) Drummond, A., and A. Rambaut, 2007, BMC Evol Biol 7(1), 214.
- Durrett and Schweinsberg (2005) Durrett, R., and J. Schweinsberg, 2005, Stochastic Process. Appl. 115(10), 1628.
- Eldon and Wakeley (2006) Eldon, B., and J. Wakeley, 2006, Genetics 172(4), 2621.
- Fay and Wu (2000) Fay, J. C., and C. I. Wu, 2000, Genetics 155(3), 1405.
- Felsenstein (1974) Felsenstein, J., 1974, Genetics 78(2), 737.
- Fisher (2013) Fisher, D. S., 2013, Journal of Statistical Mechanics: Theory and Experiment 2013(01), P01011.
- Fisher (1930) Fisher, R. A., 1930, The Genetical Theory of Natural Selection (Clarendon).
- Gerrish and Lenski (1998) Gerrish, P. J., and R. E. Lenski, 1998, Genetica 102-103(1-6), 127.
- Gillespie (2000) Gillespie, J. H., 2000, Genetics 155(2), 909.
- Good et al. (2012) Good, B. H., I. M. Rouzine, D. J. Balick, O. Hallatschek, and M. M. Desai, 2012, Proc Natl Acad Sci USA 109(13), 4950.
- Goyal et al. (2012) Goyal, S., D. J. Balick, E. R. Jerison, R. A. Neher, B. I. Shraiman, and M. M. Desai, 2012, Genetics 191, 1309.
- Haigh (1978) Haigh, J., 1978, Theoretical Population Biology 14(2), 251.
- Hallatschek (2011) Hallatschek, O., 2011, Proceedings of the National Academy of Sciences of the United States of America 108(5), 1783.
- Hartfield et al. (2010) Hartfield, M., S. Otto, and P. Keightley, 2010, Genetics 184(4), 1153.
- Hegreness et al. (2006) Hegreness, M., N. Shoresh, D. Hartl, and R. Kishony, 2006, Science 311(5767), 1615.
- Hermisson and Pennings (2005) Hermisson, J., and P. Pennings, 2005, Genetics 169(4), 2335, 10.1534/genetics.104.036947.
- Hermisson et al. (2002) Hermisson, J., O. Redner, H. Wagner, and E. Baake, 2002, Theoretical population biology 62(1), 9.
- Hill and Kirkpatrick (2010) Hill, W. G., and M. Kirkpatrick, 2010, Annual Review of Ecology, Evolution, and Systematics 41, 1.
- Hill and Robertson (1966) Hill, W. G., and A. Robertson, 1966, Genet Res 8(3), 269.
- Johansson et al. (2010) Johansson, A. M., M. E. Pettersson, P. B. Siegel, and O. Carlborg, 2010, PLoS Genet 6(11), e1001188.
- Kao and Sherlock (2008) Kao, K. C., and G. Sherlock, 2008, Nat Genet 40(12), 1499.
- Kaplan et al. (1989) Kaplan, N. L., R. R. Hudson, and C. H. Langley, 1989, Genetics 123(4), 887.
- Karasov et al. (2010) Karasov, T., P. W. Messer, and D. A. Petrov, 2010, PLoS Genet 6(6), 1000924.
- Kawecki et al. (2012) Kawecki, T. J., R. E. Lenski, D. Ebert, B. Hollis, I. Olivieri, and M. C. Whitlock, 2012, Trends in Ecology & Evolution 27(10), 547.
- Kim and Orr (2005) Kim, Y., and H. A. Orr, 2005, Genetics 171(3), 1377.
- Kimura (1964) Kimura, M., 1964, Journal of Applied Probability 1(2), 177.
- Kimura (1965) Kimura, M., 1965, Genetics 52(5), 875.
- Kingman (1982) Kingman, J., 1982, Journal of Applied Probability 19A, 27.
- Labbé et al. (2007) Labbé, P., A. Berthomieu, C. Berticat, H. Alout, M. Raymond, T. Lenormand, and M. Weill, 2007, Molecular Biology and Evolution 24(4), 1056.
- Lalić et al. (2011) Lalić, J., J. M. Cuevas, and S. F. Elena, 2011, PLoS Genet 7(11), e1002378.
- Lang et al. (2011) Lang, G. I., D. Botstein, and M. M. Desai, 2011, Genetics .
- Leffler et al. (2012) Leffler, E. M., K. Bullaughey, D. R. Matute, W. K. Meyer, L. Ségurel, A. Venkat, P. Andolfatto, and M. Przeworski, 2012, PLoS Biol 10(9), e1001388.
- Lewontin (1974) Lewontin, R. C., 1974, The genetic basis of evolutionary change (Columbia University Press).
- Maynard Smith and Haigh (1974) Maynard Smith, J., and J. Haigh, 1974, Genet Res 23(1), 23.
- McVean and Charlesworth (2000) McVean, G. A., and B. Charlesworth, 2000, Genetics 155(2), 929.
- Messer and Neher (2012) Messer, P. W., and R. A. Neher, 2012, Genetics 191, 593.
- Miralles et al. (1999) Miralles, R., P. J. Gerrish, A. Moya, and S. F. Elena, 1999, Science 285(5434), 1745.
- Miralles et al. (2000) Miralles, R., A. Moya, and S. F. Elena, 2000, J Virol 74(8), 3566.
- Muller (1932) Muller, H. J., 1932, The American Naturalist 66(703), 118.
- Mustonen and Lässig (2009) Mustonen, V., and M. Lässig, 2009, Trends Genet 25(3), 111.
- Neher and Shraiman (2011a) Neher, R., and B. Shraiman, 2011a, Rev. Mod. Phys. 83(4), 1283.
- Neher and Hallatschek (2013) Neher, R. A., and O. Hallatschek, 2013, Proceedings of the National Academy of Sciences 110(2), 437.
- Neher and Shraiman (2009) Neher, R. A., and B. I. Shraiman, 2009, Proc Natl Acad Sci USA 106, 6866.
- Neher and Shraiman (2011b) Neher, R. A., and B. I. Shraiman, 2011b, Genetics 188, 975.
- Neher and Shraiman (2012) Neher, R. A., and B. I. Shraiman, 2012, Genetics 191, 1283.
- Neher et al. (2010) Neher, R. A., B. I. Shraiman, and D. S. Fisher, 2010, Genetics 184, 467.
- Neher et al. (2013) Neher, R. A., M. Vucelja, M. Mezard, and B. I. Shraiman, 2013, Journal of Statistical Mechanics: Theory and Experiment 2013(01), P01008.
- Nicolaisen and Desai (2012) Nicolaisen, L. E., and M. M. Desai, 2012, Molecular Biology and Evolution 29(11), 3589.
- O’Fallon (2011) O’Fallon, B. D., 2011, Molecular Biology and Evolution 28(11), 3171.
- O’Fallon et al. (2010) O’Fallon, B. D., J. Seger, and F. R. Adler, 2010, Molecular Biology and Evolution 27(5), 1162.
- Otto and Barton (1997) Otto, S. P., and N. H. Barton, 1997, Genetics 147(2), 879.
- Park and Krug (2007) Park, S., and J. Krug, 2007, Proc Natl Acad Sci USA .
- Park et al. (2010) Park, S.-C., S. Damien, and K. Joachim, 2010, J. Stat. Phys. 138, 381.
- Pennings and Hermisson (2006) Pennings, P. S., and J. Hermisson, 2006, PLoS Genet 2(12), e186.
- Perfeito et al. (2007) Perfeito, L., L. Fernandes, C. Mota, and I. Gordo, 2007, Science 317(5839), 813.
- Pitman (1999) Pitman, J., 1999, Ann. Probab. 27(4), 1870.
- Rice and Chippindale (2001) Rice, W. R., and A. K. Chippindale, 2001, Science 294(5542), 555.
- Rouzine and Coffin (2005) Rouzine, I. M., and J. M. Coffin, 2005, Genetics 170(1), 7.
- Rouzine and Coffin (2007) Rouzine, I. M., and J. M. Coffin, 2007, Theoretical Population Biology 71(2), 239.
- Rouzine and Coffin (2010) Rouzine, I. M., and J. M. Coffin, 2010, Theoretical Population Biology 77, 189.
- Rouzine et al. (2003) Rouzine, I. M., J. Wakeley, and J. M. Coffin, 2003, Proc Natl Acad Sci USA 100(2), 587.
- Sanjuán et al. (2004) Sanjuán, R., A. Moya, and S. F. Elena, 2004, Proc Natl Acad Sci USA 101(22), 8396.
- Santiago and Caballero (1998) Santiago, E., and A. Caballero, 1998, Genetics 149(4), 2105.
- Schiffels et al. (2011) Schiffels, S., G. Szöllösi, V. Mustonen, and M. Lässig, 2011, Genetics .
- Schmidt et al. (2010) Schmidt, J. M., R. T. Good, B. Appleton, J. Sherrard, G. C. Raymant, M. R. Bogwitz, J. Martin, P. J. Daborn, M. E. Goddard, P. Batterham, and C. Robin, 2010, PLoS Genet 6(6), e1000998.
- Schweinsberg (2000) Schweinsberg, J., 2000, Electron. J. Probab. 5, Paper no. 12, 50 pp. (electronic).
- Schweinsberg (2003) Schweinsberg, J., 2003, Stochastic Process. Appl. 106(1), 107.
- Seger et al. (2010) Seger, J., W. Smith, J. Perry, J. Hunn, Z. Kaliszewska, L. Sala, L. Pozzi, V. Rowntree, and F. Adler, 2010, Genetics 184(2), 529.
- Sella et al. (2009) Sella, G., D. A. Petrov, M. Przeworski, and P. Andolfatto, 2009, PLoS Genet 5(6), e1000495.
- Shapiro et al. (2007) Shapiro, J. A., W. Huang, C. Zhang, M. J. Hubisz, J. Lu, D. A. Turissini, S. Fang, H.-Y. Wang, R. R. Hudson, R. Nielsen, Z. Chen, and C.-I. Wu, 2007, Proceedings of the National Academy of Sciences 104(7), 2271.
- Slatkin and Hudson (1991) Slatkin, M., and R. R. Hudson, 1991, Genetics 129(2), 555.
- Smith et al. (2004) Smith, D. J., A. S. Lapedes, J. C. de Jong, T. M. Bestebroer, G. F. Rimmelzwaan, A. D. M. E. Osterhaus, and R. A. M. Fouchier, 2004, Science 305(5682), 371.
- Stephan et al. (1992) Stephan, W., T. H. E. Wiehe, and M. W. Lenz, 1992, Theoretical Population Biology 41(2), 237.
- Strelkowa and Lässig (2012) Strelkowa, N., and M. Lässig, 2012, Genetics .
- Tenaillon et al. (2012) Tenaillon, O., A. Rodríguez-Verdugo, R. L. Gaut, P. McDonald, A. F. Bennett, A. D. Long, and B. S. Gaut, 2012, Science 335(6067), 457.
- Tsimring et al. (1996) Tsimring, L., H. Levine, and D. Kessler, 1996, Phys Rev Lett 76(23), 4440.
- Turelli and Barton (1994) Turelli, M., and N. H. Barton, 1994, Genetics 138(3), 913.
- Turner et al. (2011) Turner, T. L., A. D. Stewart, A. T. Fields, W. R. Rice, and A. M. Tarone, 2011, PLoS Genet 7(3), e1001336.
- de Visser et al. (1999) de Visser, J. A. G. M., C. W. Zeyl, P. J. Gerrish, J. L. Blanchard, and R. E. Lenski, 1999, Science 283(5400), 404.
- Walczak et al. (2012) Walczak, A. M., L. E. Nicolaisen, J. B. Plotkin, and M. M. Desai, 2012, Genetics 190, 753.
- Weissman and Barton (2012) Weissman, D. B., and N. H. Barton, 2012, PLoS Genet 8(6), e1002740.
- Wiehe and Stephan (1993) Wiehe, T. H., and W. Stephan, 1993, Mol Biol Evol 10(4), 842.
- Wylie et al. (2010) Wylie, C. S., A. D. Trout, D. A. Kessler, and H. Levine, 2010, PLoS Genet 6(9).
- Zanini and Neher (2012) Zanini, F., and R. A. Neher, 2012, Bioinformatics 28(24), 3332.
- Zhou et al. (2011) Zhou, D., N. Udpa, M. Gersten, D. W. Visk, A. Bashir, J. Xue, K. A. Frazer, J. W. Posakony, S. Subramaniam, V. Bafna, and G. G. Haddad, 2011, Proceedings of the National Academy of Sciences 108(6), 2349.
Appendix A Glossary
-
•
Genetic drift: stochastic changes in allele frequencies due to non-heritable variation in offspring number.
-
•
Purifying selection: selection against deleterious mutations.
-
•
Positive selection : selection for novel beneficial mutations.
-
•
Genetic draft: changes in allele frequencies due to (partly) heritable random associations with genetic backgrounds.
-
•
Hitchhiking: rapid rise in frequency through an association with a very fit background.
-
•
Selective interference: reduction of fixation probability through competition with other beneficial alleles.
-
•
Clonal interference: competition between well adapted asexual subpopulations from which only one subpopulation emerges as winner.
-
•
Branching process: stochastic model of reproducing and dying individuals without a constraint on the overall population size.
-
•
Epistasis: background dependence of the effect of mutations. Epistasis can result in rugged fitness landscapes.
-
•
Kingman coalescent: basic coalescence process where random pairs of individuals merge.
-
•
Multiple merger coalescent: coalescent process with simultaneous merging of more than 2 lineages.
-
•
Bolthausen-Sznitman Coalescent (BSC): special multiple merger coalescent which approximates genealogies in many models of adaptation.