Stability of the photon indices in Z-source GX 340+0 for spectral states
Abstract
We show an analysis of the spectral and timing properties of X-ray radiation from Z-source GX 340+0 during its evolutions when the electron temperature of the Transition Layer (TL) monotonically decreases from 21 to 3 keV. We analyze episodes observed with the BeppoSAX and Rossi X-ray Timing Explorer (RXTE). We reveal that the X-ray broad-band energy spectra during all spectral states can be reproduced by a physical model, composed of a soft component, two Comptonized components (both due to the presence of that TL that up-scatters both seed photons of 1 keV coming from the disk (first component Comptb1), and seed photons of temperature 1.5 keV coming from the neutron star (second component Comptb2) and the iron-line (Gaussian) component. Spectral analysis using this model indicates that the photon power-law indices and of the Comptonized components are almost constant, and when changes from 3 to 21 keV along Z-track. We interpret the detected quasi-stability of the indices of Comptonized components near a value of 2. Furthermore, this index stability now found for the Comptonized spectral components of source GX 340+0 is similar to that was previously established in the sources 4U 1728-34, GX 3+1 and early proposed for a number of X-ray neutron stars (NSs). This behavior of NSs both for and Z-sources, is essentially different from that observed in black hole binaries where increases during a spectral evolution from the low state to the high state and ultimately saturates at high mass accretion rate.
1 Introduction
The study of binaries hosting neutron stars (NSs) allows one to investigate properties of compact objects themselves and to better understand the differences between black hole (BH) and NS systems. Low-mass X-ray binaries (LMXBs) including weakly magnetized neutron stars may be observationally divided into two main sub-classes, so called Z and sources, based upon correlations between their spectral and timing properties during state evolution in X-ray wavelengths (Hasinger & van der Klis 1989). The similarity and differences between and Z sources are clear visible on the color-color diagram (CCD) or hardness-intensity diagram (HID) and determined by their timing properties.
The Z-shaped track shown by Z-sources in the CCD or HID consist of three branches: the horizontal, the normal and the flaring branches (HB, NB and FB respectively). Note the aforementioned names are merely historical [see e.g. van der Klis (1989)] and were based on the fact that, in the first few sources studied, the horizontal branch appeared as a horizontally oriented limb in the HIDs, the normal branch as a state in which the sources pass most of their time, while in the flaring branch the sources demonstrated intensive flares. In turn, sources showed two kinds of branches: a banana shaped branch and an island state. Note that sources usually show their pattern over a larger extent of luminosity and on longer time scales (weeks - month) than that of Z-sources (hours - weeks). sources always follow banana branch on the same short time scale as Z-sources, hours - weeks (Muno et al., 2002).
The occurrence of the different X-ray states of the Z-sources and the atoll sources is presumably governed by mass accretion rate in their innermost parts of the source. In the Z-sources this mass accretion rate increases from HB, through NB, to FB (Hasinger et al. 1990, Vrtilek et al. 1990). On the other hand in the atoll sources mass accretion rate increases from the island state, through the lower banana to the upper banana (see e.g. Corbet et al. 1989; Di Salvo et al., 2001). Hasinger & van der Klis (1989) showed that each state has a characteristic fast timing variability, and therefore an extra diagnostic is available to identify a source state, and to distinguish the Z-sources from the atoll sources. In fact, only a combined diagnostic including fast timing and spectral analysis (such as CCDs) can provide reliable identification of the source (Z or ) type .
The division of the bright LMXBs into Z and atoll sources was proposed because of differences in both magnetic fields and mass accretion rate (Hasinger & van der Klis 1989). In fact, for Z-sources higher magnetic fields were suggested ( G) than that of atoll sources ( G) and they probably accrete at near-Eddington rates (e.g. Lamb 1989), while mass accretion rate is well below Eddington rates in sources. This conjecture on the magnetic field is quite old-dated and no evidence has ever been given. Furthermore the discovery of the first transient Z source, turning to an atoll makes the B-field discriminant very unlikely [see Homan et al. (2007); Lin et al. (2009)]. A study of broad band spectral and timing behavior turns to be a powerful approach to probe the Phyisics of the brightest LMXBs. This study is also used to invesigate the behavior of other X-ray binaries, e.g. black hole binaries (see e.g. van der Klis 1994). An overall comparison of these various types of sources shows that the properties of the rapid fluctuations appear to depend on in the innermost part of the source and a compact object type (BH or NS).
Usually BH and NS sources demonstrate state transitions when the soft X-ray flux monotonically increases (or decreases) which implies monotonic changes of [e.g., Titarchuk & Seifina (2009), Seifina & Titarchuk (2011) and below]. However, the total X-ray flux is not at all times a reliable indicator for (e.g., Mendez et al. 1999; Ford et al. 2000).
A Z-type represents a category of seven Galactic LMXBs: Sco X-1, GX 17+2, GX 349+2, Cyg X-2, GX 5-1, GX 340+0 and XTE J1701-462 (with an addition of Cir X-1 which is a peculiar Z-source, see Shirey et al., 1999) and the extra-galactic Z-source LMC X-2. It has been suggested that there are two types of Z-sources, characterized by differences in the shape of their Z-patterns and their power spectral characteristics (Hasinger & van der Klis 1989, see also Penninx et al. 1991).
GX 340+0 was discovered as a Galactic X-ray source by Friedman, Byram & Chubb (1967) and later its position was found by Rappaport et. al (1971). This source was preliminary determined as a NS binary by Margon et al. (1971) using an rocket data. (Ponman, 1982), (van Paradijs et al., 1988), HEAO-2 (Schulz et al. 1989) orbital observatories provided unique high quality X-ray data of GX 340+0 to indicate three main tracks with characteristic correlation of hardness ratio, which formed Z-pattern in CCD. Despite of no burst has yet been found, the very high values of QPO ( Hz) and X-ray energy spectrum (van Paradijs et al., 1988) and as well as the similarities with the different Z-sources allowed to classify GX 340+0 as a Z-source (Hasinger & Van der Klis, 1989).
The spectral characteristics of this source have not been fully studied up to now. Schulz & Wijers (1993), hereafter SW93, carried out a spectral analysis of the source based on data in the 2 – 12 keV energy range. They found that the spectrum can be fit by model which a sum of a blackbody of a temperature of 0.8 keV and a thermal Comptonization component of soft NS seed photons. SW93 also obtained an optical depth of 5 – 6 and an electron temperature of the hot corona changed from 4 to 6 keV.
Fender & Hendry (2000) estimated the distance to the source of 113 kpc using the radio measurements . Radio emission of GX 340+0 is highly variable, and probably correlates with the X-ray emission on its horizontal branch. But the radio emission anti-correlates when the source is on the other spectral branches (Oosterbroek et al. 1994).
Lavagetto et al. (2004) were the first who showed a broadband (0.1 – 200 keV) spectrum of this source based on the data using a SAX observation on August 9 – 10, 2001 (thereafter Observation , see Table 1). They decomposed the spectrum of GX 340+0 as a soft blackbody of temperature keV, Comptonization component and in addition an excess at photon energies more than 20 keV was fit using an extended power law terminated by a cutoff at high energies. Ueda et al. (2005) studied a spectrum of the source using observations. These data indicated to the presence of an iron line emission. The shape of the line can be fit by a profile, which center is at 6.6 keV and the line equivalent width is 40 eV. Then, D’Ai et al. (2009) detected a broad asymmetric emission line in the Fe Kα energy band and tried to investigate the line evolution along HB of Z-track based on XMM- data. However, the line profile does not indicate to any correlated variation although the continuum emission and luminosity underwent significant changes.
Iaria et al. (2006), Iaria06 hereafter, also examined the 0.1 – 200 keV energy spectrum using SAX observations (thereafter Observations , see Table 1) and the Lavagetto model described above. For all observations of different spectral states, they found cm-2 and that the spectrum at less than 30 keV could be fit by a sum a blackbody of 0.5 keV and a Comptonization component (Titarchuk, 1994) which seed-photon temperature of 0.9 keV and plasma temperature of 3 keV. In addition, Iaria06 used a power–law component of the photon index and a line component at 6.75 keV, related to Fe XXV. They also found that a power-law component of a photon index of 2.5 was required at higher energies.
Church et al. (2006) investigated the 3–40 keV spectrum relied on PCA/RXTE data ( set in terms of our classification, see Table 2) and applied a modified Lavagetto model, with a cutoff power law at the energies above 30 keV. They showed a good agreement this model with RXTE observations at a stable value of the best-fit photon index during all spectral states.
Before the stability of the index at different luminosities was emphasized by Farinelli & Titarchuk (2011) (hereafter FT11) for a number of neutron star low mass X-ray binaries (LMXBs). FT11 gathered X-ray BeppoSAX spectra and showed the stability of the spectral index at approximately 1 () for many NSs: X 1658-298, GX 354-0, GS 1826-238, 1E 1724-3045, Cyg X-2, Sco X-1, GX 17+2, and GX 349+2 at their different spectral states (or when the best-fit electron temperatures for these sources are drastically different). X-ray spectra for atoll sources 4U 1728-34 and GX 3+1 detected with SAX and RTXE, respectively, at different luminosities were studied in details by Seifina & Titarchuk (2011), (2012), hereafter ST11, and ST12 respectively.
The ST11 and ST12 also pointed out that the value of only varies slightly around 2, independently of and luminosity. This stability of can be an universal signature for any kind NSs either the atoll or Z-sources. It is presumably dictated by common Physics for this type of sources. FT11, ST11 and ST12 demonstrated this stability of using a model in which the emergent spectrum influenced by a strong Comptonizion component is produced in the Transition Layer (TL) between NS surface and the Keplerian accretion disk. In fact, the stability of the index occurs when , which is the energy release in TL, is much higher than which is the photon energy flux, coming from the accretion disk and illuminating TL.
Namely, ST11 shows (see also FT11) that the TL optical depth , its electron temperature , the ratio are related to each other
| (1) |
if one assumes that the balance of energy in the transition layer (TL) is established by gravitational energy release and cooling of electrons due to inverse Compton effect and free-free emission [see Zel’dovich & Shakura (1969) and later a similar formulation of this problem in Bisnovatyi et al. (1980)].
The spectral index of the Comptonization spectrum is determined by the formula
| (2) |
where the dimensionless plasma temperature and -parameter [see Titarchuk & Lyubarskij (1995)]. If one replaces by its diffusion approximation
| (3) |
and applies equation (1), we have a formula for the diffusion spectral index
| (4) |
and the photon index
| (5) |
for . Consequently as .
Note, in contrast with the neutron star sources many black hole (BH) candidate binaries show a correlated behavior of the photon index with mass accretion rate (see Shaposhnikov & Titarchuk 2009 and Titarchuk & Seifina 2009, hereafter ST09 and TS09, respectively).
Previous investigations (see Penninx et al. 1991; Kuulkers & van der Klis 1996; Jonker et al. 1998) show that Z-sources, in particular GX 340+0, are characterized, in HB or in an upper part of NB, by QPOs with frequencies changing from 20 to 50 Hz. van Paradijs et al. (1988) revealed normal branch oscillations (NBOs) with a frequency of 5.6 Hz in the middle of NB. Jonker et al. (1998) found twin kHz QPOs whose centroid frequencies are correlated with the HBO (HB oscillation) frequency.
Titarchuk & Osherovich (2001) classified the power density spectrum features for each compact object class using the Transition Layer model [see Titarchuk et al. (1998)] and the basic properties of the accretion flow around compact object. They applied their analysis for the RXTE observations of GX 340+0.
It is interesting that other Z-sources differ from GX 340+0 on the timing properties along Z-track. In particular, Cyg X-2 and GX 5-1 have well developed HBs with a strong HBO and red low-frequency noise (LFN), whereas Sco X-1, GX 17+2 and GX 349+2 have small, vertical or absent HBs with a weak or absent HBO and peaked LFN. However, in spite of various details, during Z-evolution all these Z-sources indicate 6 – 20 Hz N/FBO phenomenon and significant increasing VLFN component at FB. Previous investigations detected no QPO in the FB of GX 340+0 (e.g., Penninx et al. 1991). This fact, along with the absence of type-I X-ray bursts, make one to think about GX 340+0 as a mysterious object. However in this Paper we reveal a typical evolution of GX 340 with FBO events based on our investigation of RXTE data set, which helps one to understand the nature of FB in GX 340+0.
In this study we analyze the BeppoSAX observations and RXTE observations during 1997 – 2009 years for GX 340+0. In §2 we show the list of observations for which we apply our data analysis and the details of X-ray spectral analysis are elaborated in §3. We study how X-ray spectral and timing properties evolve during the different spectral states in §4. We discuss our results and make their comparisons with those known in the literature in §5. We make our final conclusions in §6.
2 Data Selection
We obtain broad band energy spectra of the source using data of three BeppoSAX Narrow Field Instruments (NFIs), namely the Low Energy Concentrator Spectrometer (LECS) for 0.3 – 4 keV, the Medium Energy Concentrator Spectrometer (MECS) for 1.8 – 10 keV and the Phoswich Detection System (PDS) for 15 – 200 keV [see Parmar et al. (1997); Boella et al. (1997); Frontera et al. (1997) respectively].
We use the SAXDAS data analysis package for data processing. We make the data spectral analysis in the energy range for which a response matrix of each of the instruments is well determined. We renormalized the LECS data based on the MECS data. We treat relative normalizations of the NFIs as free parameters when proceed with model fitting, but we fix the MECS normalization at a value of 1. We control if these normalizations are in a standard range for each instrument111http://heasarc.nasa.gov/docs/sax/abc/saxabc/saxabc.html. Furthermore, we rebinned the spectra in order to have significant data points. The LECS spectra are rebinned with a binning factor which is not constant over energy (Sect.3.1.6 of Cookbook for the BeppoSAX NFI spectral analysis) implementing rebinning template files in GRPPHA of XSPEC 222http://heasarc.gsfc.nasa.gov/FTP/sax/cal/responses/grouping. The PDS spectra are rebinned with a linear binning factor 2, namely we group two bins together leading to the resulting bin width of 1 keV. We apply a systematic error of 1% to all of these spectra. We present a list of the BeppoSAX observations implemented in our analysis in Table 1.
We also use publicly available the RXTE data sets (Bradt et al., 1993) which were obtained from April 1997 to March 2009. In total, they include 92 observations taken at different states of the source. We apply standard tasks of the LHEASOFT/FTOOLS 5.3 software package for data processing. We use PCA Standard 2 mode data, collected in the 3 – 20 keV energy range and the most recent release of PCA response calibration (ftool pcarmf v11.1) for spectral analysis. We also apply standard dead time correction to the data. In order to construct broad-band spectra we include the data from HEXTE detectors.
A background corrected in off-source observations is subtracted from the data. We use only data in the 20 – 150 keV energy range in order to avoid the problems related to the HEXTE response and background determination. We use the data which are available through the GSFC public archive (http://heasarc.gsfc.nasa.gov). We present a full list of observations covering the source evolution during different spectral state events in Table 2.
We accomplish an analysis of RXTE observations spanning twelve years for which 11 intervals indicated by blue rectangles in Figure 1 in Seifina, Titarchuk & Frontera (2013) hereafter STF13. We model the energy spectra using XSPEC astrophysical fitting software and we apply systematic error of 0.5% to all of the analyzed spectra. It is also worth noting that we use public GX 340+0 data from the All-Sky Monitor (ASM/RXTE) which show long-term quasi-constancy behavior of mean soft flux during all observation scans.
3 Spectral Analysis
3.1 Choice of the Spectral Model
As a first step we proceed with
a model which is a sum of an absorbed thermal component (), a thermal Comptonization
component (333Comptb is an XSPEC contributed model,
see http://heasarc.gsfc.nasa.gov/docs/software/lheasoft/xanadu/xspec/models/comptb.html)
and a line component. But this model [single COMPTB model, )]
gave a poor description of about
40% of the data. Significant
negative residuals at low energies and greater than 30 keV suggest
the presence of additional emission components. For this reason we also attempt the so called double Bbody model
[], however the best fit
of both RXTE and BeppoSAX spectra
has been obtained by implementing the double COMPTB model [)]
for all available set of the data (see Table 3 for SAX data).
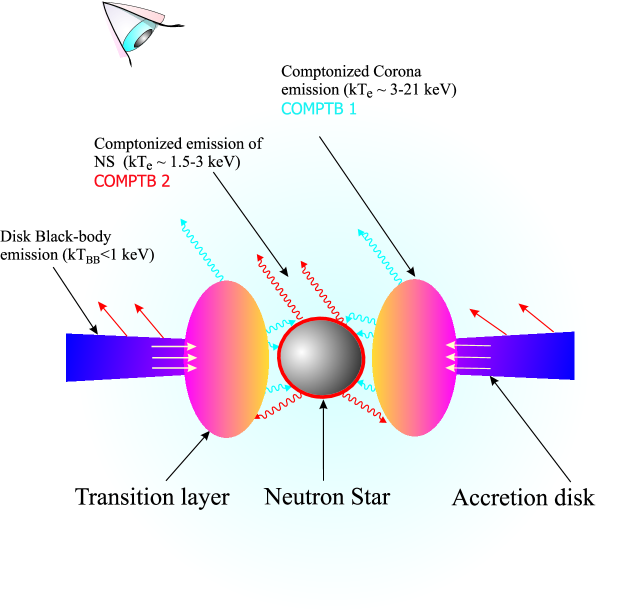
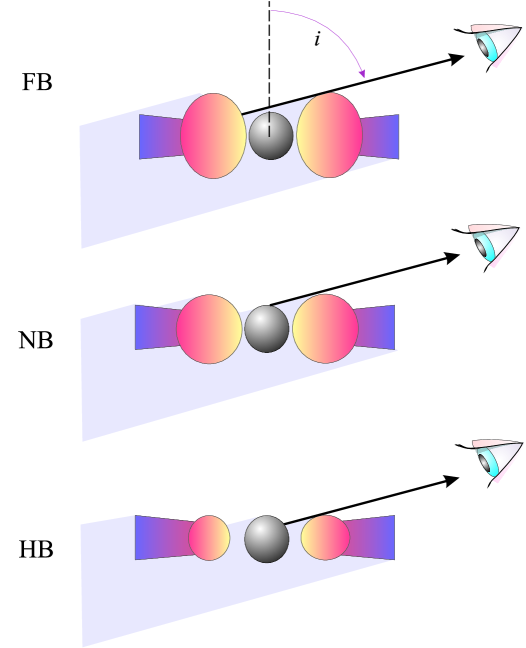
This model describes a scenario in which a Keplerian disk is connected to the Neutron star through the transition layer (TL) [see Titarchuk et al. (1998)]. We display our spectral model in Figure 1. We suggest that accretion into a neutron star occurs through the two main regions: an accretion disk [the standard Shakura-Sunyaev disk, see Shakura & Sunyaev (1973)] and TL. Then NS and disk soft photons are upscattered off hot electrons of the transition layer (TL). Thus in our picture, the emergent Comptonization spectrum is formed in TL, where thermal disk and NS seed photons of temperatures and upscatter off the TL hot electrons, giving rise to two Comptonized components Comptb1 and Comptb2, respectively. The Earth observer can directly see some fraction of the seed soft photons that justifies an addition of a soft blackbody component of temperature . In Figure 1 we show red and blue photon trajectories which are related to seed and upscattered photons, respectively.
Thus the emergent X-ray spectrum can be presented as a convolution of a soft black body spectrum of normalization and color temperature with a Comptonization Green function. Normalization is a ratio of the source luminosity to square of the distance (similar to the ordinary Bbody XSPEC model)
| (6) |
The applied model has the free parameters: the equivalent hydrogen absorption column density ; the energy spectral indices , ; seed color temperatures , ; parameters and related to the illumination fractions of the transition layer by disk and NS soft photons respectively, , , in other words is the relative weight of the Comptonization component; electron temperatures and ; normalizations of the BB-like components and of the and components respectively. To fit the data in the 6 – 8 keV energy range we add to the above model a Gaussian component, which has as parameters: a centroid line energy , the line width and its normalization .
Note that some of the parameters of the component: is related to the index of the seed photon blackbody spectrum, , and characterizes an efficiency of the bulk inflow effect vs the thermal Comptonization. We neglect this bulk motion effect for NS and we put . The bulk inflow Comptonization should take place very close to NS surface but if the radiation pressure from NS surface is high then the bulk motion is suppressed. On the other hand when mass accretion is low then the bulk effect motion effect can be ignored too. In general, for NSs the bulk effect is negligible (compare with a BH case, see ST09).
3.2 BeppoSAX data analysis
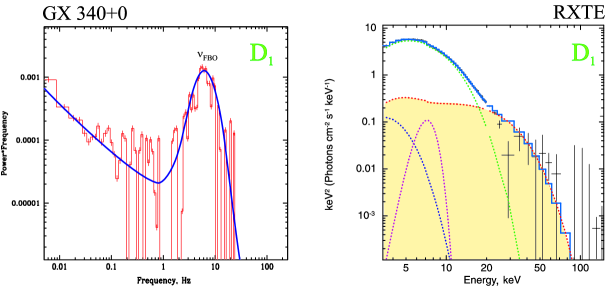
In Figure LABEL:BeppoSAX_spectra we present two representative spectral diagrams for HB and FB events along Z track of GX 340+0 using BeppoSAX data. We show the best-fit spectral diagrams of GX 340+0 using BeppoSAX observation 21375002 () and 20261006 () on the of this Figure. We present the data by crosses and the best-fit spectral model wabs*(Blackbody+Comptb1+Comptb2+Gaussian) by light-blue line. The model components are shown by dark-blue, red, green and crimson lines for Blackbody, Comptb1, Comptb2 and Gaussian, respectively. Bottom panels: vs photon energy in keV. The best-fit model parameters for HB state ( panel) are =2.040.06, =19.500.07 keV, =1.990.02, =2.760.09 keV and =6.800.06 keV (reduced =1.28 for 329 d.o.f), while the best-fit model parameters for FB state ( panel) are =2.000.08, =5.420.03 keV, =2.040.05, =1.900.02 keV and =6.680.08 keV (reduced =0.98 for 319 d.o.f) (see more details in Table 3).
The Blackbody temperature , independently of the source state, is consistent with 0.6 keV (2 upper limit). The addition of this low temperature blackbody component makes the fit quality noticeably higher. Specifically, the best-fit for HB events (id=21375002) is characterized by reduced of 2.1 (331 d.o.f.) for the model without the low temperature blackbody component, while is 0.99 (329 d.o.f.) for the model with the low temperature blackbody component. Moreover the best-fit spectral model for FB events (id=20261006) has of 1.7 (321 d.o.f.) for the model without the blackbody component, while is 0.98 (319 d.o.f.) for the model with the blackbody component.
For the BeppoSAX data (see Tables 1, 3) we obtain that the best fit spectral indices and are given by 1.010.04 and 0.990.05, respectively, (or and are given by 2.010.04 and 1.990.05, respectively, for a model). We also find that, for the available BeppoSAX data, from HB to FB, the seed temperatures and change in the ranges 0.71 keV and 11.7 keV, respectively. We apply a systematic error of 1% to all of the analyzed spectra.
3.3 RXTE data analysis
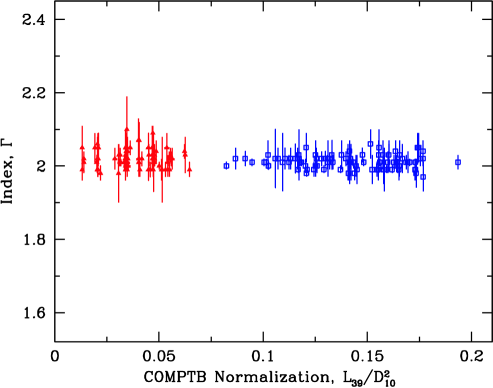
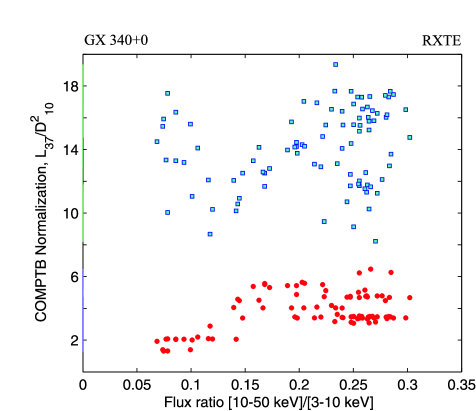
From our analysis of the BeppoSAX data we obtain the temperature of the soft blackbody component at a value of keV. However RXTE detectors cannot give us well calibrated spectra below 3 keV thus in order to fit the RXTE data we should fix this blackbody temperature at 0.6 keV. We also fix values of and at 1.1 keV and 1.5 keV, respectively (see §3.2). in Table 4 we show the best-fit spectral parameters using RXTE data. Also we find that the normalization of the component changes from 2 to 6 in units of (where is the luminosity of the seed blackbody component in units erg sec-1 and is distance in units 10 kpc), whereas is around 2 for all observations (see Figs. 2-3). Note that the line width of does not change much and numerous tests show that keV.
Furthermore, a detailed analysis XMM- spectra of GX 340+0 recently carried out by D’Ai et al. (2009) has revealed that the line profile does not present any strong change for HB. Therefore we fix of Gaussian component at a value 0.6 keV during our fitting procedure while the electron temperature of varies from 3 keV to 21 keV (Fig. 4), which is similar to that obtained using the BeppoSAX data (see Table 3).
In Figure LABEL:Zsp_compar_RXTE we show three representative spectral diagrams for different states along the Z-track. Data are taken from RXTE observations 50016-01-01-11 ( panel, Horizontal branch), 91125-03-01-000 ( panel, Normal branch) and 50016-01-02-18 ( panel, Flaring branch). We show the data using black points while the spectral model components are presented by red, green, blue and purple lines for , , and respectively. One can notice changes of spectral shape for different spectral branches in this Figure. To highlight the effect of variability of different components during evolution between the HB () and FB () states we mark the component by yellow shaded areas and trace its evolution when monotonically drops from 21 keV ( panel) to 3 keV ( panel) (see also Fig. 3 for the electron temperature range).
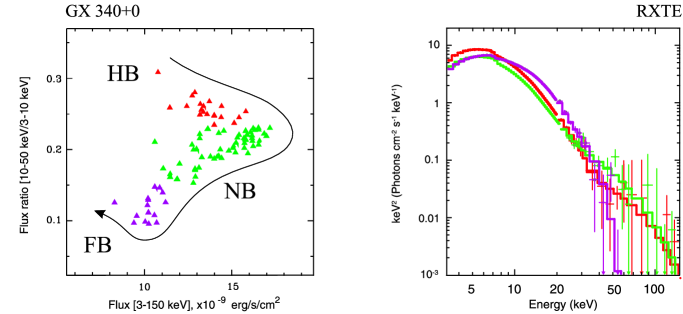
In Figure 5 three representative spectral diagrams for different states along Z track (right panel) are presented in combination with color-color diagram (left panel). Data are taken from RXTE observations 20053-05-01-01 (, NB) 20053-05-01-02 (, FB) and 20053-05-01-00 (, HB). On the right panel of this Figure one can see changes of spectral shape for different spectral branches which are presented on the left panel. Furthermore, the hard emission at 50 – 150 keV (hard tail), even if not strongly constrained, appears relatively low along FB, while during HB and NB the hard tail becomes stronger.
Our spectral model demonstrates a very good quality for all data sets analyzed in our study. In fact, , where is a number of degree of freedom, is less than or about 1 for most observations. With high counting statistics for a small fraction of the spectra (less than 2%) can reaches 1.4. On the other hand, is never above a rejection threshold of 1.5 (for 90% confidence level). We should note the energy range, in which we obtain the poor fits (one among 92 spectra with =1.46 for 67 d.o.f), is associated with the iron line region. Possibly that the iron line feature in the spectrum is more complicated than just one Gaussian line. In fact, for XMM- observation D’Ai et al. (2009) detected an asymmetric profile of Fe Kα emission line with an extensive red wing. The authors interpret that this line asymmetry is caused by relativistic smearing in an accretion disk extending close to the NS. However Laurent & Titarchuk (2007) showed that the line asymmetry can be also formed in an optically thick medium expanding with subrelativistic velocities. We must admit that this complex line structure cannot be resolved by the RXTE data.
We should also point out some differences between our best-fit values of the photon index and those found by us in the literature. In particular, the photon index , estimated by Iaria et al. (2006) for SAX observations ( – ) gives the values of is about 2.5 whereas is about 1.7 for RXTE observations () [see for details Church et al. (2006)]. However, this difference of values is a result of using different spectral models. For example, Church et al. used an additive model of a blackbody, a power law components and a single Comptonized component (Comptt).
Thus using broad band BeppoSAX observations we obtain our spectral model parameters and we can evaluate the total spectral evolution of GX 340+0 from 3 to 150 keV due to the elongated observations by the RXTE.
4 Overall pattern of X-ray properties
4.1 Color-color diagrams
To study the properties of GX 340+0 during different spectral states we make use of hard colors (HCs) and soft colors (SCs) to demonstrate different configurations in HC versus SC. Namely, in Figure 9 in STF13 we collected color-color diagrams (CCDs) (left column) and hardness-intensity diagrams (HID) (right column) of GX 340+0. The ordinate and abscissa of color-color diagrams show the flux ratios: (a) [16-50 keV/3-16 keV] and [3-5 keV/7-10 keV]; (c) [20-50 keV/3-10 keV] and [10-20 keV/3-10 keV]; (e) [10-20 keV/3-10 keV] and [9-16 keV/3-5 keV] while hardness-intensity diagrams demonstrate flux ratios: (b) [16-50 keV/3-16 keV]; (d) [20-50 keV/3-10 keV]; (f) [7-10 keV/3-5 keV] versus flux (3-50 keV) measured in units of erg/s/cm2. In this way, one can observe different shapes of the Z pattern of GX 340+0. For the presented observations (see Table 1 and 2) we found the source in three spectral states: the flaring branch (FB), the normal branch (NB) and the horizontal branch (HB).
The identification of CCD states was made using simultaneous timing and spectral analysis, see §4.3 and we have revised the previous similar investigation obtained using EXOSAT and RXTE data, see Penninx et al., 1991; Jonker et al., 1998, 2000, respectively (see §3). Both the color–color and color–flux behaviors depend on the photon energy bands in which either color or flux are evaluated. In particular plots, see panels (a), (b) and (d), there is evidence of HB, while in other ones this branch is not apparent. The evidence of FB appears only from panels (a) and (b). Instead, independently of the energy band, NB is always apparent. A comparison of the color–flux behavior of different compact X–ray binaries that host NS or a BH is shown in Fig. 6.
It should be noted that FB flux behavior of GX 340+0 corresponds to dips in the light curve (see Figs. 11-12 in STF13). Indeed, when the source intensity dips, both the soft and hard colors increase (see panel (a) in Fig. 9 in STF13 This behavior is completely different from FB one observed in Sco X-1, GX 17+2 and GX 349+2, while it is similar to the FB behavior seen in Cyg X-2. A discussion of this phenomenon is given by Hasinger et al. (1989) and Kuulkers & van der Klis (1996).
4.2 Evolution of X-ray spectral properties in different spectral states
We find properties of the HB-NB-FB state of GX 340+0 based on their spectral evolution in the 3150 keV energy range using RXTE data.
The general picture of HB-NB-FB states is shown in Figure 5 where we put together the HB, NB and FB spectra to display the GX 340+0 spectral evolution (see also panels for HB and NB spectra in Fig. LABEL:Zsp_compar_RXTE). One should point out different spectral shapes related to the different spectral states. Figures 3 and 7 in STF13. illustrate the model components while Figs 1112 in STF13 demonstrate the evolution of these components. As we indicate below (see §4.2.1), using of the best-fit model, in all spectra independently of the state a strong Comptonized component (Comptb2) related to the upscattering of the NS seed photons off the TL innermost part is dominant (see illustration of this effect in Fig. 1).
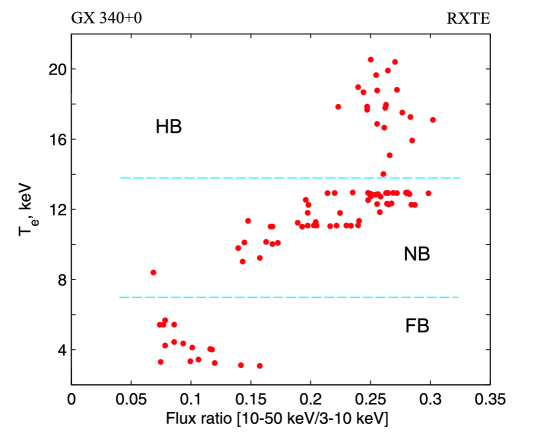
In these two states, the Comptonization component, Comptb1, related to upscattering of the disk seed photons by TL electrons of the temperature in the range of 8–21 keV, extends up to 150 keV. Instead, in FB spectra (Fig. 7 in STF13 panel for the FB spectrum) the Comptonized component Comptb1 is characterized by a decrease of the electron temperature to 3 – 6 keV and thus the spectrum only extends to 50 keV. Generally, the and components are relatively weak with respect to . We find that values for the electron temperature is close to that of , only during flaring branch, when monotonically decreases to 3 keV, while shows low variability about 3 keV during all spectral states. HC ratio [10-50 keV]/[3-10 keV] drops from 0.3 to 0.1 during HB-FB spectral evolution (see Fig. 4).
Thus using Figure 4, one can find one-to-one correspondence between spectral states of GX 340+0 and value of within the limits, marked by horizontal blue dashed lines. The electron temperature varies by a factor of 10 during these states while and , for each of these spectra, only vary from 1.9 to 2.1 (see Fig. 3).
Using -statistic criterion, we test the hypothesis that the approximate value of both indices and is . We calculate the distribution of versus of . We find a sharp minimum of the function of about 1 for two Comptonized components ( and ). Namely with a confidence level of 67% and with a confidence level 90% for 92 d.o.f. (see also Figure of for 4U 1728-34 in ST11). We should point out that the indices , are also independent of the normalizations of , ; and , (see Figs. 23). Relying on BeppoSAX observations and their analysis FT11 propose that varies about 2 for many NSs which are seen from the hard to soft states. FT11 relate the spectral state to a value of electron temperature and they demonstrate that the photon index (or the spectral index ) while varies in the range from 2 to 25 keV.
4.2.1 Light curves and related spectral characteristics
We find a number of X-ray flaring events of GX 340+0 using RXTE data obtained during 20002001 (, sets) with a full rise-decay evolution. We examine generic spectral and timing properties which can be found during these spectral state events. In Figures 11 in STF13 we show the details of our spectral analysis of the RXTE observations applying our model .
In Figure 11 in STF13 we show the changes of count rate (2-9 keV) in counts s-1 with 16 s time resolution, the hardness ratio coefficient HC [10-50 keV]/[3-10 keV], the electron temperatures ()/ () of / components, the normalizations of and components ( and respectively) and the index for and components ( and points respectively) during the 2000 events ( set) of time period from MJD 51722 to MJD 51777. The dipping phases of the light curve, which are related to the flaring branch (based on timing analysis, see also Fig. 9 and § 4.3) are marked with blue vertical strips. Note that during these dipping phases of the light curve the hardness ratio coefficient (HC) is usually less then 0.15.
Additional flaring events are presented in Fig. 12 (STF13) where we display details similar to those shown in Fig. 11 in STF13 but for 2001 events ( set) during the MJD 51920MJD 51925 period. Note the temperature also correlates with the hardness ratio coefficient HC [10-50 keV]/[3-10 keV] and it monotonically diminishes from 20 keV to 3 keV during the HB-FB transition.
It is clear to see, using Figs. 11- in STF13 that the electron temperature ( points) steadily decreases from 20 keV during the transition from HB to NB, reaching its minimum at 3 keV in flaring FB [MJD 51774 – 51774.3, 51776.5 – 51776.7 (Fig. 11 in STF13 ); MJD 51921.4 – 51921.7, 51922.4 – 51922.7 (Fig. 12 in STF13)] while the electron temperature ( points) is almost constant at the mean value of about 3 keV. On the other hand, the normalizations and are weakly correlated with the variations of hardness ratio coefficient HC and count rate in 2-9 keV energy band, with the X-ray emission related to neutron star that dominates during all spectral states (see Fig. 7). The normalization of , is low variable around its mean level of 0.15. The X-ray contribution from the Comptonizaton of the disk seed photons is weaker by factor 2 than that related to the NS seed photons. during all spectral states (Fig. 7). We should point out that the indices , shown in the bottom panels of Figures 11-12 in STF13 only slightly vary with time around 1(or the corresponding varies around 2).
4.2.2 Comptonized emission
Note that the Comptonization fraction changes from 0 to 0.5 as shown on Fig. 8 (red triangles). Thus, in most cases of HB and NB states, the soft radiation of GX 340+0 dominates and is only slightly modified by reprocessing in the TL (). Then, during the transition to FB, monotonically increases from 0.2 to 0.5 when decreases from 6 keV to 3 keV. Consequently, the Earth observer directly sees a smaller fraction of disk emission () in FB. We remind a reader that the Comptonization fraction , related to the NS surface seed photons upscattered off the TL electrons, is about 1. We freeze on the assumption that NS is completely surrounded by its TL (see Fig. 1 for the model geometry).
4.3 Timing properties during HB-NB-FB evolution
We analyze the RXTE light curves using the powspec task from FTOOLS 5.1. We perform the timing analysis RXTE/PCA data using the event mode in the 13 – 30 keV range. The event mode time resolution is 1.2 s. We obtained PDSs in the 0.1 – 500 Hz frequency range with 0.001-second resolution. The contribution due to Poissonian statistics and Very Large Event Window for all PDSs were subtracted.
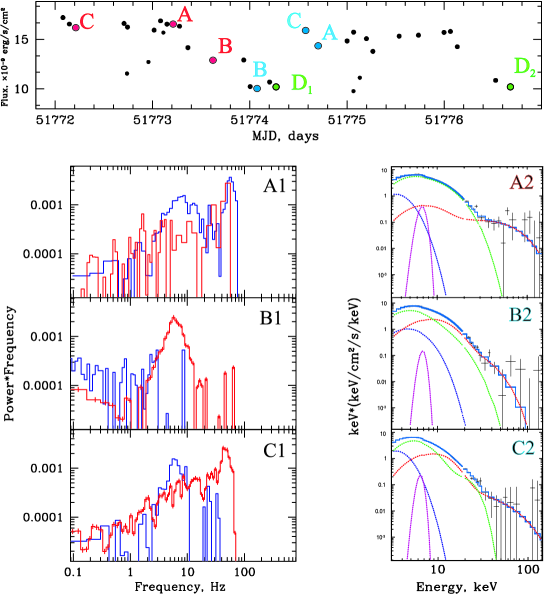
We demonstrate an evolution of the 3 – 150 keV flux during the 2000 () events (see top panel of Figure 9). Here points A, B, and C mark moments at MJD = 51773.2/51774.7, 51773.6/51774.1 and 51772.2/51774.6 related to different phases of Z-state evolution. In addition, points indicate moments at MJD=51774.27/51776.68 of FB where we find 6 Hz QPO at branch of GX 340+0 (see also Fig. 10 and details below).
We present PDSs for 15-30 keV range ( column) plotted along with spectral diagrams ( column) for A (, top), B (, middle) and C (, bottom) points of the light curve in the bottom panel. A typical exposure time for each PDS is 3-4 ksec. In particular, the accumulation time for PDS during 50016-01-02-16 observation (see Fig. 10) is 3876 sec.
An evolution of timing properties over the Z track is clearly seen in this segment of the light curve (see top panel of Fig. 9). Strong oscillations with centroid frequency at 50 Hz are observed at HB (see Fig. 9, left panel, C PDS related to MJD=51772.2). While broad oscillations ranging in 2 – 10 Hz (B , 50016-01-01-06, MJD=51773.6; C , 50016-01-02-04, MJD=51774.6) and 50 Hz (A , 50016-01-02-12, MJD=51774.7) are detected during middle and hard apex of branch (NB), respectively. Relatively strong noise component (LFN) is present (up to 10% rms) and NB (up to 2% rms) but none of these features is seen during FB when a very low frequency noise (VLFN) component arises (B , 50016-01-02-18, MJD=51774.1). We show the diagrams (A2, B2, C2 panels) corresponding to the related PDSs (A1, B1, C1 panels) on the right. We present the data by black points whereas we demonstrate the spectral components using dashed red, green, blue and purple lines for , , and respectively.
We also reveal 6 Hz QPOs in FB during two “dipping/flaring” events ( data set), which are not detected previously in GX 340+0, but present in power spectra of all other Z sources during this state. More specifically, during first dipping phase of light curve [for example, see point B (MJD 51774.08) in Fig. 9] we find only strong VLFN component (see histogram, in the middle panel of left column) without QPO feature. While during the last part (exit phase) of the intensity dip we find a broad QPO Lorentzian centered at 6 Hz (FWHM= Hz, rms=%) in addition to VLFN (rms=4.1%0.4%, =1.40.3, = 139 for 102 d.o.f; we present all parameter errors corresponding to 1 confidence level). The related point of the light curve is indicated by point observed on August 18, 2000 (50016-01-02-16, MJD=51774.27) seen in Fig. 9. We make the corresponding diagram for this event in 0.01 – 150 Hz range (see panel of Fig. 10). We should point out that the energy spectrum at point ( panel of Fig. 10) is a typical FB spectrum [e.g., see also Z3 panel of Fig. 7 in STF13 with a relatively low contribution of the hard emission at 70 150 keV (hard tail), while at HB and NB the hard tail becomes stronger ( points A and C in Fig. 9].
During another FB event (see point ) we detected the same behavior of PDS, characterized by the absence of QPO at the beginning and middle of FB but the presence of broad centered QPO at frequency about 6 Hz in the bottom phase of FB (50016-01-02-01, MJD=51776.68) in addition to strong VLFN component. Note that the energy spectra for both points (, ) are very similar (their best-fit parameters are mostly identical).
Note that the energy spectra of points are similar to that indicated by B (blue) point (and generally typical to FB spectra, see Z3 diagram of Fig. 7 in STF13 but the related power spectra are completely different. In fact, we reveal a broad QPO, centered at 6 Hz, for the first time in the PDS of GX340+0 (see Fig.10).
Thus, we find that the evolution of spectral and timing characteristics is consistent with previous analysis of GX 340+0 using EXOSAT, , RXTE and XMM- data [see e.g. Penninx et al. (1991), Jonker et al. (2000)]. In addition to known timing features of the Z pattern of GX 340+0 we reveal 6 Hz FBO, which was not found previously, while it is usually observed in other Z sources such as Sco X-1 and GX 17+2. This kind of QPOs are seen in the lower FB, and also seen in NB of those Z-sources. The frequency starts to increase from Hz to 20 Hz when these particular sources progress from FB to NB. In the lower FB, this QPO frequency Hz becomes very broad and then vanishes in the noise.
Follow to Kuulkers & van der Klis (1996) and Titarchuk et al. (1998), we can interpret the appearance of this QPO phenomenon during FB in terms of the Transition Layer (TL) model involving a radial flow and a thick, torus-like CC (see illustration of this interpretation in Fig. 11). To conclude the above analysis, we should point out once again that the identification of CCD states of GX 340+0 along track is made using timing (presented here) along with spectral analysis (see §3).
4.4 Comparison of spectral and timing characteristics of Z source GX 340+0 and atoll sources GX 3+1 and 4U 1728-34
In this Paper, we study the correlations between spectral, timing characteristics, and seen in X-ray spectral range for GX 340+0 during its evolution across HB-NB-FB track in order to investigate a common behavior of Z and a͡toll sources. In this way we proceed with a comparative analysis for three sources: Z-source GX 340+0 and atolls, GX 3+1 and 4U 1728-34 using the same spectral model which consists of low temperature Blackbody, Comptonized continuum and Gaussian line components.
4.4.1 Quasi-constancy of the photon index
Z-source GX 340+0 and , GX 3+1, 4U 1728-34 show an identical behavior of vs (or COMPTB normalization), namely the index is strongly concentrated around 2 (see Fig. 2 for that in GX 340+0). According to FT11, ST11 and ST12, this result can point out that the cooling flux of the soft disk photons is much less than the gravitational energy release in the transition layer for all of these three sources.
4.4.2 The difference and similarity of the electron temperature ranges in GX 340+0, GX 3+1 and 4U 1728-34
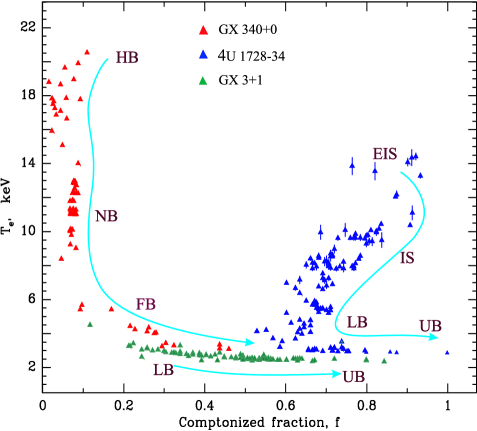
One can see, using Figure 8, the ranges of the TL electron temperature for state evolutions of these three sources. As clearly seen in this Figure (see also Fig. 12) of Z-source GX 340+0 ranges from 3 to 21 keV, while that of 4U 1728-34 is slightly more narrow, from 3 to 15 keV and of atoll GX 3+1 just varies around 3 keV. Note that all objects have a common temperature interval, 3 – 4 keV.
As it is shown in Table 5 variations of of blackbody, and seed (NS and disk) photon temperatures are comparable for all of these three sources: 0.6 keV and keV, respectively. But variations of are different. This difference of ranges for all of these three sources is quite evident. Whereas GX 340+0 and 4U 1728-34 show a complete cycle of state evolution, namely, HB-NB-FB track for GX 340+0 and 4U 1728-34 evolves from the extreme island state (EIS) to the upper banana (UB) state (see Di Salvo et al. 2001; ST11), GX 3+1 demonstrates only a short LB (lower banana)-UB track on the CCD. It is clear from Figure 8 which shows the track of GX 3+1 just for a part of the full track [see definition of a state sequence in Hasinger & van der Klis (1989)].
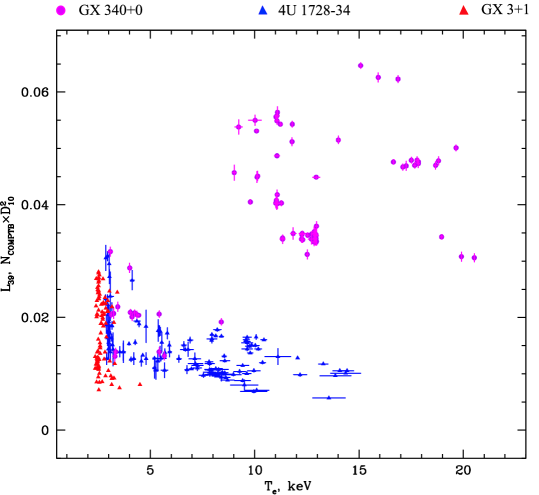
But GX 340+0 shows almost the same range as that in 4U 1728-34, while it demonstrates a different timing evolution. How different Z and atoll sources are one can clearly see from Fig. 12, which shows the luminosity in terms versus . Z-source GX 340+0 ( points) is much brighter than atolls, 4U 1728-34 ( points) and GX 3+1 ( points).
4.4.3 Comparison of spectral evolution as a function of the for source GX 340+0 and sources GX 3+1 and 4U 1728-34
Now we can make a comparative analysis of spectral parameter evolution for GX 340+0 and GX 3+1, 4U 1728-34 based on of soft disk photons, which is proportional to to disk mass accretion rate and inversely proportional to square of distances to these sources (see Eq. 6 and Table 5). We should remind a reader that atoll sources 4U 1728-34 and GX 3+1 demonstrate only one Comptonized () component in their X-ray spectra [Seifina & Titarchuk (2011), Seifina & Titarchuk (2012)], while Z-source GX 340+0 reveals two Comptonized components ( and ). The first component is formed by up-scattering processes in TL for seed photons of temperature keV coming from the disk, while the second component is formed as a result of up-scattering processes in TL for seed photons of temperature keV coming from the neutron star. In contrast with GX 340+0, the spectra of atolls, 4U 1728-34 and GX 3+1 contain only one Comptonized () component, which is related to up-scattering processes in TL for seed photons of temperature keV, presumably coming from the disk. Therefore we should compare spectral components of the same origin for considered Z and atoll sources. Namely, component (with illumination parameter) for GX 340+0 and components (with illumination parameter) for 4U 1728-34 and GX 3+1.
Specifically, for GX 340+0 the distance is about 10 kpc (Fender & Henry 2000), whereas for 4U 1728-34 and GX 3+1 the distances are 4.5 kpc and 4.26.4 kpc, respectively [see van Paradijs (1978) and Kuulkers & van der Klis (2000)]
We present the of these sources as a function of in Fig. 12. For GX 340+0 (), we show a variable normalization only. GX 340+0 demonstrates much higher luminosities by factor 5 than that in 4U 1728-34 and GX 3+1 and in GX 340+0 widely varies, from 3 to 21 keV. According to FT11, ST11 and the presented study, for atoll and Z-sources varies from 2.5 to 25 keV. Specifically, a common range of for GX 340+0, GX 3+1 and 4U 1728-34 is around 3 keV and the low limit of around 2.5 keV occurs at the peak luminosity for 4U 1728-34 (see ST11) and during a rise of luminosity for GX 3+1 and during FB stage for GX 340+0 (see Figs. 8, 12).
We should note that common states in vs diagram for all these sources take place during rapid transitions in FB and LB – UB for GX 340+0 and GX 3+1, 4U 1728-34, respectively. These states can be possibly traced within a narrow interval from 2.5 to 4.5 keV.
4.4.4 The difference and similarity of time scales for state evolution for GX 340+0, GX 3+1 and 4U 1728-34
We point out that all these three objects show a full range evolution track but in different time scales. Specifically, Z-source GX 340+0 and atoll GX 3+1 demonstrate electron temperature and variations occur on the time scales of hours-days, while atoll 4U 1728-34 show a full range of the model parameter variations on significantly larger time scale (days-months). However, the low electron temperature phase of atoll 4U 1728-34 occurs at the same short time scale as that for GX 340+0 and GX 3+1.
4.4.5 Correlation of illumination parameter with electron temperature and its relation with different states in the color-color diagram
Using Table 5 one can notice that the variation of Comptonization fraction is larger for GX 3+1 () than that for 4U 1728-34 () and GX 340+0 (). Thus it is obvious that illuminations of the Transition Layer by soft photons are different for these three sources.
In Figure 8 we plot the electron temperature versus Comptonized fraction for Z-source GX 340+0, and atolls, GX 3+1 and 4U 1728-34 during different spectral states. Red, and blue points correspond to RXTE observations of GX 340+0, GX 3+1 and 4U 1728-34 respectively. On the left hand side of the Figure one can see a sequence of CCD states HB, NB, FB (the horizontal, normal and flaring branches respectively) which are presented according to the standard Z-scheme (Hasinger et al., 1989). Based on the obvious correspondence between and spectral states (Fig. 4) and timing evolution of GX 340+0, is directly related to the sequence of CCD states in GX 340+0. Note that recently ST12 revealed one-to-one correspondence between spectral states, and for atolls, GX 3+1 and 4U 1728-34. The direction in which the inferred increases is indicated by arrows.
In Fig. 8 one can see three different tracks on the plot of versus for GX 340+0, GX 3+1 and 4U 1728-34 and how these tracks are related to the standard sequence of CCD states. When rises, monotonically decreases from 21 keV to 3 keV for GX 340+0, and from 4.5 keV to 2.3 keV for GX 3+1, while 4U 1728-34 shows a more complex example At high temperature state (EIS), when decreases, slightly changes from 0.9 to 1. Further as drops from 12 keV to 4 keV, decreases from 0.9 to 0.5. Ultimately, at the low-temperature state (LB-UB) surges from 0.5 to 1. Thus, one can see that the CCD state evolution can be observable as a relation between and too.
4.5 Comparison of spectral hardness diagrams for atoll, Z and BHC binaries
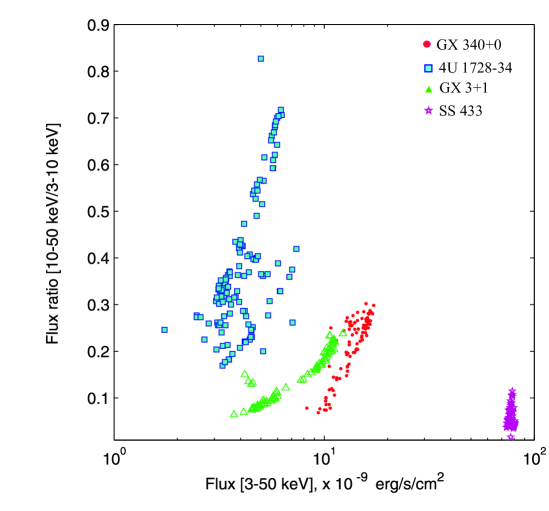
To compare evolution properties of GX 340+0 with atolls and BHC sources in terms of flux (or luminosity), we plot HC (10-50 keV/3-50 keV) versus the flux in the 3-50 keV range to create our hardness-intensity diagram (HID) for four sources (see Fig. 6): Z-source GX 340+0 (), atolls, GX 3+1 () and 4U 1728-34 (), and BHC SS 433 (). We should remind a reader that Seifina & Titarchuk (2010), hereafter ST10, found a correlation of the index with mass accretion rate and a clear signature of the index saturation when increases. Thus ST10 argue that SS 433 should be a black hole because the index changes and saturates with in BHs only.
As it appears from Figure 6, NS ( and Z) binaries trace a specific elongated or diagonal track in this HID over a larger range of luminosity and (hard) colors than that of BHC SS 433. However, sources systematically are fainter than Z and BHC sources and show much harder spectra when they are in the low state [see e.g. van der Klis (1994a) for details of comparison of NS and BH sources]. In fact, when atolls in the soft state, their spectra are pretty similar to the spectra of Z-sources. However Z-sources are usually softer than but not in the case of GX 340+0 which is an intermediate case between and BHs in terms of their luminosities. This fact possibly reflects intermediate rate of mass transfer in GX 340+0 among and BH sources [see also a review by van der Klis (1994)].
The resulting luminosity in GX 340+0 is in the range of (0.3 – 0.7) . This estimate can be derived using the NS seed photon temperature which varies in the 1-1.7 keV range (see Table 3). Type-I X-ray bursts are not observed in GX 340+0. This observational fact can be a consequence of high in this source. Usually type-I X-ray bursts are seen in low-hard states of NS when the resulting radiation pressure between outbursts is quite low. Thus nothing can stop to accumulate plasma in the NS surface until the plasma column reaches its critical weight which leads to the explosion (X-ray burst). Thus a certain level of the surface weight should be attained in order to start an X-ray burst. Narayan & Heyl (2002) demonstrated that X-ray bursts (instability) can occur for a wide range of the temperature of the accreted flow (and corresponding emergent luminosity ). Although this instability is less probable for higher . Probably this is precisely our case of GX 340+0 where is order of Eddington or little bit less ().
5 Discussion
To further study the similarities between Z and atoll sources we have investigate how X-ray spectral, timing characteristics and mass accretion rate are related in Z-source GX 340+0 during the evolution across HB-NB-FB track. This investigation helps us to constrain the models related to X-ray spectral formation in compact objects.
5.1 Does mass accretion rate monotonically increase during HBNBFB evolution?
We observe a quasi-constancy of during HB-NB-FB evolution, which can be presented as an argument against the commonly adopted view that monotonically increases along the Z-track, since is related to the normalization of the Comptonized component. In fact, (see Eq. 6) is proportional to the soft photon luminosity which is its turn proportional to .
We detect spectral and timing evolution of GX 340+0 similar to that of dipping Z-source Cyg X-2, where we see that the spectral features of the source are strongly influenced by its high inclination angle (Vrtilek et al., 1999, Titarchuk et al. 2007). Cowley et al. (1979) reported that Cyg X-2 is observed at an inclination between 65∘ – 75∘. Farinelli et al. (2009) analyzing SAX observations of Cyg X-2 and using a sum of two COMPTB components, successfully described the spectral behavior of the source from its HB to NB. Consequently we can suggest that modulation of the flux from the TL outer part and TL innermost part (related to and , respectively) is a result of geometric effects.
In fact, there is no direct information on the binary inclination angle of GX 340+0, based on radial velocity analysis. The only indication on inclination angle of 35∘ for GX 340+0 is deduced using the so called “relativistically smeared out” profile of Fe Kα line. D’Ai et al. (2009) suggest that the iron line profile can be produced as a result of reflection of X-ray hard radiation, forming in Comptonization region, from relatively cold NS and disk surfaces. But the spectral features due to reflection should be seen only if the spectral index of the incident flux onto NS or disk surfaces is essentially less than 1 (Laurent & Titarchuk, 2007) not like in our case of GX 340+0 (see Figs. 2-3).
An assumption of high inclination angle of GX 340+0 leads us to suggest that can be greater at FB, when we can possibly see only some relatively small part of X-ray emission from NS surface due to Comptonization region screening effect (see Fig. 11 for explanation of geometrical constraints).
Furthermore, in the case of low inclination angle we would also see strong BB component and monotonic increase of the normalization of Comptonized component along HB – FB track. However, our spectral analysis indicates low BB contribution during all Z-states (see Sect. 4.2.1). This fact can be considered as an additional argument in favor of high inclination angle for binary GX 340+0 (see discussion in Sect. 5.3). In turn, the influence of high inclination on the soft X-ray flux can result in some distortion of real value. Thus, the normalization parameter is not a reliable indicator for in the GX 340+0 case.
5.2 Detection of QPOs in the Flaring Branch of GX 340+0
In this study we report a discovery of 6 Hz QPO in the FB of GX 340+0. Specifically, when the source enters the upper part of FB, a QPO peak appears with a central frequency of about 6 Hz. This part of FB corresponds to a dip (more specifically, the final part of the dip) in the light curve. Note that these QPOs exhibit a number of clear differences with respect to FBOs that were observed in Sco X-1 and GX 17+2. In these two sources, there is a continuous evolution between the NB and FB and a value of the QPO frequency steeply rises near the NB-FB state evolution, but never disappears (see Dieters & van der Klis 2000, Penninx et al. 1990). But in our data the 6 Hz QPO is clearly seen in NB (which becomes broad in lower FB), but there is no QPO in the beginning and middle of FB.
The QPO frequency seen in Cyg X-2 is 26 Hz, is the highest ever seen in FB of any Z-source, with a FWHM of only 3 Hz (Wijnands et al 1998). In Sco X-l and GX 17+2 FBOs can be observed up to Hz as the source moves along FB, but at that point the QPO usually becomes very broad (with the width of 10 Hz, see e.g. Dieters & van der Klis 2000), and further up in the FB, this QPO drops into the background noise components (Middleditch & Priedhorsky 1986). The FBOs, which are seen before, have been related to a hard energy spectrum, whereas the QPOs that we reveal, are associated with a soft spectrum. We should note that Hasinger et al. (1990) reported some excess of power between 5 and 20 Hz in GX 340+0 during a dip in FB, which they interpreted as a possible FB QPO. In view of the differences in the FB properties, we suggest that the 6 Hz QPO which we see in FB, may be caused by a similar mechanism as the usual N/FBO. It is remarkable that the QPO disappears when the source enters into the dip and appears once again when GX 340 leaves the dip. This can suggest that during the dip the emergent emission is suppressed because the line of sight to the source is affected by an absorbing or scattering medium. Fortner et al. (1989) suggest that NBO arises due to a feed-back loop between the radiation force and the accretion rate in an approximately radial inflow fed by matter that was initially in the accretion disk, but has lost its angular momentum due to photon drag. In this model, FBOs are also assumed to originate as a result of oscillations in this radial flow, at super-Eddington accretion rates.
In this way, as it has been figured out by a number of authors (e.g. van der Klis et al. 1987, Alpar et al. 1992 and Titarchuk & Osherovich 2001,), near the Eddington limit the radiation-pressure dominated region of the disk might be puffed up which for certain inclinations could partially obscure the innermost part of the X-ray emitting regions, and their oscillations.
5.3 Possible indication of a high inclination of binary GX 340+0
The fact that the intensity shows a dip, when the QPO appears, can be an indication that the torus enters into the line of sight. Adopting a torus-like shape for the innermost part of the source when the source becomes near-Eddington luminosity regime we can explain the differences in the shape of FB in HID between different Z-sources and the correlated differences that are observed in N/FBO properties (see Kuulkers et al. 1994). All these differences can be due to differences in binary inclination angles (Fig. 11). We suggest that the sequence of events, that is observed, takes place when the source approaches the Eddington limit. It is possible that a gradual increase in the geometrical thickness of the inner region (Compton cloud) is due to a gradual increase of total (Fortner et al. 1989). What the observer sees strongly depends on the binary inclination angle . At low , the torus never comes to the line of sight and thus during FB the X-ray intensity (or flux) always increases, the N/FBO are seen all the way between 6 and 20 Hz (e.g. Sco X-1, GX 17+2). But at higher inclinations , FB is seen out by the Earth observer when the flux increases and thus the Compton cloud (torus) shielding the NS enters into the line of sight, similar to that in case of Cyg X-2 (see illustration of this event in Fig. 11).
In general, sources observed at angles , the so-called dipping sources, show regular dipping, modulated at the orbital period by the presence of an extended bulge. The observational situation can be different for GX 340+0 where achromatic dipping seems to relate to some turbulent accretion episodes at the inner edge of the disk. For this geometry, one can argue that inclination should not be so important. However if the inclination angles are quite small one can see the direct BB component of the NS while in the case of GX 340+0 this NS BB component is not observed and it can be an additional argument that the Earth observer sees GX 340+0 at relatively high inclination angles.
In fact, if the transition layer (or Comptonization region) is puffed up then the NS BB direct radiation is not seen and in this case there is no dependence on the inclination angle. But if the luminosity less than Eddington then there is a difference between the low an high inclination cases. At the former case one can see the direct BB component of the NS while in the latter case the BB component is not seen. The NS BB radiation is up-scattered off Compton cloud plasma (the TL innermost part). This can be our case, because independently of the mass accretion rate (or spectral state), the illumination factor of the NS soft photons is always about 1 (see Sect. 4.2.1). It means that we always see this source at high inclination angle independently of .
6 Conclusions
In this Paper, we demonstrate the results of our study of spectral-timing correlations and their dependences on mass accretion rate observed in GX 340+0 with the RXTE and BeppoSAX. We study the similarities between Z and atoll sources to make constraints and figure out models which can explain X-ray spectral formation in these compact objects. In our study we use the broad energy band and adequate spectral resolution of the SAX detectors in the 0.1200 keV range combined with the extensive RXTE observations in the 3150 keV range.
We find that the X-ray broad-band energy spectra of GX 340+0 can be properly reproduced by an additive model, composed of low-temperature component, two Comptonized components with different seed photon temperature (=1/1.5 keV). We should also add the iron-line (Gaussian) component to fit the BeppoSAX and RXTE data of GX 340+0. Spectral analysis using our model demonstrates that the photon indices and of these Comptonized components only slightly vary around 2, namely =1.990.02 and =2.000.02. While the electron temperature of the outer part of the transition layer (TL) changes from 21 to 3 keV and the electron temperature of the TL innermost part varies around 3 keV along Z-track from HB to FB.
Based on RXTE data we detected 6 Hz quasi-periodic oscillations at the flaring branch (FB), which were not detected previously in GX 340+0, but this type of QPO frequency have been revealed in PDSs of all other sources at FB.
We explain this stability of the indices of Comptonozed components around a value of 2. The index stability now found for Comptonized spectral components of the Z source GX 340+0 during the state evolution of the source is similar to that previously established in atolls, 4U 1728-34, GX 3+1 and shown for quite a few of other LMXBs (see Farinelli & Titarchuk, 2011).
We also find in the BeppoSAX spectra that there are two blackbody components, one, with relatively low color temperatures 0.6-1 keV, is probably related to the disk emission and another one of color temperatures about 1.5 keV probably corresponds to the NS surface emission.
We establish that monotonically arises in the 321 keV range when GX 340+0 evolves from FB to HB (see Fig. 8).
In ST11 we show that if the energy release in the Transition Layer is much higher than that in the disk i.e. , then the resulting photon index of the Comptonized component of the spectrum, . We also suggest that the index stability effect is an intrinsic signature of atolls, for example GX 3+1, 4U 1728-34, whereas in BHs monotonically increases with and finally saturates at high values (see ST09). The indices of BHCs (GRO J1655-40, GX 339-4, GRS 1915+105, H1743-322, SS 433, Cyg X-1, 4U 1543-47, XTE J1550-564) demonstrate strong correlation with or with the soft (disk) photon normalization . When exceeds a certain level (a few times of the Eddington mass accretion rate) the index starts to saturate. In this Paper we show that the behavior of the index for NS GX 340+0 is the same to that in atolls, 4U 1728-34, GX 3+1, and thus is drastically different from that in BHCs.
Our observational results and their theoretical explanation supports the idea that the X-ray spectral evolution of NS LMXBs, reveal the unique quasi-stability of the photon indices of each Comptonized components near a value of 2. This can be explained by the model in which the energy release in the transition layer is much higher than that in the accretion disk and consequently the NS blackbody and thermal Comptonized components are dominant in the X-ray emergent spectrum.
We acknowledge productive discussion of the paper with Chris Shrader. Also we should point out a very deep analysis of our paper by the referee who suggests many important modifications of the paper.
References
- Alpar et al. (1992) Alpar M. A., Hasinger G., Shaham J., Yancopoulos S., 1992, A&A 257, 627
- Bisnovatyi et al. (1980) Bisnovatyi, G. S., Khlopov, M.Yu., Chechetkin, V.M. & Eramzhyan 1980, Sov. Astr., 24, 716
- Boella et al. (1997) Boella G., Butler R. C., Perola G. C., et al., 1997, A&A, 122, 299
- Bradt et al. (1993) Bradt, H. V., Rothschild, R. E. & Swank, J. H. 1993, A&AS, 97, 355
- Church et al. (2006) Church, M. J., Halai, G. S. & Bal̀uciǹska-Church, M. 2006, A&A, 460, 233
- Corbet et al. (1989) Corbet R. H. D., Smale A. P., Charles P. A., Lewin W. H. G., Menzies J. W., Naylor T., Penninx, W., Sztajno M., Thorstensen J. R., Trmper J., van Paradijs J., 1989, MNRAS 239, 533
- Corbet et al. (1989) Cowley, A. P., Crampton, D., Hutchings, J. B., 1979, ApJ, 231, 539
- D’Ai et al. (2009) D’Aı, A., Iaria, R., Di Salvo, T., Matt, G. and Robba, N. R. 2009 ApJ, 693, L1
- Di Salvo et al. (2001) Di Salvo, T., Mendez, M., van der Klis, M., Ford, E. & Robba, N.R. 2001 ApJ, 546, 1107
- Dieters & van der Klis (2000) Dieters S., van der Klis M., 2000, MNRAS, 311, 201
- Farinelli et al. (2008) Farinelli, R., Titarchuk, L., Paizis, A. & Frontera, F. 2008, ApJ, 680, 602 (F08)
- Farinelli et al. (2009) Farinelli, R., Paizis, A. & Landi, R. and Titarchuk, L., 2009, A&A, 498, 509
- Farinelli & Titarchuk (2011) Farinelli, R. & Titarchuk, L., 2011, A&A, 525, 102 (FT11)
- Fender et al. (2000) Fender, R. P., & Hendry, M. A., 2000, MNRAS, 317, 1
- Ford et al. (2000) Ford, E. C., van der Klis, M., Mndez, M., Wijnands, R., Homan, J., Jonker, P. G., & van Paradijs, J. 2000, ApJ, 537, 368
- Ford & van der Klis (1998) Ford, E.C., van der Klis, M. 1998, ApJ, 506, L39
- Ford et al. (1998) Ford, E. C., van der Klis, M., Kaaret, P. 1998, ApJ, 498, 41
- Fortner et al. (1989) Fortner B., Lamb F. K., Miller G. S., 1989, Nature 342, 775
- Friedman et al. (1967) Friedman, H., Byram E. T., and Chubb, T. A., 1967, Science, 156, 374
- Frontera et al. (1997) Frontera, F. et al. 1997, A&AS, 122, 357
- Hasinger et al. (1990) Hasinger, G., van der Klis M., Ebisawa K., Dotani T., Mitsuda K., 1990, A&A 235,131
- Hasinger et al. (1989) Hasinger, G., & van der Klis, M. 1989, A&A, 225, 79
- Homan et al. (2007) Homan, J., et al. 2007, ApJ, 656, 420
- Homan et al. (1998) Homan, J., van der Klis, M., Wijnands, R., Vaughan, B., & Kuulkers, E. 1998, ApJ, 499, 41
- Iaria et al. (2006) Iaria, R., et al. 2006, Chin. J. Astron. Astrophys., Suppl. 1, 6, 257
- Jonker et al. (1998) Jonker, P. G., Wijnands R., van der Klis, M., Psaltis, D., Kuulkers, E. & Lamb, F.K. 1998, ApJ, 499, L191
- Jonker et al. (2000) Jonker, P. G., van der Klis, M., Wijnands R., et al. 2000, ApJ, 537, 374
- Kuulkers & van der Klis (2000) Kuulkers, E & van der Klis, M. 2000, A&A, 356, L45
- Kuulkers et al. (1994) Kuulkers, E., van der Klis, M., Oosterbroek, T., Asai, K., Dotani, T., van Paradijs, J. & Lewin, W. H. G., 1994, A&A, 289, 795
- Kuulkers & van der Klis (1996) Kuulkers, E. & van der Klis, M., 1996, A&A, 314, 567
- Lamb et al. (1989) Lamb F. K., 1989, in: Two-Topics in X-ray, 23rd ESALAB Symp., J. Hunt, & B. Battrick (eds.), 1989, ESA SP-296, p. 21
- Laurent & Titarchuk (2007) Laurent, P. & Titarchuk, L. 2007, ApJ, 656, 1056
- Lavagetto et al. (2004) Lavagetto, G., et al. 2004, Nuclear Physics B Proc. Supplements, 132, 616
- Lin et al. (2009) Lin, D., Remillard, R.A. & Homan, J. 2009, ApJ, 696, 1257
- Margon et al. (1971) Margon B. et al., 1971, ApJL, 169, L45
- Mndez et al. (1999) Mndez, M., van der Klis, M., Ford, E. C., Wijnands, R., & van Paradijs, J. 1999, ApJ, 511, L49
- Middleditch & Priedhorsky (1986) Middleditch J., Priedhorsky W. C, 1986, ApJ 306, 230
- Miller et al. (1993) Miller, B. W., Margon, B., Burton, M. G., 1993, AJ, 106, 404
- Muno et al. (2002) Muno, M. P., Remillard, R. A. & Chacrabarty, D., 2002, ApJ, 568, L35
- Narayan & Heyl (2002) Narayan, R & Heyl, J.S. 2002, ApJ, 574, L139
- Oosterbroek et al. (1995) Oosterbroek, T., van der Klis M., Kuulkers, E., van Paradijs, M., & Lewin, W.H.G. 1995, A&A, 297, 141
- Oosterbroek et al. (1994) Oosterbroek, T., Lewin, W. H. G., van Paradijs, M., van der Klis M., Pennix, W. & Dotani, T. 1994, A&A, 281, 803
- Parmar et al. (1997) Parmar, A. N., et al. 1997, A&AS, 122, 309
- Penninx et al. (1993) Penninx, W., Zwarthoed, G. A. A., van Paradijs, J., et al., 1993, A&A, 267, 92
- Penninx et al. (1991) Penninx, W., Lewin, W.H.G., Tan, J., Mitsuda, K., van der Klis, M., & van Paradijs, J. 1991, MNRAS., 249, 113
- Penninx et al. (1990) Penninx, W., Lewin W. H. G., Mitsuda K., van der Klis M., Van Paradijs J., Zijlstra A. A., 1990, MNRAS 243, 114
- Ponman (1982) Ponman, T., 1982, MNRAS, 201, 769
- Psaltis et al. (1999) Psaltis, D., Belloni, T., van der Klis, M. 1999, ApJ, 520, 262
- Rappaport et al. (1971) Rappaport, S., Zaumen, W., Doxsey, R., Mayer, W., 1971, ApJ, 169, L93
- Revnivtsev et al. (1999) Revnivtsev, M., Borozdin, K., Emelyanov, A. 1999, A&A,
- Schulz et al. (1989) Schulz, N. S., Hasinger, G., Truemper, J., 1989, A&A, 225, 48
- Schulz et al. (1993) Schulz, N. S., Wijers, R. A. M. J., 1993, A&A, 273, 123 (SW93)
- Seifina, Titarchuk & Frontera (2013) Seifina, E., Titarchuk, L. & Frontera, F. 2013, ApJ, 766, (STF13)
- Seifina & Titarchuk (2012) Seifina, E. & Titarchuk, L. 2012, ApJ, 747, 99 (ST12)
- Seifina & Titarchuk (2011) Seifina, E. & Titarchuk, L. 2011, ApJ, 738, 128 (ST11)
- Seifina & Titarchuk (2010) Seifina, E. & Titarchuk, L. 2010, ApJ, 722, 586 (ST10)
- Shakura & Sunyaev (1973) Shakura, N.I., & Sunyaev, R.A. 1973, A&A, 24, 337
- Shaposhnikov & Titarchuk (2009) Shaposhnikov, N. & Titarchuk, L. 2009, ApJ, 699, 443 (ST09)
- Shirey et al. (1999) Shirey, R. E., Bradt, H. V. & Levine, A. M., 1999, ApJ, 517, 472
- Strohmayer (1998) Strohmayer, T. 1998, in American Institute of Physics Conference Series, 397 (astro-ph/9802022v1)
- Strohmayer et al. (1996) Strohmayer, T. E., Zhang, W., Swank, J. H., Smale, A., Titarchuk, L., & Day, C. 1996, ApJ, 469, L9
- Titarchuk (1994) Titarchuk L., 1994, ApJ, 434, 570
- Titarchuk et al. (2007) Titarchuk, L., Kuznetsov, S.I. & Shaposhnikov, N. 2007, ApJ, 667, 404
- Titarchuk et al. (1998) Titarchuk, L., Lapidus, I.I. & Muslimov, A. 1998, ApJ, 419, 315
- Titarchuk & Lyubarskij (1995) Titarchuk, L., & Lyubarskij, Y. 1995, ApJ, 450, 876
- Titarchuk & Osherovich (2001) Titarchuk, L. & Osherovich, V. 2001, ApJ, 555, L55
- Titarchuk & Osherovich (1999) Titarchuk, L.G. & Osherovich, V.A. 1999, ApJ, 518, L95
- Titarchuk & Seifina (2009) Titarchuk, L. & Seifina, E. 2009, ApJ, 706, 1463
- Titarchuk & Shaposhnikov (2010) Titarchuk, L. & Shaposhnikov, N. 2010, ApJ, 724, 1147 (TS10)
- Ueda et al. (2005) Ueda, Y., Mitsuda, K., Murakami, H., & Matsushita, K. 2005, ApJ, 620, 274
- van der Klis (2000) van der Klis, M. 2000, ARA&A, 38, 717
- van der Klis et al. (1997) van der Klis, M., Wijnands, R.A.D., Horne, K., & Chen, W. 1997, ApJ, 481, L97
- van der Klis et al. (1996) van der Klis, M., Swank, J. H., Zang, W., Jahoda, K, Morgan, E. H., Lewin, W H. G., Vaughan, B., & van Paradijs, 1996, ApJ, 469, L1
- van der Klis (1994) van der Klis, M., 1994, A&A, 283, 46
- van der Klis (1994a) van der Klis, M., 1994, ApJS, 92, 511
- van der Klis (1989) van der Klis, M., 1989, ARA&A 27, 51
- van der Klis et al. (1987) van der Klis M., Jansen F., Van Paradijs J., Lewin W. H. G., Sztjano M., Tr’umper J., 1987, ApJ, 313, L19
- van Paradijs at al. (1988) van Paradijs, J., Hasinger, G., Lewin, W. H. G., et al., 1988, MNRAS, 231, 379
- van Paradijs (1978) van Paradijs, J. 1978, Nature, 274, 650
- van Straaten et al. (2000) van Straaten, S., Ford, E., van der Klis, M., Mndez, M. & Kaaret, Ph. 2000, ApJ, 540, 1049
- Vrtilek et al. (1990) Vrtilek, S. D., Raymond, J. C, Garcia, M. R., Verbunt, F., Hasinger, G., Krster, M., 1990, A&A, 235, 162
- Wijnands et al. (1999) Wijnands, R., van der Klis, & Rijkhorst E. 1999, ApJ, 512, L39
- Wijnands & van der Klis (1999) Wijnands, R., & van der Klis, 1999, ApJ, 512, L39
- Wijnands & van der Klis (1998) Wijnands, R., van der Klis, M. 1998, Nature, 394, 344
- Wijnands et al. (1998) Wijnands, R. A. D. van der Klis, M., Mndez, M., van Paradijs, J., Lewin, W. H. G., Lamb, F. K., Vaughan, B. & Kuulkers, E. 1998, ApJ, 495, 39
- Wijnands et al. (1997) Wijnands, R. A. D. van der Klis, M., Kuulkers, E., Asai, K. & Hasinger, G. 1997, A&A, 323, 399
- Zang et al. (1998) Zang, W. et al. 1998, ApJ, 500, L167
- Zel’dovich & Shakura (1969) Zel’dovich, Ya. B. & Shakura N. I. 1969, Sov. Astr. 13, 175
| Number of set | Obs. ID | Start time (UT) | End time (UT) | MJD interval |
|---|---|---|---|---|
| S1 | 20261005 | 1997 Sep. 4 11:53:58 | 1997 Sep. 4 19:33:21 | 50695.5-50695.9 |
| S2 | 20261006 | 1997 Oct. 2 20:32:50 | 1997 Oct. 3 04:16:33 | 50723.8-50724.4 |
| S3 | 21240001 | 2000 Aug. 16 05:50:34 | 2000 Aug. 18 05:56:11 | 51772.2-51774.21 |
| S4 | 212400011 | 2000 Aug. 18 06:16:17 | 2000 Aug. 20 14:21:16 | 51774.2-51776.91 |
| S5 | 212400012 | 2001 March 9 19:27:20 | 2001 March 11 11:13:47 | 51977.8-51979.91 |
| S6 | 21375002 | 2001 Aug. 9 05:01:20 | 2001 Aug. 10 08:56:49 | 52130.2-52131.92 |
| Number of set | Dates, MJD | RXTE Proposal ID | Dates UT | Rem. |
|---|---|---|---|---|
| R1 | 50555 | 20054 | Apr. 17 13:40:48 – 13:08:00, 1997 | |
| R2 | 50605-50609 | 20059 | June 6 – 10, 1997 | |
| R3 | 50712-50756 | 200531 | Sept. 21 – Nov. 4, 1997 | SAX |
| R4 | 51130-51131 | 30040 | Nov. 13 – 14, 1998 | |
| R5 | 51772-51776 | 50016 | Aug. 16 – 20, 2000 | |
| R6 | 51920-51924 | 50016 | Jan. 11 – 15, 2001 | |
| R7 | 52908-52915 | 80020 | Sept. 26 – Oct. 3, 2003 | |
| R8 | 53210-53262 | 80020 | July 24 – Sept. 14, 2004 | |
| R9 | 53874-53907 | 91152 | May 19 – June 21, 2006 | |
| R10 | 54297 | 93046 | July 16 01:14:56 – 01:29:20, 2007 | |
| R11 | 54893-54894 | 94312 | March 3 – 4, 2009 |
References: (1) Church et al. (2006)
| Model | Parameter | 00-20261005 | 00-20261006 | 00-21240001 | 00-212400011 | 00-212400012 | 00-21375002 |
|---|---|---|---|---|---|---|---|
| wabs | NH (cm-2) | 6.380.09 | 6.180.16 | 6.520.13 | 6.560.09 | 6.530.09 | 6.290.09 |
| bbody | kTBB (keV) | 0.990.02 | 0.980.03 | 0.690.02 | 0.980.03 | 0.680.01 | 0.600.03 |
| N | 7.670.01 | 7.410.06 | 10.430.07 | 7.560.02 | 7.410.05 | 10.410.07 | |
| comptb | 1.020.01 | 1.000.05 | 1.090.04 | 1.020.03 | 1.030.01 | 1.080.06 | |
| kTs (keV) | 1.560.04 | 1.490.05 | 1.760.06 | 0.480.04 | 1.430.04 | 1.400.04 | |
| logA | -1.290.03 | -0.860.02 | -0.980.03 | -0.860.03 | -0.720.07 | -0.860.05 | |
| kTe (keV) | 6.210.07 | 3.980.08 | 4.890.08 | 3.620.06 | 3.980.08 | 4.980.09 | |
| N | 7.470.05 | 10.020.01 | 15.190.09 | 10.020.07 | 14.200.04 | 13.610.05 | |
| Gaussian | Eline (keV) | 6.870.06 | 6.800.08 | 6.740.07 | 7.000.06 | 6.800.06 | 6.710.05 |
| (keV) | 0.650.05 | 0.600.01 | 0.810.06 | 0.690.04 | 0.910.06 | 0.740.05 | |
| N | 0.450.02 | 0.430.06 | 0.550.07 | 0.260.07 | 0.390.07 | 0.350.08 | |
| (d.o.f.) | 3.2 (336) | 1.29 (330) | 1.59 (332) | 1.3 (332) | 1.43(332) | 2.7 (330) | |
| wabs | NH (cm-2) | 5.400.07 | 6.290.06 | 6.430.09 | 6.430.09 | 6.350.07 | 5.700.09 |
| bbody1 | kTBB1 (keV) | 0.600.08 | 0.590.04 | 0.610.05 | 0.520.06 | 0.580.08 | 0.600.02 |
| N | 2.10.1 | 7.580.03 | 7.980.09 | 7.810.06 | 8.20.1 | 3.700.09 | |
| bbody2 | kTBB2 (keV) | 1.100.03 | 1.500.06 | 1.510.02 | 1.470.04 | 1.510.02 | 1.500.04 |
| N | 2.000.07 | 6.420.5 | 9.950.08 | 7.960.09 | 6.490.08 | 4.750.09 | |
| comptb | 1.000.01 | 1.060.04 | 0.990.03 | 1.020.04 | 1.050.06 | 1.100.09 | |
| kTs (keV) | 1.210.09 | 1.200.02 | 1.260.07 | 0.180.06 | 1.200.08 | 1.190.08 | |
| logA | -1.020.06 | -0.550.02 | -0.210.03 | -0.290.02 | -1.080.06 | 2.0††† | |
| kTe (keV) | 4.660.08 | 3.510.09 | 3.540.04 | 3.350.03 | 4.330.09 | 3.320.02 | |
| N | 10.780.09 | 8.670.05 | 6.240.09 | 7.160.08 | 7.630.06 | 5.430.07 | |
| Gaussian | Eline (keV) | 6.750.08 | 6.780.09 | 6.800.07 | 6.810.05 | 6.900.07 | 6.750.05 |
| (keV) | 0.950.04 | 0.900.06 | 0.890.07 | 0.790.04 | 0.910.05 | 0.940.03 | |
| N | 2.600.05 | 0.660.09 | 0.650.08 | 0.630.06 | 0.530.07 | 0.650.09 | |
| (d.o.f.) | 3.28 (334) | 1.07 (328) | 1.53 (330) | 1.65 (330) | 1.63(330) | 2.18 (327) | |
| wabs | NH (cm-2) | 5.70.1 | 6.00.1 | 6.010.03 | 6.30.1 | 6.40.1 | 5.40.3 |
| bbody | kTBB (keV) | 0.560.08 | 0.570.04 | 0.560.03 | 0.530.05 | 0.430.04 | 0.570.01 |
| N | 0.920.09 | 0.90.1 | 0.900.05 | 0.910.04 | 4.470.02 | 2.010.06 | |
| comptb1 | 0.990.04 | 1.000.08 | 1.020.07 | 1.010.07 | 0.990.01 | 1.040.06 | |
| kTs1 (keV) | 0.700.03 | 0.60.1 | 0.690.02 | 0.700.03 | 0.830.04 | 1.030.01 | |
| logA1 | -0.320.06 | -0.300.07 | -0.300.05 | -0.300.03 | -1.420.06 | -1.330.07 | |
| kT (keV) | 5.380.02 | 5.420.03 | 5.600.04 | 5.410.04 | 6.040.03 | 19.500.07 | |
| N | 1.360.07 | 1.860.04 | 0.570.06 | 1.530.04 | 9.960.06 | 3.970.07 | |
| comptb2 | 1.010.03 | 1.040.05 | 1.010.03 | 1.050.08 | 1.060.05 | 0.990.02 | |
| kTs2 (keV) | 1.00.1 | 1.000.09 | 1.710.05 | 1.060.09 | 1.500.02 | 1.510.04 | |
| kT (keV) | 1.710.09 | 1.900.02 | 2.040.08 | 2.050.03 | 1.520.03 | 2.760.09 | |
| N | 10.840.07 | 12.170.06 | 14.260.05 | 13.110.04 | 11.790.05 | 8.200.06 | |
| Gaussian | Eline (keV) | 6.850.08 | 6.680.03 | 6.680.05 | 6.700.04 | 6.710.03 | 6.800.06 |
| N | 1.070.09 | 0.890.08 | 0.680.09 | 0.770.09 | 0.890.02 | 0.70.1 | |
| (d.o.f.) | 0.97 (332) | 0.98 (326) | 0.99 (328) | 1.38 (328) | 1.49 (328) | 1.28 (326) |
† Errors are given at the 90% confidence level. †† The normalization parameters of and components are in units of , where is the soft photon luminosity in units of 1037 erg/s, is the distance to the source in units of 10 kpc and component is in units of in line; ††† when parameter , it is fixed to a value 2.0 for the model , parameter is fixed at 2.0 for the model (see comments in the text); of component is fixed to a value 0.60 keV for the model (see comments in the text), is units of cm-2.
| Observational | MJD, | N | Eline, | (d.o.f.) | F1/F | ||||||||
|---|---|---|---|---|---|---|---|---|---|---|---|---|---|
| ID | day | keV | keV | keV | |||||||||
| 20054-04-01-000 | 50555.570 | 0.99(1) | 17.96(5) | -1.19(4) | 4.72(9) | 1.03(9) | 1.01(1) | 2.72(7) | 11.77(3) | 6.74(9) | 1.05(2) | 1.17(67) | 9.89/3.49 |
| 20059-01-01-000 | 50605.255 | 0.99(2) | 5.43(2) | -0.54(2) | 2.06(6) | 0.92(3) | 1.02(2) | 1.63(4) | 13.29(5) | 6.45(8) | 2.04(3) | 1.46(67) | 9.07/1.14 |
| 20059-01-01-01 | 50605.904 | 1.03(3) | 18.77(5) | -1.32(2) | 4.68(4) | 1.04(8) | 0.99(2) | 2.74(1) | 11.72(6) | 6.67(9) | 1.03(5) | 0.93(67) | 9.87/3.39 |
| 20059-01-01-02 | 50606.471 | 1.03(2) | 20.40(9) | -0.90(3) | 3.14(9) | 1.06(5) | 1.00(1) | 2.91(6) | 13.4(9) | 6.50(7) | 1.02(4) | 1.08(67) | 11.61/3.59 |
| 20059-01-01-03 | 50606.996 | 1.04(3) | 12.32(8) | -1.09(4) | 3.45(5) | 1.01(6) | 1.03(4) | 2.49(1) | 16.03(4) | 6.5(1) | 2.09(2) | 1.19(67) | 12.36/3.50 |
| 20059-01-01-04 | 50607.329 | 1.02(2) | 12.34(9) | -0.06(3) | 3.50(6) | 1.07(4) | 1.00(2) | 2.48(4) | 16.45(9) | 6.4(1) | 2.03(2) | 1.31(67) | 12.61/3.55 |
| 20059-01-01-05 | 50608.008 | 0.99(1) | 15.08(5) | -1.29(3) | 6.47(5) | 1.09(5) | 1.02(3) | 2.70(2) | 11.65(9) | 6.40(9) | 2.83(6) | 1.08(67) | 10.86/3.53 |
| 20059-01-01-06 | 50609.062 | 1.01(2) | 11.28(8) | -1.05(1) | 4.03(6) | 1.08(6) | 1.01(1) | 2.27(1) | 17.03(9) | 6.5(1) | 2.29(8) | 0.94(67) | 11.70/2.71 |
| 20053-05-01-00 | 50712.048 | 1.02(3) | 4.01(9) | -0.42(5) | 2.88(9) | 0.92(7) | 0.98(3) | 2.18(3) | 8.67(8) | 6.74(3) | 0.75(7) | 0.84(67) | 10.58/1.56 |
| 20053-05-01-01 | 50714.179 | 1.06(4) | 3.12(4) | -0.11(2) | 2.05(6) | 0.92(2) | 1.01(1) | 1.85(2) | 10.1(1) | 6.41(8) | 2.31(6) | 0.97(67) | 10.00/1.88 |
| 20053-05-01-02 | 50716.066 | 1.02(2) | 16.65(4) | -1.20(3) | 4.76(5) | 1.03(9) | 1.02(3) | 2.69(1) | 12.55(4) | 6.7(1) | 1.03(9) | 1.09(67) | 10.52/3.47 |
| 20053-05-01-03 | 50920.197 | 1.05(3) | 12.96(9) | -1.08(4) | 3.62(9) | 1.01(8) | 1.01(5) | 2.59(7) | 13.11(6) | 6.4(1) | 2.1(1) | 0.94(67) | 10.51/3.12 |
| 20053-05-02-00 | 50753.947 | 0.99(1) | 4.43(5) | -0.56(1) | 2.04(2) | 0.92(1) | 1.04(3) | 1.56(8) | 16.35(1) | 6.62(2) | 0.70(4) | 1.12(67) | 9.42/1.14 |
| 20053-05-02-01 | 50754.091 | 0.99(2) | 10.09(8) | -1.14(3) | 5.31(3) | 1.07(5) | 1.02(2) | 2.26(2) | 12.80(9) | 6.57(9) | 2.28(5) | 1.07(67) | 10.82/2.29 |
| 20053-05-02-02 | 50754.825 | 1.02(2) | 12.30(9) | -1.08(4) | 3.38(6) | 1.0(1) | 1.01(3) | 2.48(1) | 15.98(8) | 6.36(9) | 2.09(9) | 0.93(67) | 12.37/3.39 |
| 20053-05-02-03 | 50755.133 | 1.03(2) | 11.34(8) | -1.09(3) | 3.41(5) | 1.07(5) | 1.03(4) | 2.45(2) | 15.54(7) | 6.47(8) | 2.08(4) | 0.89(67) | 12.04/3.19 |
| 20053-05-02-05 | 50756.680 | 1.01(1) | 17.85(4) | -1.21(2) | 4.76(7) | 1.04(8) | 1.03(5) | 2.71(2) | 11.71(3) | 6.8(1) | 1.06(5) | 0.89(67) | 9.89/3.28 |
| 20053-05-02-04 | 50756.685 | 1.05(4) | 12.94(5) | -1.08(4) | 3.40(8) | 1.0(1) | 0.99(6) | 2.54(1) | 15.81(4) | 6.42(9) | 2.04(9) | 0.91(67) | 12.23/3.57 |
| 30040-04-01-00 | 51130.995 | 1.04(2) | 16.87(4) | -1.46(3) | 6.23(7) | 1.04(6) | 1.00(2) | 2.69(3) | 12.03(8) | 6.45(2) | 2.18(2) | 0.86(67) | 10.19/3.39 |
| 30040-04-01-06 | 51131.435 | 1.02(2) | 17.78(9) | -0.99(6) | 4.79(6) | 1.09(8) | 1.02(3) | 2.71(2) | 11.31(5) | 6.70(9) | 1.03(4) | 1.02(67) | 9.70/3.48 |
| 30040-04-01-01 | 51131.601 | 1.02(3) | 18.67(8) | -1.34(2) | 4.70(8) | 1.08(7) | 1.02(3) | 2.78(3) | 10.71(4) | 6.70(8) | 1.03(2) | 1.06(67) | 9.18/3.24 |
| 30040-04-01-020 | 51131.877 | 1.00(1) | 19.65(7) | -1.24(4) | 5.01(6) | 1.09(8) | 1.01(1) | 2.70(1) | 11.83(3) | 6.70(9) | 1.05(3) | 0.96(67) | 9.99/3.38 |
| 30040-04-01-03 | 51132.596 | 1.02(2) | 12.73(2) | -1.05(2) | 3.48(3) | 1.03(7) | 1.01(2) | 2.39(2) | 16.86(4) | 6.47(6) | 2.24(2) | 0.96(67) | 12.91/3.32 |
| 30040-04-01-05 | 51132.829 | 1.05(3) | 12.91(8) | -1.08(4) | 3.45(9) | 1.04(9) | 1.03(3) | 2.50(1) | 16.03(5) | 6.40(1) | 2.08(1) | 1.00(67) | 13.27/3.72 |
| 30040-04-01-04 | 51132.881 | 1.01(1) | 12.93(1) | -1.07(1) | 3.33(5) | 1.03(8) | 1.02(4) | 2.51(2) | 16.68(9) | 6.40(6) | 2.14(2) | 0.96(67) | 12.67/3.49 |
| 50016-01-01-11 | 51772.077 | 0.99(2) | 12.91(4) | -1.08(4) | 3.40(7) | 1.06(3) | 0.99(3) | 2.49(1) | 16.51(5) | 6.4(1) | 2.95(3) | 0.71(67) | 13.24/3.96 |
| 50016-01-01-12 | 51772.144 | 1.04(4) | 11.8(1) | -1.10(7) | 3.5(1) | 1.01(4) | 1.01(2) | 2.4(1) | 17.29(9) | 6.41(7) | 2.18(4) | 1.03(67) | 13.11/3.42 |
| 50016-01-01-000 | 51772.210 | 0.99(2) | 12.72(9) | -1.04(2) | 3.39(9) | 1.04(9) | 1.03(4) | 2.45(3) | 16.55(8) | 6.70(9) | 0.80(5) | 1.02(67) | 12.69/3.43 |
| 50016-01-01-01 | 51772.708 | 1.01(2) | 12.28(8) | -1.09(2) | 3.49(5) | 1.04(8) | 0.98(4) | 2.39(1) | 17.34(5) | 6.4(1) | 2.62(6) | 1.12(67) | 13.08/3.52 |
| 50016-01-01-10 | 51772.742 | 1.01(1) | 12.96(2) | -1.08(4) | 3.35(7) | 1.02(3) | 0.99(1) | 2.54(2) | 16.19(8) | 6.42(9) | 2.89(2) | 1.01(67) | 12.50/3.73 |
| 50016-01-01-07 | 51773.012 | 1.02(2) | 11.06(9) | -1.06(7) | 4.0(1) | 1.01(6) | 1.01(2) | 2.29(1) | 19.4(1) | 6.53(8) | 2.29(5) | 0.76(67) | 12.83/3.10 |
| 50016-01-01-02 | 51773.082 | 1.04(3) | 12.9(1) | -1.08(6) | 3.48(9) | 1.04(9) | 1.01(1) | 2.45(5) | 17.31(6) | 6.40(7) | 2.16(7) | 0.76(67) | 13.11/3.75 |
| 50016-01-01-03 | 51773.146 | 1.02(2) | 12.3(1) | -1.02(3) | 3.39(4) | 1.32(5) | 1.05(4) | 2.45(9) | 17.46(5) | 6.70(8) | 2.94(5) | 0.87(67) | 12.72/3.81 |
| 50016-01-01-04 | 51773.211 | 1.01(1) | 12.26(9) | -1.10(2) | 3.47(5) | 1.33(9) | 1.04(3) | 2.46(7) | 17.67(8) | 6.64(9) | 2.90(4) | 0.76(67) | 12.76/3.77 |
| 50016-01-01-05 | 51773.281 | 0.99(2) | 13.0(1) | -1.06(2) | 4.49(3) | 1.02(8) | 1.05(4) | 2.46(1) | 17.41(9) | 6.40(5) | 2.79(5) | 1.16(67) | 12.61/3.71 |
| 50016-01-01-09 | 51773.362 | 1.02(3) | 11.09(3) | -1.13(1) | 5.6(1) | 1.12(6) | 1.01(1) | 2.32(2) | 14.31(9) | 6.54(9) | 2.09(2) | 1.07(67) | 11.47/2.69 |
| 50016-01-01-06 | 51773.619 | 0.99(1) | 10.0(2) | -1.14(9) | 5.5(1) | 1.05(2) | 1.00(3) | 2.22(3) | 12.51(3) | 6.6(1) | 2.15(3) | 1.06(67) | 10.65/2.23 |
| 50016-01-01-08 | 51773.939 | 1.05(4) | 9.2(1) | -1.13(4) | 5.4(1) | 1.1(1) | 1.03(4) | 2.13(9) | 13.3(1) | 6.5(1) | 2.39(9) | 1.24(67) | 10.82/2.09 |
| 50016-01-02-00 | 51774.005 | 1.02(2) | 5.42(4) | -0.99(3) | 1.39(8) | 0.92(4) | 0.99(2) | 1.52(2) | 15.5(1) | 6.87(9) | 0.56(3) | 1.39(67) | 9.25/0.98 |
| 50016-01-02-18 | 51774.075 | 1.05(6) | 3.30(5) | -0.32(2) | 1.31(9) | 0.92(9) | 0.99(1) | 1.52(3) | 15.92(8) | 6.89(4) | 0.56(3) | 1.28(67) | 9.04/0.99 |
| 50016-01-02-05 | 51774.138 | 1.01(2) | 2.8(1) | -1.08(2) | 3.5(1) | 1.1(1) | 0.99(3) | 1.55(1) | 13.05(7) | 6.39(5) | 1.90(4) | 1.26(67) | 9.56/1.04 |
| 50016-01-02-03 | 51774.204 | 0.99(1) | 3.67(6) | -0.97(6) | 1.32(8) | 0.93(8) | 1.02(2) | 1.51(2) | 17.5(1) | 6.89(4) | 0.59(5) | 1.27(67) | 9.64/1.04 |
| 50016-01-02-16 | 51774.270 | 1.01(3) | 3.34(3) | -0.11(3) | 1.39(7) | 0.91(4) | 1.01(1) | 1.70(8) | 15.60(9) | 6.67(5) | 0.57(9) | 1.22(67) | 8.89/1.32 |
| 50016-01-02-04 | 51774.574 | 1.01(2) | 12.9(1) | -1.08(2) | 3.5(1) | 1.1(1) | 0.99(4) | 2.46(1) | 15.23(6) | 6.40(6) | 2.86(4) | 0.99(67) | 12.38/3.51 |
| 50016-01-02-12 | 51774.704 | 0.99(1) | 11.04(3) | -1.05(4) | 4.08(9) | 1.01(7) | 1.01(3) | 2.36(2) | 16.94(5) | 6.33(5) | 4.28(5) | 0.95(67) | 11.47/2.87 |
| 50016-01-02-17 | 51775.001 | 1.02(2) | 11.07(9) | -1.13(5) | 5.49(7) | 1.06(3) | 1.00(1) | 2.4(1) | 14.82(6) | 6.58(6) | 2.94(8) | 0.98(67) | 11.88/2.94 |
| 50016-01-02-02 | 51775.067 | 1.07(6) | 11.1(1) | -1.08(2) | 4.02(8) | 1.9(1) | 1.01(2) | 2.4(1) | 16.41(8) | 6.38(7) | 3.10(1) | 0.97(67) | 12.54/3.18 |
| 50016-01-02-07 | 51775.200 | 1.02(2) | 11.08(9) | -1.05(4) | 4.18(9) | 1.07(9) | 1.00(3) | 2.3(1) | 16.53(8) | 6.37(4) | 2.02(3) | 1.03(67) | 12.02/3.05 |
| 50016-01-02-06 | 51775.267 | 1.04(3) | 11.1(1) | -1.12(3) | 4.87(2) | 1.00(1) | 1.02(2) | 2.39(9) | 14.45(6) | 6.56(3) | 2.08(2) | 1.02(67) | 11.17/2.62 |
| 50016-01-02-15 | 51775.533 | 1.00(1) | 12.9(1) | -1.09(1) | 3.49(9) | 1.02(3) | 1.05(5) | 2.45(6) | 15.56(3) | 6.42(7) | 2.06(3) | 0.97(67) | 11.99/3.32 |
| 50016-01-02-08 | 51775.734 | 1.05(4) | 12.87(8) | -1.08(5) | 3.41(5) | 1.03(2) | 0.99(3) | 2.49(1) | 15.52(8) | 6.45(4) | 2.88(4) | 0.99(67) | 12.02/3.40 |
| 50016-01-02-10 | 51775.998 | 1.00(1) | 12.9(1) | -1.07(4) | 3.52(9) | 1.07(5) | 1.06(4) | 2.39(2) | 15.15(8) | 6.40(5) | 2.49(5) | 0.94(67) | 12.31/3.39 |
| 50016-01-02-09 | 51776.064 | 1.01(2) | 12.84(9) | -1.06(5) | 3.34(7) | 1.0(1) | 0.99(3) | 2.41(1) | 17.31(9) | 6.40(6) | 2.69(3) | 0.99(67) | 12.42/3.37 |
| 50016-01-02-13 | 51776.131 | 1.02(3) | 11.07(8) | -1.13(7) | 5.58(9) | 1.06(4) | 1.01(5) | 2.31(3) | 14.21(9) | 6.6(1) | 2.75(4) | 1.20(67) | 11.53/2.72 |
| 50016-01-02-11 | 51776.529 | 0.99(2) | 3.24(2) | -0.38(6) | 2.07(9) | 0.92(6) | 1.03(4) | 1.94(8) | 10.23(7) | 6.43(7) | 2.31(9) | 0.92(67) | 9.10/1.59 |
| 50016-01-02-01 | 51776.680 | 1.01(2) | 4.12(4) | -0.46(3) | 2.01(7) | 0.9(1) | 1.02(3) | 1.8(1) | 11.1(1) | 6.35(6) | 2.26(3) | 1.16(67) | 8.85/1.34 |
| 50016-01-04-01G | 51920.397 | 1.01(1) | 18.81(9) | -1.81(5) | 4.78(8) | 1.02(4) | 1.01(2) | 2.9(1) | 11.24(9) | 6.7(1) | 1.08(5) | 0.87(67) | 9.28/3.61 |
| 50016-01-04-00 | 51920.705 | 1.03(4) | 15.92(5) | -1.64(3) | 6.26(9) | 1.08(9) | 0.99(1) | 2.69(9) | 13.71(9) | 6.41(4) | 2.10(3) | 1.03(67) | 11.64/3.78 |
| 50016-01-03-11 | 51921.001 | 0.99(2) | 12.94(7) | -1.07(9) | 3.47(9) | 1.03(4) | 1.01(2) | 2.49(1) | 16.27(5) | 6.46(5) | 2.14(4) | 1.12(67) | 12.47/3.61 |
| 50016-01-03-12 | 51921.317 | 0.99(3) | 11.79(4) | -1.08(5) | 5.12(8) | 1.06(1) | 1.00(1) | 2.33(4) | 15.54(4) | 6.53(5) | 2.29(3) | 0.69(67) | 12.23/2.98 |
| 50016-01-04-02 | 51921.384 | 1.02(2) | 4.35(2) | -0.45(4) | 2.05(7) | 0.93(3) | 1.01(2) | 1.65(5) | 13.2(1) | 6.50(2) | 2.08(5) | 0.97(67) | 8.92/1.24 |
| 50016-01-03-02 | 51921.700 | 0.98(2) | 3.44(3) | -0.36(2) | 2.19(9) | 0.92(4) | 0.98(2) | 1.68(1) | 14.09(8) | 6.49(5) | 2.11(2) | 1.12(67) | 9.79/1.41 |
| 50016-01-03-01 | 51922.039 | 1.01(1) | 3.08(9) | -0.07(5) | 3.17(9) | 1.04(5) | 0.97(4) | 2.42(2) | 17.68(5) | 6.46(4) | 2.00(3) | 1.18(67) | 10.01/2.09 |
| 50016-01-03-13 | 51922.312 | 1.03(5) | 11.3(1) | -1.14(9) | 3.39(8) | 1.07(6) | 1.03(4) | 2.62(8) | 12.51(9) | 6.54(7) | 1.01(2) | 0.79(67) | 10.84/1.96 |
| 50016-01-03-00 | 51922.379 | 1.05(4) | 5.42(2) | -0.69(3) | 2.06(7) | 0.95(5) | 1.01(2) | 1.58(1) | 13.34(7) | 6.7(1) | 0.73(5) | 1.48(67) | 8.52/1.02 |
| 50016-01-03-14 | 51922.648 | 1.04(3) | 8.40(3) | -1.32(6) | 1.92(6) | 0.96(2) | 0.99(1) | 1.55(4) | 14.50(8) | 6.71(7) | 0.77(8) | 1.28(67) | 8.47/0.91 |
| 50016-01-03-03 | 51922.702 | 1.05(4) | 4.04(9) | -0.41(5) | 2.09(5) | 0.92(3) | 0.98(4) | 1.84(2) | 12.08(9) | 6.42(5) | 2.31(2) | 1.05(67) | 9.49/1.54 |
| 50016-01-03-040 | 51922.733 | 1.01(1) | 11.80(3) | -1.14(2) | 5.43(6) | 1.04(7) | 1.02(3) | 2.29(3) | 14.19(2) | 6.50(5) | 2.03(3) | 0.83(67) | 11.37/2.62 |
| 50016-01-03-05 | 51923.383 | 1.09(2) | 17.67(7) | -1.55(6) | 4.7(1) | 1.06(5) | 0.99(2) | 2.80(1) | 12.43(7) | 6.73(4) | 1.03(1) | 0.90(67) | 10.30/3.28 |
| 50016-01-03-06 | 51923.628 | 1.03(3) | 19.91(2) | -1.02(3) | 3.08(9) | 3.07(3) | 1.00(1) | 2.74(2) | 10.25(4) | 6.40(5) | 3.90(2) | 0.97(67) | 9.23/3.51 |
| 50016-01-03-070 | 51923.694 | 1.02(2) | 17.26(3) | -1.51(4) | 4.69(8) | 1.05(3) | 1.02(2) | 2.76(1) | 12.97(3) | 6.72(6) | 1.01(4) | 1.02(67) | 10.65/3.76 |
| 50016-01-03-09 | 51924.299 | 1.05(6) | 17.10(6) | -1.34(5) | 4.67(6) | 1.06(2) | 1.03(2) | 2.66(3) | 14.76(7) | 6.71(5) | 0.98(3) | 1.16(67) | 11.80/4.01 |
| 50016-01-03-10 | 51924.365 | 1.01(1) | 12.52(6) | -1.07(3) | 3.12(9) | 1.03(4) | 1.02(2) | 2.44(1) | 17.67(6) | 6.40(5) | 2.17(3) | 1.00(67) | 12.44/3.29 |
| 50016-01-03-08 | 51924.583 | 1.03(3) | 17.51(8) | -1.59(6) | 4.79(6) | 0.99(20 | 0.99(1) | 2.8(1) | 12.11(8) | 6.71(7) | 1.08(2) | 0.79(67) | 10.03/3.67 |
| 80020-02-01-00 | 52908.041 | 1.01(1) | 12.92(9) | -1.07(8) | 3.40(5) | 1.03(9) | 1.01(2) | 2.44(1) | 13.08(9) | 6.41(2) | 2.97(3) | 0.98(67) | 10.32/2.84 |
| 80020-02-01-01 | 52908.109 | 1.00(1) | 12.25(6) | -1.05(3) | 3.39(7) | 1.07(8) | 1.03(4) | 2.42(1) | 13.76(6) | 6.43(2) | 2.98(2) | 0.94(67) | 10.09/2.63 |
| 80020-02-02-00 | 52914.565 | 1.02(2) | 4.24(6) | -0.53(5) | 2.08(6) | 0.92(5) | 1.01(1) | 1.67(2) | 10.04(5) | 6.24(9) | 2.31(5) | 0.89(67) | 7.23/1.04 |
| 80020-02-02-01 | 52914.941 | 1.05(4) | 12.93(8) | -1.08(4) | 3.45(5) | 1.02(8) | 0.99(2) | 2.48(6) | 12.91(4) | 6.42(9) | 2.94(3) | 1.07(67) | 10.24/2.92 |
| 80020-02-02-02 | 52915.008 | 1.03(2) | 11.02(4) | -1.13(7) | 5.56(4) | 1.01(7) | 0.99(1) | 2.31(7) | 11.68(6) | 6.50(9) | 2.28(2) | 1.02(67) | 9.35/2.23 |
| 80020-02-04-00 | 53210.048 | 1.01(2) | 12.94(7) | -1.08(7) | 3.47(6) | 1.05(6) | 0.98(2) | 2.53(6) | 14.38(4) | 6.45(3) | 2.82(7) | 1.33(67) | 11.26/3.29 |
| 80020-02-05-00 | 53222.037 | 1.07(5) | 9.79(5) | -1.12(1) | 4.05(4) | 1.03(7) | 1.05(4) | 2.12(2) | 12.06(8) | 6.51(9) | 2.96(3) | 1.06(67) | 9.61/1.85 |
| 80020-02-06-00 | 53238.305 | 1.04(4) | 18.96(8) | -1.08(5) | 3.43(5) | 1.04(8) | 1.01(3) | 2.51(4) | 14.07(7) | 6.40(9) | 2.73(2) | 1.36(67) | 11.07/3.18 |
| 80020-02-07-00 | 53245.879 | 1.03(2) | 10.14(9) | -1.13(2) | 4.51(9) | 1.08(7) | 1.04(5) | 2.24(2) | 14.14(5) | 6.53(9) | 2.01(2) | 1.20(67) | 9.85/2.16 |
| 80020-02-08-00 | 53255.234 | 0.98(5) | 20.53(2) | -0.91(3) | 3.06(8) | 1.07(6) | 1.02(2) | 3.00(1) | 9.13(6) | 6.39(7) | 1.67(3) | 1.37(67) | 7.43/3.32 |
| 80020-02-09-00 | 53262.321 | 0.99(2) | 11.23(8) | -1.13(4) | 5.43(4) | 1.04(9) | 1.02(3) | 2.31(1) | 13.97(9) | 6.51(8) | 2.25(5) | 1.10(67) | 10.76/2.51 |
| 94312-01-01-00 | 54893.348 | 1.01(4) | 17.84(8) | -1.63(9) | 4.73(8) | 1.0(1) | 1.01(1) | 2.95(2) | 9.46(9) | 6.70(8) | 0.93(4) | 1.14(67) | 8.48/2.96 |
| 94312-01-01-02 | 54894.766 | 0.99(2) | 14.01(9) | -1.02(5) | 5.15(7) | 1.06(9) | 1.02(4) | 2.69(3) | 11.53(8) | 6.46(6) | 2.86(5) | 1.16(67) | 10.53/3.46 |
| 94312-01-01-04 | 54894.895 | 1.10(9) | 12.54(8) | -1.07(3) | 3.46(5) | 1.1(1) | 1.01(5) | 2.44(1) | 14.15(4) | 6.40(7) | 2.69(2) | 1.17(67) | 10.38/2.60 |
| 93046-04-01-00 | 54297.052 | 1.02(5) | 11.02(9) | -1.05(2) | 4.03(9) | 1.02(6) | 1.00(2) | 2.39(1) | 12.58(7) | 6.3(1) | 0.9(1) | 1.13(67) | 9.07/2.21 |
| 91152-03-01-000 | 53874.858 | 0.99(2) | 9.02(8) | -1.04(6) | 4.6(1) | 1.05(9) | 1.02(6) | 2.28(4) | 10.57(9) | 6.58(5) | 2.72(6) | 1.30(67) | 9.57/1.90 |
| 91152-03-02-00 | 53907.403 | 1.05(4) | 10.11(1) | -1.10(5) | 4.5(1) | 1.07(4) | 1.01(5) | 2.21(1) | 10.9(1) | 6.53(9) | 2.23(1) | 1.16(67) | 9.14/1.92 |
| 91152-03-02-01 | 53907.680 | 1.01(1) | 11.0(1) | -1.06(9) | 4.03(7) | 1.06(5) | 1.03(4) | 2.29(2) | 15.74(5) | 6.43(8) | 2.38(3) | 0.98(67) | 10.25/2.56 |
† The spectral model is ;color temperature of component is fixed at 0.6 keV and “seed” photon temperatures / are fixed at 1.1/1.5 keV, respectively (see comments in the text); †† parameter is fixed at 2.0 (see comments in the text), ††† normalization parameters of and components are in units of , where is the source luminosity in units of 1037 erg/s, is the distance to the source in units of 10 kpc and component is in units of in line , of Gaussian component is fixed to a value 0.6 keV (see comments in the text), was fixed at value of 6.2 cm-2 (Iaria et al., 2006), ††††spectral fluxes (F1/F2) in units of ergs/s/cm2 for (3 – 10) and (10 – 50) keV energy ranges respectively.
| Source | Alternative | Class3 | Distance, | Presence of | , | ||||
|---|---|---|---|---|---|---|---|---|---|
| name | name | kpc | kHz QPO | keV | keV | keV | |||
| 4U 1642-45 | GX 340+0 | Z, Sp, B | 10.54 | +7 | 3-21 | 0.08-0.2 | 0.6 | 1.1-1.5 | 0.01-0.5 |
| 4U 1744-26 | GX 3+1 | Atoll, Sp, B | 4.55 | none8 | 2.3-4.5 | 0.04-0.15 | 0.6 | 1.16-1.7 | 0.2-0.9 |
| 4U 1728-34 | GX 354-0 | Atoll, Su, D | 4.2-6.46 | +9 | 2.5-15 | 0.02-0.09 | 0.6-0.7 | 1.3 | 0.5-1 |
References: (1) ST12, (2) ST11, (3) Classification of the system in the various schemes (see text): Sp = supercritical, Su = subcritical, B = bulge, D = disk, (4) Fender & Henry (2000), Ford et al. (1998), Christian & Swank (1997), (5) Kuulkers & van der Klis (2000), Ford et al. (2000), (6) van Paradijs (1978), (7) Jonker et al. (1998), (8) Strohmayer (1998), (9) Titarchuk & Osherovich (1999)