The UV and X-ray activity of the M dwarfs within pc of the Sun
Abstract
M dwarfs are the most numerous stars in the Galaxy. They are characterized by strong magnetic activity. The ensuing high-energy emission is crucial for the evolution of their planets and the eventual presence of life on them. We systematically study the X-ray and ultraviolet emission of a subsample of M dwarfs from a recent proper-motion survey, selecting all M dwarfs within pc to obtain a nearly volume-limited sample ( % completeness). Archival ROSAT, XMM-Newton and GALEX data are combined with published spectroscopic studies of H emission and rotation to obtain a broad picture of stellar activity on M dwarfs. We make use of synthetic model spectra to determine the relative contributions of photospheric and chromospheric emission to the ultraviolet flux. We also analyse the same diagnostics for a comparison sample of young M dwarfs in the TW Hya association ( Myrs). We find that generally the emission in the GALEX bands is dominated by the chromosphere but the photospheric component is not negligible in early-M field dwarfs. The surface fluxes for the H, near-ultraviolet, far-ultraviolet and X-ray emission are connected via a power law dependence. We present here for the first time such flux-flux relations involving broad-band ultraviolet emission for M dwarfs. Activity indices are defined as flux ratio between the activity diagnostic and the bolometric flux of the star in analogy to the Ca II index. For given spectral type these indices display a spread of dex which is largest for M4 stars. Strikingly, at mid-M spectral types the spread of rotation rates is also at its highest level. The mean activity index for fast rotators, likely representing the saturation level, decreases from X-rays over the FUV to the NUV band and H, i.e. the fractional radiation output increases with atmospheric height. The comparison to the ultraviolet and X-ray properties of TW Hya members shows a drop of nearly three orders of magnitude for the luminosity in these bands between Myr and few Gyrs age. A few young field dwarfs ( Gyr) in the pc sample bridge the gap indicating that the drop in magnetic activity with age is a continuous process. The slope of the age decay is steeper for the X-ray than for the UV luminosity.
keywords:
ultraviolet: stars – X-rays: stars – stars: activity – stars: late-type1 Introduction
Research on M dwarfs has become of central interest for astronomy, partly motivated by their importance as hosts of habitable planets (Tarter et al., 2007). Understanding the evolution of planets on M dwarfs and their potential for hosting life requires good knowledge of the stellar properties, and in particular of the phenomena related to magnetic activity. The fact that the habitable zone (HZ) of planets is closer to the star for M stars with respect to earlier spectral types implies that planets in the HZ of M stars receive enhanced high-energy radiation. The stellar emission from the ultraviolet (UV) to the X-ray regime has been recognized to (i) critically affect planet evolution and (ii) influence the chemistry in the planet atmospheres in a way that is crucial for life.
(i) X-ray ( Å) and EUV ( Å) radiation lead to heating and expansion of a hydrogen-rich planet atmosphere which may become unstable and evaporate (e.g. Lammer et al., 2003; Cecchi-Pestellini et al., 2009). Hydrodynamic models for the Earth thermosphere show that strong EUV radiation of the early Sun may have been able to induce atmospheric blow-off (Tian et al., 2008). The amount by which the planet mass is reduced over time by atmospheric escape clearly depends on the radiation input and its time evolution.
(ii) As a consequence of the exposure to strong and variable high-energy radiation from the host star the liquid-water HZs defined in Kasting et al. (1993) may not necessarily be ‘habitable’. The most biologically relevant high-energy emission is the near-UV range ( Å). The appropriate amount of near-UV radiation for a HZ is confined between a minimum flux required for biochemical processes to take place and a maximum flux that prevents damage to biological systems (Buccino et al., 2007). The far-UV ( Å) is also important for photochemistry on exoplanets (Segura et al., 2005).
To date any quantitative evaluation of the evolution of the planets of M dwarfs and the possibility of the existence of life on them is hampered by the poorly constrained knowledge on the spectral energy distribution of the stellar high-energy radiation, the range of activity levels in M dwarfs and their evolution in time.
The coronal X-ray emission of nearby dMe (flare) stars has been intensively studied since the beginning of X-ray astronomy (Kahn et al., 1979; Schmitt & Rosso, 1988). The relation between X-ray and bolometric luminosity, , was observed to saturate at a level of for the most active stars with a downward spread of dex. The strength of the X-ray emission has also been known for a while to be correlated with the equivalent width of H emission (Hawley et al., 1996), a tracer for magnetic activity in the chromosphere. M stars have little photospheric flux at UV and shorter wavelengths. Their UV emission is almost entirely produced in the chromosphere and transition region. In practice, very little is known on the UV properties of late-type stars in general and of M dwarfs in particular, as the UV is one of the least explored wavelength ranges in astronomy because of the strong interstellar absorption in this band.
As a result of our scarse knowledge on the UV emission of M dwarfs, for given planetary systems vastly different mass loss histories have been predicted depending on the assumptions of the X-ray and EUV flux (e.g. Penz & Micela, 2008; Lecavelier Des Etangs, 2007). Similarly, the chemistry of exoplanet atmospheres and their suitability for sustaining life is hard to determine without a good understanding of the incidence of stellar X-ray and UV radiation; e.g., Smith et al. (2004). The few available observations indicate that active M dwarfs outshine the Sun at far-UV wavelengths (Segura et al., 2005). However, these active flare stars are not representative for the whole class of M dwarfs and virtually nothing is known about the UV emission of weakly active M dwarfs.
Until recently, the most extensive data base for stellar UV emission was the IUE archive (Byrne et al., 1980). As a result of the limitations of the available instrumentation, it remains unclear what are the relative contributions of the continuum and of the emission lines to the quiescent stellar UV radiation of M dwarfs. Hubble Space Telescope (HST) STIS studies of individual flare stars have revealed rich emission line spectra but could not detect any UV continuum emission (Pagano et al., 2000; Osten et al., 2006; Hawley et al., 2007). The Galaxy Evolution Explorer (GALEX) has opened a new opportunity for studying near- and far-UV emission of astrophysical sources (Martin et al., 2005). According to the above-mentioned spectroscopic studies, the GALEX far-UV band is dominated by emission lines formed in the transition region such as the Si IV Å and C IV Å doublets and He II Å. The GALEX near-UV band is dominated by iron lines. The by far strongest near-UV emission feature, Mg II Å, is at the border of the GALEX near-UV band where filter transmission is low such that the major part of this emission feature is lost.
In spite of the fact that the GALEX satellite is dedicated to extragalactic astronomy, its large potential for stellar studies has already been demonstrated. In a serendipitous observation of the flare star GJ 3685 A, a large flare was observed in both the near-UV and the far-UV bands (Robinson et al., 2005). UV variability on other stars was discussed by Welsh et al. (2006, 2007). GALEX observations have also been proposed as a tool for identifying M stars in nearby clusters (Browne et al., 2009) and young associations (Rodriguez et al., 2011; Shkolnik et al., 2011). Finally, the UV activity of solar-type stars has been studied by Findeisen et al. (2011) based on GALEX and Ca II H+K measurements.
In this paper we examine the UV/X-ray connection of the nearest M dwarfs by means of a statistical study combining UV measurements from GALEX with X-ray data from ROSAT and XMM-Newton. This dataset is complemented by published spectroscopy yielding H emission and . The latter is a proxy for the efficiency of the stellar dynamo that drives magnetic activity. The sample and the data are introduced in Sect. 2. The activity diagnostics derived from these data are described in Sect. 3. The characteristics of the sample’s activity are presented in Sect. 4. Sect. 5 comprises a summary of the results and our conclusions.
2 Sample and catalog
Our sample is based on the All-Sky Catalog of bright M dwarfs published by Lépine & Gaidos (2011), henceforth referred to as LG11. This catalog comprises 8889 stars selected from the SUPERBLINK proper motion survey using as criteria high proper motion (), colors typical for M dwarfs () and a magnitude cutoff (). Giant stars have been eliminated using cuts in absolute magnitude and reduced proper motion. We refer to LG11 for details.
We have selected all stars from LG11 within pc. Within this distance all stars in the catalog have trigonometric parallaxes and the majority have an entry in the Catalog of Nearby Stars, CNS 3 (Gliese & Jahreiss, 1995).
LG11 provide optical magnitudes from Tycho, optical photographic magnitudes from the USNO-B1.0 catalog (Monet et al., 2003), and near-infrared (NIR) magnitudes from 2 MASS (Cutri et al., 2003). They also list X-ray counterparts from the ROSAT All Sky Survey (RASS) and far-UV and near-UV counterparts from GALEX. The positions used by LG11 are the ICRS coordinates for the 2000.0 epoch and have been extrapolated from the Hipparcos catalog where available (van Leeuwen, 2007) and from 2 MASS for the remaining objects. This implies that due to the considerable proper motion of these nearby stars the cross-correlation with the RASS and GALEX catalogs is not complete even more so as relatively small match radii were used by LG11 ( for the RASS and for GALEX). We have matched the coordinates given by LG11 with various catalogs taking into account the proper motion. As the proper motion correction of the coordinates depends on the observing date which is not known a priori this is a two-step procedure the details of which are given below. Briefly summarized, in the first step, we searched for counterparts in a given catalog using a large match radius (on the order of ). Then we extracted the observing date for the identified counterparts, we calculated the expected coordinates at that date and repeated the cross-correlation with a smaller match radius corresponding to the positional precision of the instrument. All matches and table handling was performed with the Virtual Observatory tool TOPCAT (Taylor, 2005).
2.1 Photometry
2.1.1 X-rays
We searched for X-ray counterparts to the M dwarfs using the RASS Bright Source Catalog (BSC), the RASS Faint Source Catalog (FSC), the Second ROSAT Source Catalog of Pointed Observations (2RXP), and the XMM-Newton Serendipitous Source Catalog released in 2010 (2XMMi-DR3).
The initial match radius for the RASS catalogs is motivated by the maximum proper motion expected for any of our targets within the approximately ten years between the RASS and the epoch 2000.0. The coordinates of all sample stars that present a RASS counterpart after this step are extrapolated back to Oct 1, 1990, representative for the observing date of the RASS which lasted from Aug - Dec 1990. The subsequent refined cross-match is performed with a radius of (Neuhäuser et al., 1995). With this procedure all X-ray identifications provided by LG11 for the 163 sample stars were recovered. Moreover, an additional X-ray counterparts not listed as X-ray sources in LG11 were identified this way in the RASS.
For the cross-correlation of the pointed X-ray catalogs, 2RXP and 2XMMi-DR3, we performed the proper motion correction of the coordinates individually for each object and for the given observation date. For the rest, we proceeded in the same way as for the RASS. The final match radius for the 2RXP is again as found to be appropriate for pointed PSPC observations by Stelzer & Neuhäuser (2001). This way we identified of the stars as pointed ROSAT sources. Sixteen of them were not listed as X-ray emitters by LG11 and of them are not detected in the RASS. The majority are located within of the optical/NIR position and the maximum displacement is .
In an analogous way, stars are identified in the 2XMMi-DR3. Although we permitted a rather large match radius of after the proper motion correction all XMM-Newton counterparts are within of the expected optical coordinates. For one star with two XMM-Newton identifications at similar separation from the optical source () we retained the one from the observation with longer exposure time. Only two stars with XMM-Newton detection are not detected in any of the ROSAT catalogs. These two are actually one XMM-Newton source identified with two optical objects, PM I23318+1956 E + Wn (Gl 896 A+B).
To summarize, of M dwarfs within 10 pc have an X-ray counterpart, i.e. there are % more identifications than presented by LG11.
2.1.2 Ultraviolet
GALEX performs imaging in two UV bands, far-UV (henceforth FUV; Å, Å) and near-UV (henceforth NUV; Å, Å) with a spatial resolution of and in the two bands, respectively. Three nested GALEX imaging surveys have been performed: the All-Sky Survey (AIS) covering a large fraction ( %) of the high Galactic latitude () sky to mag, the Medium Imaging Survey (MIS) reaching mag on 1000 deg2, and the Deep Imaging Survey (DIS) extending to mag on 80 deg2 (e.g. Bianchi, 2009). These main surveys are complemented by guest investigator programs.
The -pc sample was cross-correlated with the GALEX data distributed in the Data Release 6 (GR6), which has been homogeneously reduced and analysed by a dedicated software pipeline, available at the Mikulski Archive for Space Telescopes (MAST)111http://galex.stsci.edu/casjobs.
In the first step of our cross-correlation procedure, we used the maximum possible match radius in MAST (). After the proper motion correction for the GALEX observing dates extracted for our targets, we reduced the match radius to for the final cross-correlation. Only sources having a distance from the center of the field of view were retained as generally the photometric quality is better in the central part of the field (Bianchi et al., 2011). In the case of multiple matches in the same observation, we retained the nearest source to the target. If the multiple matches were from different observations, they were assumed to be multiple observations of the same source. This yields GALEX counterparts to of the sample stars, of which all but one were observed in both FUV and NUV. All stars observed in the NUV were detected while of the stars observed in the FUV were detected. Most of the stars (82%) were observed in the AIS, were observed in the MIS and only in the DIS. Fifty six ( 34%) of the remaining stars of the sample, do not fall in the area covered by GALEX.
We note that only stars are listed as NUV and listed as FUV sources in LG11. Analogous to the case of the X-ray sources, our significantly larger number of UV identifications is likely due to the fact that LG11 have not corrected for proper motion when cross-correlating catalogs.
2.2 Spectroscopic parameters
LG11 provide spectral types for all sample stars derived from the color using a calibration based on SUPERBLINK stars that have a Sloan Digital Sky Survey (SDSS) spectrum. In their follow-up work of their proper-motion selected catalog, Lepine et al. (2012) checked that calibration for a spectroscopically confirmed part of the sample. They found that for stars with red colors this calibration tends to predict spectral types that are between subclasses too cool. They redetermined the vs. spectral type relationship by fitting a third-order polynomial to the observed distribution.
We adopted this updated calibration to compute the spectral types for all stars in the -pc sample from the colors given by LG11. We performed an independent literature search and found spectroscopically derived spectral types for all but two stars of the -pc sample. In particular, we have cross-matched our sample with the recent catalog of rotation and activity in early-M stars by Reiners et al. (2012), with Mohanty & Basri (2003) which comprises stars with spectral type M4 and later and with the Palomar/MSU survey by Reid et al. (1995). These three catalogs together yield spectral types for stars. Another have spectral types listed in Rojas-Ayala et al. (2012); Torres et al. (2006); Scholz et al. (1999); Reid et al. (2007).
To obtain the effective temperature () from the spectral types we combined the temperature scales from Bessell (1991) and Mohanty & Basri (2003). These two scales span the full M spectral class. A comparison between the effective temperatures obtained from the spectroscopically determined spectral types with those from is shown in Fig. 1. The corrected vs. spectral type relation presented by Lepine et al. (2012) is in good agreement with the spectroscopically determined spectral types with few exceptions. These comprise also two stars for which the vs. spectral type relation predicts spectral types cooler than M9 and that are not covered by our temperature scale. The spectroscopic data provides spectral types with accuracy down to subclass while the spectral types derived from the photometry have been rounded to subclass.
We adopted throughout this paper the spectral types from the spectroscopic literature, except for the two stars without available spectral types for which we resort to the values derived from as described above. Moreover, we have removed four stars with final spectral classification late K such that the -pc sample is reduced to stars.

Fig. 2 a and b display the spectral type and the mass distribution of the final pc-sample. The masses of all stars were derived from their making use of the Gyr isochrone of the Baraffe et al. (1998) models. The two histograms in Figs. 2 a and b are very different reflecting the non-linear transformation between temperature and mass. In the right panel of the figure the mass distribution of the subsamples detected in X-rays, FUV and NUV, respectively, is displayed. Note that the number of stars with observations and that with detections in one of the three energy bands differs from the numbers given in Sects. 2.1.1 and 2.1.2 due to the removal of four K-stars from the sample. In each mass bin the number of detected stars in a given energy band has been normalized to the total number of stars in that mass bin with available data in the same energy band. A detection fraction of % is reached only in the NUV. For the other two bands, X-rays and FUV, the detection fraction ranges between % and is remarkably constant as a function of mass. This means that with the presently available instrumentation it is not possible to reach down to the X-ray and FUV emission levels of the least active nearby M stars.


The spectroscopic catalogs of Reiners et al. (2012) and Mohanty & Basri (2003) provide, next to the spectral types, information on the rotational velocity () and H emission. Within the -pc sample, stars have an H measurement, of them are detections and are upper limits. A measurement for the rotational velocity has been done for stars from the spectroscopic catalogs but for of them this yielded only an upper limit to .
The relevant stellar parameters of all stars from the -pc sample are given in Table 3. Next to the identifiers from LG11 (col.1) we give in col.2 the Gl/GJ numbers from the CNS. The subsequent columns represent the distances corresponding to the trigonometric parallaxes given by LG11, the spectral types and effective temperatures as described above and the bolometric flux at Earth, . This latter one is obtained from the surface flux, where is the Boltzmann constant, multiplying it with the scaling factor . The stellar radii () were derived from Baraffe et al. (1998) models assuming an age of Gyrs for all stars. The subclass uncertainties in spectral type correspond to about K in temperature. According to Baraffe et al. (1998) the stellar radius changes by less than % between Gyrs, the likely age of this sample. The errors in the distances are for most stars also very small. Therefore, the uncertainties in are dominated by the uncertainty in the temperature and amount to circa %.
2.3 Completeness
To examine the completeness of the -pc sample we followed two approaches. First, we compared the sample to the previous samples of nearby M stars presented in the literature. Secondly, we computed the mass function of the -pc sample and compared it to the mass function of field M dwarfs presented by Bochanski et al. (2010).
We noticed that out of stars of the list of M dwarfs within pc studied by Marino et al. (2000) are missing in the -pc sample. This includes some of the most well-known flare stars, UV Cet, CN Leo, and Prox Cen. The absence of one star from the -pc sample can be attributed to it being at the border of our distance cutoff (with pc in LG11 but pc in Marino et al. (2000)). The remaining missing stars imply a completeness of % for the -pc sample. LG11 consider their full (not distance-limited) M dwarf catalog % complete for the northern hemisphere and % for the southern hemisphere. This is qualitatively consistent with the fact that only one of the stars missing from the -pc sample has positive declination. Assuming that there are no other stars missing in the -pc census of LG11 beyond these objects, we find a completeness of % for the northern and of % for the southern sky.
Bochanski et al. (2010) have presented the mass function of low-mass field dwarfs based on SDSS photometry for million stars. In Fig. 3 we reproduce their result for the system mass function (small circles connected by the solid curve). Over-plotted is the space density of the -pc sample divided into spectral subclasses. Each spectral type bin combines stars with spectral type MX and MX.5, where , and is centered on MX.25. The spectral types were converted to mass with the temperature scale and evolutionary models as described in Sect. 2.2. We omitted spectral bins at the edge of the samples’ mass distribution that are populated by less than stars. In practice this regards 6 stars with spectral types M6 and later as the outliers of late-K type have already been removed from the sample. The -pc sample is overall in good agreement with the mass function presented by Bochanski et al. (2010) except for the coolest mass bin where a large number of stars seem to be missing. Assuming that we miss half of the stars in the M5 bin, the number necessary to make our sample comply with the mass function of Bochanski et al. (2010) at M5 spectral type, our completeness is , i.e. %. The ‘missing stars’ from Marino et al. (2000), indeed, have a peak in this bin (see open squares in Fig. 3).

3 Activity diagnostics
3.1 X-ray fluxes
First, the X-ray data compiled from the various catalogs that we have cross-correlated with the -pc sample must be brought into a homogeneous shape. The RASS catalogs and the 2RXP list count rates in the ROSAT/PSPC energy band and the 2XMMi-DR3 catalog gives fluxes in various energy bands between keV. These fluxes refer to a power-law spectrum with index absorbed by (Watson et al., 2009). We have extracted the keV fluxes assuming a thermal one-temperature spectrum from all X-ray data described in Sect. 2.1.1 as follows.
Concerning the 2XMMi-DR3 data, we must note that a power-law is representative for X-ray emission generated by non-thermal electrons and is not adequate for describing the thermal coronal X-ray emission. Moreover, the interstellar absorption of nearby stars is much smaller than assumed in the 2XMMi-DR3. We calculated the count-to-flux conversion factors () for a thermal one-temperature model (APEC) of keV222Our estimate of the coronal temperature is based on previous X-ray studies of late-type stars, e.g. for solar analogs there is an empirical power law relation between X-ray luminosity and temperature with MK for (Güdel, 2004). This corresponds approximately to the range of X-ray luminosities of the -pc sample. and a column density of , corresponding to the average interstellar extinction at pc. The fluxes in the 2XMMi-DR3 energy bands were then corrected using the ratio between the (power-law) used in the XMM-Newton Serendipitous Source Catalog333The count-to-flux conversion factors used in the XMM-Newton Serendipitous Source Catalog are available at http://xmmssc-www.star.le.ac.uk/Catalogue/2XMM/UserGuide_xmmcat.html#Tab ECFs and the APEC calculated by us. Finally, we summed up the corrected 2XMMi-DR3 fluxes from the three lowest energy bands to obtain the keV flux. (For better comparison with ROSAT fluxes we do not consider the higher XMM-Newton energy bands from keV and from keV.) The PSPC count rates from the ROSAT catalogs are translated into keV fluxes using the same thermal model as for the XMM-Newton data ().
About % of the stars in the -pc sample have no X-ray detection, and we calculated their upper limits after having extracted the sensitivity limit making use of the RASS detections as follows. Fig. 4 shows those stars from the -pc sample that were detected in the RASS BSC or FSC. The lower envelope of the distribution of count rate versus exposure time defines the RASS sensitivity threshold. We obtained a numerical value for the count rate upper limit as a function of the RASS exposure time by performing a linear fit to the lowest observed count rates for given exposure time (dotted line in Fig. 4). For large exposure times a constant sensitivity limit is assumed. This is a conservative assumption considering that for long observations the sensitivity becomes background limited and decreases as the square root of the exposure time. We extracted the RASS exposure time for the proper motion corrected ICRS position of each of the undetected stars from the HEASARC archive444http://heasarc.gsfc.nasa.gov/cgi-bin/W3Browse/w3browse.pl, and placed them on the sensitivity curve to obtain their upper limit count rate. Then was applied for the conversion to the keV flux.

There are stars in the -pc sample that are reported in more than one of the X-ray catalogs that we have searched, allowing us to look for evidence of variability. For those stars, the X-ray flux from the pointed observations is compared to the X-ray flux from the RASS in Fig. 5. The majority of stars do not display variations larger than about a factor of two. This is consistent with an earlier variability study of M dwarfs by Marino et al. (2000). Having verified the negligible role of variability, we can consider a single measurement for each star to be representative for its X-ray emission level. We selected the flux from the 2RXP if available else the flux from the BSC or the FSC. Only if no ROSAT detection is available we resort to the 2XMMi. For the undetected stars we use the RASS upper limits.
The X-ray fluxes and upper limits of all stars from the -pc sample are listed in Table 4 together with their uncertainties in squared brackets. For further analysis, the X-ray fluxes and their upper limits were transformed into luminosities and their upper limits using the individual distances listed in Table 3.


3.2 UV fluxes
FUV and NUV magnitudes in the AB-system within a 12.8′′ diameter of the source position were extracted for all detections in the -pc sample. This diameter is a good compromise between the large apertures required to gather almost all of the GALEX flux and the small ones that are optimal for minimising the background. Flux densities were computed from the FUV and NUV magnitudes using the transformation relations given by Bianchi (2009), and they were converted to fluxes with the effective band width555see GALEX Observer’s guide available at http://galexgi.gsfc.nasa.gov /docs/galex/Documents/ERO_data_description_2.htm of the respective GALEX filter ( Å; Å).
The upper limits of the stars that are undetected in the FUV band were estimated as follows. We obtained the FUV upper limit of PM I03133+0446S (GJ 1057), the only star undetected in the MIS, using the background-subtracted FUV GALEX intensity image. We computed the FUV magnitude of PM I03133+0446S within a circular aperture centered on the star and with the same diameter as the aperture used for the detected sources. All remaining undetected stars were observed in the AIS. We estimated the FUV upper limits for of them, spanning all the range of exposure times, in the same manner as for PM I03133+0446S. The upper limits of the others were then obtained by linear interpolation between these values.
There are stars with two NUV observations and stars with two FUV observations. These objects can be investigated for UV variability analogous to the case of the X-ray emission in Sect. 3.1. The bottom panel of Fig. 5 compares the fluxes for stars with two measurements in the FUV and/or the NUV band. Overall there is little evidence for variability. Only the upper limits are far off from the 1:1 relation. However, all FUV upper limits are compatible with the detections, and they are shallow due to the low exposure time in the respective observation. The only star that has shown strong variability is PM I09307+0019 (GJ 1125). Its NUV upper limit is more sensitive than its NUV detection. This is not a contradiction because the exposure times of its two observations were different by about a factor 10. In the remainder of this paper, we used for stars that are detected in two observations of a given GALEX band, the average of the two measurements. Observed but undetected stars are represented by their upper limits. We ignore the upper limits of stars that also have a detection in another GALEX observation.
3.3 H fluxes
3.4 Activity indices
In analogy to the standard measure for Ca II H+K activity, we define the UV activity index as
| (1) |
where is the UV excess flux attributed to activity, i.e. the difference between the observed UV flux () and the photospheric flux in the same UV band (), and is the bolometric flux. The bolometric flux is obtained from the surface flux as described in Sect. 2.2.
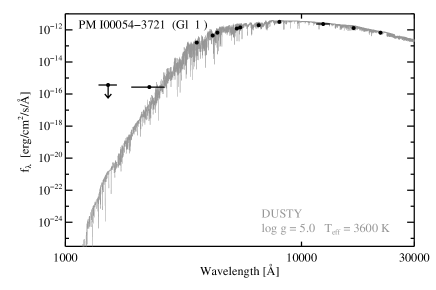
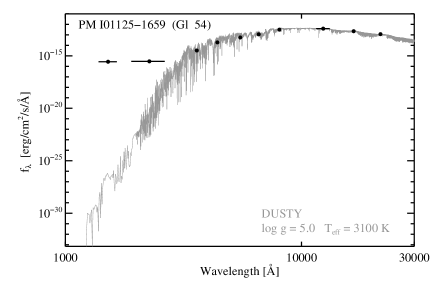
In Eq. 1 ‘UV’ stands for the NUV and FUV bands, respectively. The superscript (′) indicates that the ratio has been corrected for photospheric emission. The photospheric contribution to the NUV and FUV emission was estimated with help of the synthetic DUSTY spectra of Allard et al. (2001). We adopted for each star in the pc sample the model spectrum with solar metallicity, and with corresponding to the spectral type from the references described in Sect. 2.2. Fig. 6 shows two examples of observed spectral energy distributions (SEDs) and corresponding DUSTY model. The synthetic spectra are available in terms of surface flux density and have been transformed for this plot into observed flux density by applying the dilution factor . As before in Sect. 2.2 we have used for the stellar radius the value extracted from the Gyr isochrone of Baraffe et al. (1998) for the known effective temperature of each star. As mentioned in Sect. 2.2, no significant difference in radius is predicted for ages between and Gyr.
For many stars, when comparing the observed flux densities to the model spectra as described above we noticed serious problems with the normalization. If the distance is assumed to be known from the trigonometric parallax for each star, for those cases an unrealistically large radius was needed to make the model spectrum fit the observed photometry. A larger radius corresponds for given to a smaller gravity, i.e. a younger age. We come back to this problem in the next paragraph. First, we describe how the photospheric UV fluxes have been derived. We can avoid directly dealing with the uncertain radius by computing the photospheric UV flux density from the color predicted from the DUSTY model and the observed -band flux density (),
| (2) |
The theoretical and -band flux densities, and , were obtained by convolving the synthetic spectrum with the respective normalized filter transmission curve as described by Bayo et al. (2008). The photospheric UV flux densities from Eq. 2 were converted to fluxes () in the same manner as the observed flux densities by multiplying with the effective filter band width (see Sect. 3.2).
To test the effect of and radius on the photospheric UV emission we have repeated the evaluation of Eq. 2 for DUSTY models of . This gravity corresponds to an age of according to Baraffe et al. (1998). We find that the photospheric UV flux is smaller and the UV excess larger by up to a factor of two with respect to our assumption of . However, the age related to this low gravity would imply a pre-main sequence status for a large fraction of the -pc sample. An investigation of the age of individual stars on the basis of a comparison to model predictions is not the scope of this paper. Therefore, we use throughout the remainder of this paper the UV fluxes and chromospheric excess fluxes derived for but keep in mind that they may be up to a factor two higher in individual cases.
Similarly to the UV, the ratio of X-ray flux to bolometric flux is defined as . Here no photospheric flux is considered because the photosphere is not expected to produce emission in the X-ray band.
4 Characteristics of activity on M dwarfs
In the following we examine the connection between various activity diagnostics and their relation with other stellar parameters such as effective temperature and rotation rate. For the UV which is poorly explored so far we provide a comparison to available literature data. Unless stated otherwise, all our UV measurements refer to the chromospheric excess flux after subtraction of the photospheric contribution as described in Sect. 3.4.
4.1 Chromospheric vs photospheric UV flux
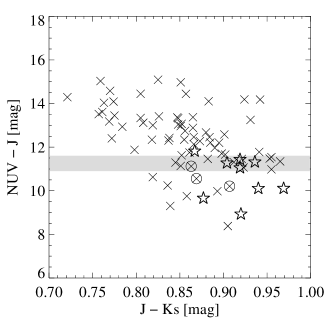
The chromospheric emission resulting in excess flux with respect to the photospheric model is shown in Fig. 7 for the NUV band. Here, the excess is normalized to the observed NUV flux. The lower envelope of these data represents the maximum observed contribution of the photosphere to the NUV emission for a given . For the majority of stars the dominating contribution to the NUV emission comes from the chromosphere. In fact, no star has purely photospheric NUV emission. However, for several stars the photosphere contributes % to the NUV emission, and for the most extreme cases the photosphere produces more than half of the observed NUV flux. The higher the effective temperature the larger on average the contribution of the photosphere to the NUV emission. This is not surprising considering that the spectral energy distribution shifts towards the blue for hotter stars. The fact that the data points are distributed below the horizontal line representing % chromospheric NUV flux in Fig. 7 shows that subtracting the photospheric part of the NUV emission is essential for a correct assessment of the chromospheric emission.

An analogous analysis in the FUV has shown that in this energy band all photospheres in our sample are very faint, such that the chromospheric excess amounts to % of the observed emission.
4.2 High-energy spectral energy distributions
The ‘spectral energy distribution’ of the excess emission can be studied by means of a UV color representing the excess emission and defined as
| (3) |
where and are the chromospheric excess fluxes defined in Sect. 3.4. In Fig. 8 we show this color in dependence of the X-ray surface flux as a measure of the activity level. Only stars detected in all three energy bands (X-rays, FUV and NUV) are shown. For highly (X-ray) active stars the FUV excess dominates the NUV excess, while for weaker X-ray emitters the NUV excess is stronger than the FUV excess.

4.3 Relations between H, UV and X-ray emission
Various chromospheric lines have been shown for different samples of late-type main-sequence stars to be connected by a power-law relation of the type
| (4) |
where are the surface fluxes representing two different activity diagnostics and and are coefficients. Early comparisons of coronal X-ray and chromospheric emission line fluxes in samples of late-type dwarfs have suggested a spectral type dependence of the slopes (e.g. Schrijver & Rutten, 1987; Doyle, 1989). However, Martínez-Arnáiz et al. (2011) found on a much larger sample that the flux-flux relations are universal in spectral type but with a separate branch for the most active stars. Stelzer et al. (2012) have for the first time extended these relations into the regime of the ultracool (late-M) dwarfs.
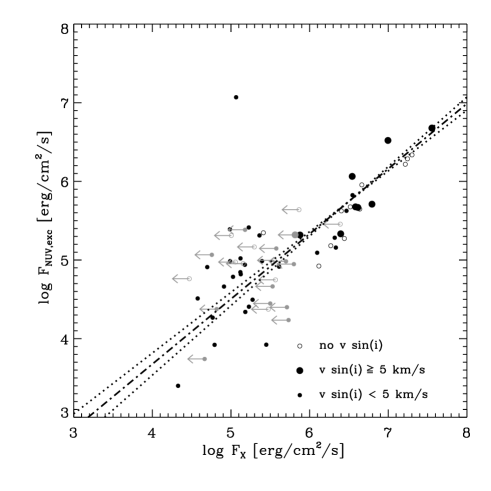
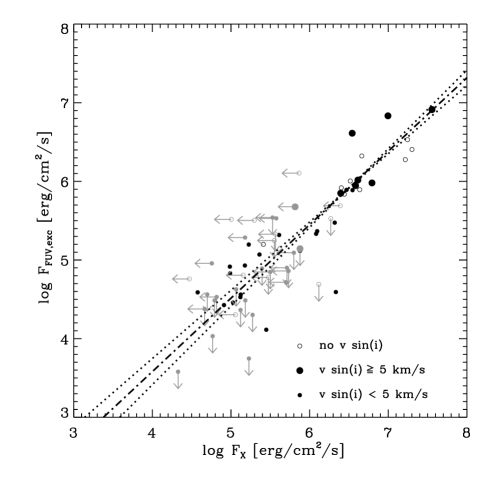
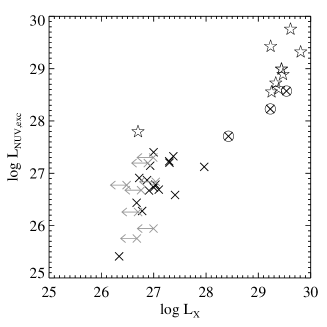
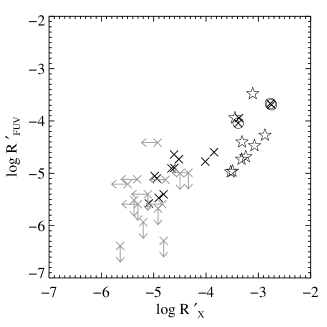
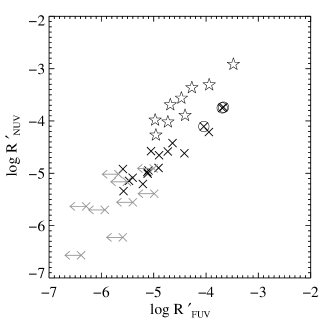
Here, we search for flux-flux relations in the broad-band UV and X-ray emission together with H emission for the -pc sample. The surface fluxes in all activity diagnostics were calculated using the individual radii determined as described in Sect. 3.4. The results are shown in Fig. 9 where the size of the plotting symbols is used to distinguish fast from slow rotators and different color codes are used for detections and upper limits.
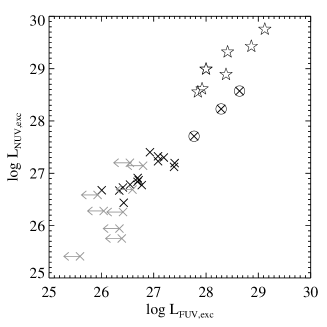
Considering only the detections, the pair of activity diagnostics with the smallest spread is NUV vs FUV. We have performed linear regression fits to different pairs of fluxes considering only the stars detected in both involved energy bands. As in our previous works, the method used is the least squares bisector regression described by Isobe et al. (1990). The results are overplotted in Fig. 9 and the coefficients of the log-log relations are given in Table 1. We have omitted one star (Gl 169.1 A) from the fit of NUV vs. X-ray emission. Its very high NUV flux places it orders of magnitude above the bulk of the stars and may be due to a flare event. Note also that the inclusion of the upper limits might modify the relations.
| Line 1 | Line 2 | |||
|---|---|---|---|---|
| Surface flux | ||||
| X | H | 24 | ||
| FUV | X | 36 | ||
| NUV | X | 46 | ||
| NUV | FUV | 46 | ||
| Activity index | ||||
| X | H | 24 | ||
| FUV | X | 36 | ||
| NUV | X | 46 | ||
| NUV | FUV | 46 | ||
| Luminosity | ||||
| X | H | 24 | ||
| FUV | X | 36 | ||
| NUV | X | 46 | ||
| NUV | FUV | 46 | ||
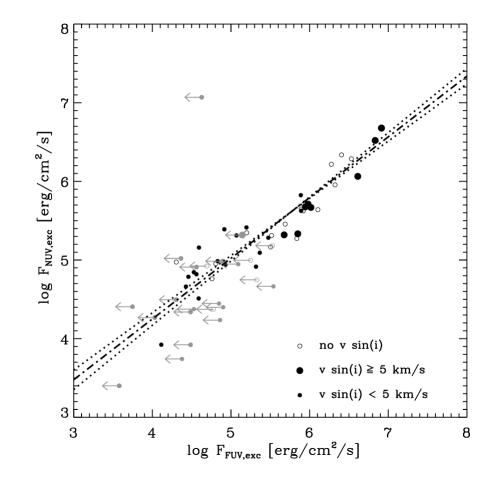
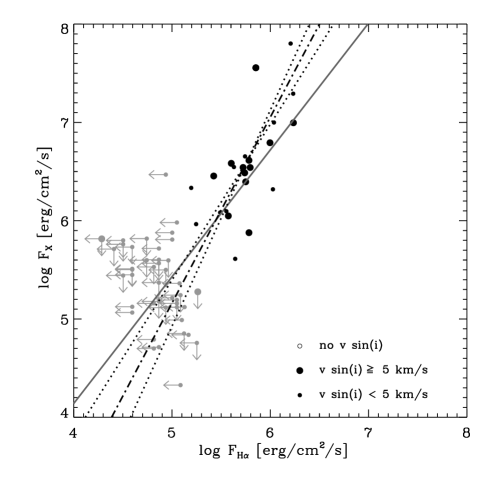
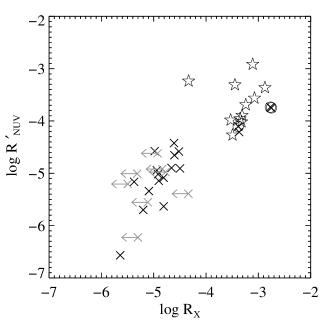
Another representation of the flux-flux relationships is shown in Fig. 10. Here, for the comparison of X-ray and UV fluxes we consider separately H emitters (dMe stars) and stars with upper limit to the H flux (dM stars). Fig. 10 shows that the dM stars are generally located on the extension of the flux-flux relation for dMe stars.


Relations between luminosities or activity indices of two spectral bands can be examined analogous to the case of the flux-flux relationships. The results are summarized in Table 1.
4.4 Activity indices vs. spectral type and rotation rate
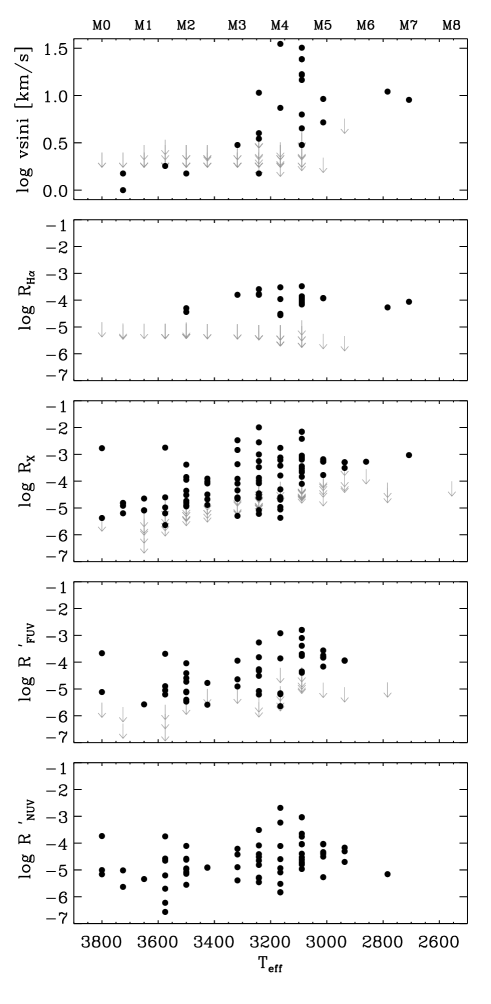
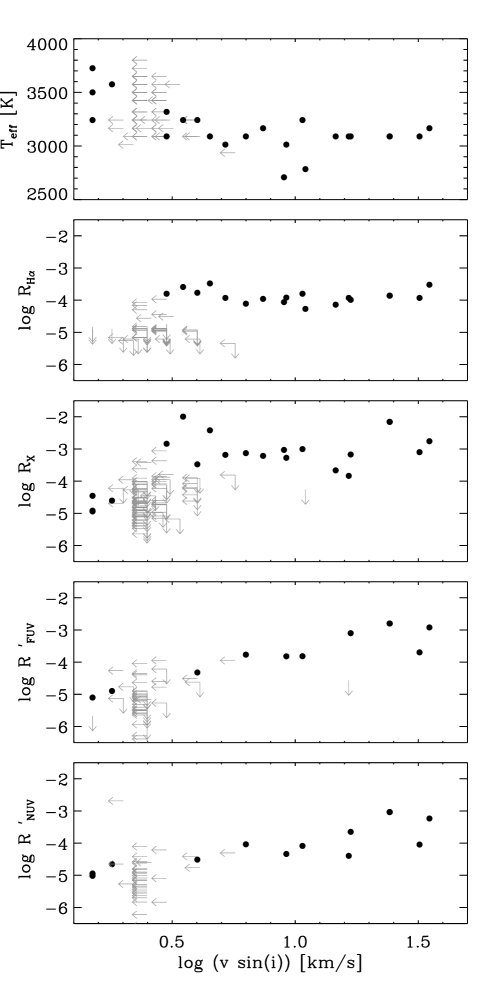
The distribution of the activity indices for all four diagnostics (H, X-rays, FUV and NUV) are shown in Fig. 11 as a function of and . Upper limits are symbolized by grey downward pointing arrows. The H sample is restricted in spectral type by the available published spectroscopic data. For conclusions on the H activity of early-M dwarfs we refer to Reiners et al. (2012) who have studied a much larger sample. We used the H data here as comparison to our new data for the X-ray, FUV and NUV emission of the -pc sample.
For the X-ray band, the lower envelope of the activity index increases with decreasing effective temperature. The location of the upper limits suggests that this is related to the reduced sensitivity in for the cooler stars which are fainter in terms of bolometric flux. There is no obvious slope of the lower envelope for the FUV and the NUV.
A spread of several orders of magnitude is observed in all activity indices for a given . This spread corresponds to a range of rotational velocities. In fact, the spread in the activity indices is largest at spectral type around M4 where the largest range of is observed. For each spectral subclass, fast rotators show higher activitity levels than slow rotators in agreement with the common rotation/activity paradigm.
There seems to be a transition in the rotation rates between early-M ( M3) and mid- to late-M ( M4); see also Reiners et al. (2012). All early-M dwarfs in the pc sample have very low or undetectable rotation rate. On the contrary, fast rotation is observed in about half of the stars with spectral type M4 and later. In terms of , and less pronounced in , the fast rotators form a plateau in the right panels of Fig. 11, i.e. the level of activity does not depend on rotation. This ‘saturation’ is ubiquituously observed in the activity indices of late-type stars, yet there is no consensus on its origin. Vilhu (1984) attributed it to a complete coverage of the stellar surface with active regions. Alternative explanations are saturation of the power of the dynamo (Vilhu & Walter, 1987), a redistribution of the radiative losses between emission lines and continuum (Doyle, 1996) and changes of magnetic field structure (Jardine & Unruh, 1999).
The evidence for saturation in and is less clear than for and . We can determine the mean level of each activity index in the presumed saturated regime. For this analysis we restricted the sample to stars with km/s. Beyond this value H and X-ray activity indices have reached a plateau in the right panel of Fig. 11. The average activity indices and its standard deviation for this subsample of fast rotators are given in Table 2. The trend for the broad bands (NUV, FUV, X-rays) goes for increasing mean activity level with increasing atmospheric height. However, the small number of stars evaluated leads to a rather large spread. The H emission which is produced in the chromosphere, i.e. relatively low in the atmosphere, is in agreement with this trend as it presents the faintest saturation level.
| Act. index | mean | std.dev | |
|---|---|---|---|
Slow rotators ( km/s) cover a large range of observed activity levels. Whether activity depends on rotation in that regime is difficult to determine because the available sensitivity limits in terms of the rotation rate are too high and because the rotation rate is only a lower limit because of the unknown inclination angle.
4.5 Comparison with published UV data of M dwarfs
We have searched the literature for spectroscopic data in the UV that would allow us to evaluate the relative contributions of lines and continuum to the GALEX fluxes. While detailed UV spectroscopy has been presented for a few individual M dwarfs (e.g. Pagano et al., 2000; Hawley et al., 2003, 2007), published chromospheric line fluxes are found for very few stars of the -pc sample. Among the most notable and best-studied emission features in dwarf stars are the chromospheric Mg II h+k doublet at Å in the NUV and the C IV Å doublet from the transition region in the FUV. Mathioudakis & Doyle (1989, henceforth MD89) have listed Mg II surface fluxes () for K-M dwarf stars based on IUE spectra. Their sample has stars in common with ours. Further fluxes for FUV and NUV continuum as well as some important UV emission lines from M dwarfs are presented by France et al. (2013, henceforth FFL13) in their study of HST COS and STIS spectra of six exoplanet host stars. Two of their stars are in common with the -pc sample. The UV emission of one of them, GJ 876, has been examined in detail in another dedicated study by France et al. (2012). In the following we compare the fluxes given in those works to our GALEX measurements.
As we aimed at a homogeneous data analysis we could not simply compare the surface line fluxes given by MD89 to the GALEX fluxes but had to reconvert them to observed fluxes () following the inverse of the procedure that was applied by MD89. These authors have computed the ratio using a relation that involves the band magnitude, the color, the effective temperature and a bolometric correction (); see Oranje et al. (1982) for details. They did not list the photometry they used. To be as close as possible to their historic measurements we have compiled magnitudes from CNS 3 catalog. Again for reasons of consistency with MD89, we extracted and from Johnson (1966). The observed Mg II fluxes recovered this way were then transformed back into surface fluxes using the distances from LG11 and the stellar radii derived in Sect. 3.4. The observed fluxes listed by FFL13 were transformed into surface fluxes in the same way.
We plot the flux-flux relations for the GALEX/NUV band and various NUV measurements from the literature in Fig. 12. Filled plotting symbols are for Mg II line fluxes and open symbols for broad band NUV fluxes from HST STIS. Objects with Mg II line fluxes from MD89 and from FFL13 are shown with different plotting symbols. Several literature measurements for a given star are connected by a vertical line. To make the GALEX fluxes comparable to the literature values we plotted here the observed fluxes that include also the photospheric contribution. Fig. 12 shows that the two available total NUV fluxes from HST STIS are nearly a factor ten higher than those from GALEX. The Mg II fluxes are on average roughly a factor two lower than the GALEX/NUV fluxes.

Analogous to the investigation of the NUV line and broad-band emission, we have compared the GALEX/FUV to the C IV and to the broad band FUV emission from HST COS for the two stars from the -pc sample with data in FFL13. We find that the two stars behave very differently. Similar to the NUV, for Gl 876 the HST/FUV flux is much larger than the GALEX/FUV flux () while the C IV line flux is similar to the GALEX/FUV flux (). On the contrary, for Gl 832 the broad band fluxes of the two instruments are within a factor two () and the C IV flux is much smaller than the GALEX/FUV flux ().
The comparison of the broad band fluxes must take into account the different wavelength ranges of the instruments. In the case of the NUV this is Å for STIS and Å for the GALEX filter. In particular, we recall that the bulk of Mg II is not being captured by the GALEX NUV band which has very low transmission near the cutoff of the filter. However, Mg II makes only about 10 % of the total STIS NUV emission. Therefore, the differences in the NUV broad band fluxes of the two instruments are likely due to variability. Similarly, variability may be responsible for the differences between the FUV fluxes observed with GALEX and with the two HST instruments. In fact, both stars from FFL13 showed evidence of FUV flaring activity during the HST observations while no information is given by FFL13 on the NUV variability. We note that the HST STIS and COS observations of a given star are not simultaneous. The overall impact of the flares onto the FUV emission of the stars could not be quantified because no lightcurves are presented by France et al. (2012) and FFL13 for C IV nor for the broad band emission.
4.6 Age evolution
With the aim to study the age evolution of the activity of M dwarfs we have compiled a catalog of all known M-type members of the TW Hya association (TWA). The TWA represents an excellent comparison sample of pre-main sequence M dwarfs because at its age of Myr most association members have terminated the accretion process such that the H, UV and X-ray emission can be clearly ascribed to magnetic activity.
4.6.1 TWA sample and analysis
Our TWA catalog comprises all stars considered to be association members by Mamajek (2005) and further members discovered since by Looper et al. (2007, 2010a, 2010b); Shkolnik et al. (2011). The X-ray and UV data were extracted in the same way as those of the field M dwarfs (see Sects. 2.1.1 and 2.1.2), except that we have consulted only the RASS BSC and FSC catalogs and no X-ray catalog of pointed observations.
A significant fraction of TWA members are close binaries that are not resolved in the RASS and with GALEX. For these cases we have distributed the observed X-ray and UV flux equally on both components, unless for TWA11 where the primary is an A-type star and the X-ray emission is likely produced by the secondary M-type component. Limiting the sample to M spectral types and treating the binaries as described, the TWA sample comprises objects. Sixteen of these are identified with a RASS/BSC source and one with a RASS/FSC source, while are detected with GALEX.
For the X-ray count-to-flux conversion a thermal model with keV and is assumed. The larger temperature with respect to the -pc sample reflects the younger age and the larger column density the larger distance of TWA. Individual distances were used for the conversion of fluxes to luminosities.
The spectral types were converted to effective temperature using the scale of Luhman (1999) that was devised for pre-main sequence stars with gravities inbetween those of dwarfs and of giants. We estimated the bolometric luminosity and stellar radii of the TWA stars from the Baraffe et al. (1998) models assuming an age of Myr. Following the procedure described in Sect. 3.4, we have computed and subtracted the photospheric contribution to the GALEX fluxes for the TWA sample. Consistent with the younger age of TWA with respect to the -pc sample we use the DUSTY models with . As in the case of the -pc sample, the FUV emission can be entirely ascribed to the chromospheric excess. Less than % of the NUV emission of TWA M dwarfs comes from the photosphere.
4.6.2 Results
Findeisen et al. (2011) have examined the age evolution of GALEX UV magnitude for a sample of G stars from various clusters and associations covering to Myrs. In Fig. 13 we show a versus diagram for the -pc sample and the TWA sample to be compared to Fig.7 of Findeisen et al. (2011). We confirm the result of these authors that younger stars have bluer color at the same and we add more detail to it. In particular, as can be seen in Fig. 13, for the same range of the majority of M dwarfs from the -pc sample have much redder color than the oldest sample (Hyades cluster) analysed by Findeisen et al. (2011). This is likely to be attributed to the older age of the -pc sample with respect to the Hyades. As far as the FUV is concerned, as stated by Findeisen et al. (2011) their data is dominated by non-detections and we could not derive the level of the Hyades from their Fig.7. Our Fig. 13 also shows that the anti-correlation in vs that we see in the -pc sample is a result of the increasing band magnitude within the M dwarf sequence.


In Fig. 14 the luminosities and activity indices of the young M stars in TWA are compared to those of the M0…M3 stars of the -pc sample. The restriction to early-M spectral types was applied to the -pc sample because all but one of the UV detected TWA stars have early M spectral types; cf. Fig. 13. The only late-M TWA member is TWA-28, detected in NUV and X-rays and clearly offset from the other TWA stars towards weaker activity in Fig. 14.
Evidently, for the same spectral type range the TWA and the -pc sample form two distinct groups in terms of UV and X-ray luminosities with TWA stars being brighter in all three energy bands. Only the three most active stars from the -pc sample (AU Mic, FK Aqr and Gl 569 AB; highlighted by circles in Figs. 13 and 14) are located in the same area as TWA suggesting that these are young and/or extremely active stars. In fact, AU Mic is a debris disk system and a known member of the Myr old Pic moving group (Kalas et al., 2004; Zuckerman et al., 2001), FK Aqr (Gl 867 A) has long been known as a flare stare (Byrne, 1979), and Gl 569 AB is a multiple system of only Myr (Simon et al., 2006). Our assumption of is probably wrong for these stars but this does not affect the UV excess fluxes because their photospheric contribution is negligibly small ( %).
The differences between the activity levels of TWA and the -pc sample persists if the activity indices are considered instead of the luminosities (Fig. 14 bottom) although the differences are smaller due to the drop of bolometric luminosity across time.

The age evolution of the luminosities in the UV and X-ray band for M0-M3 stars is displayed in Fig. 15. The vertical bars for the TWA and the -pc sample represent the full spread of observed values. We have omitted the only accretor in the sample of X-ray and GALEX detected TWA members. Linear regression fits in log-log form to the four data points are shown for each of the three energy bands. We have derived slopes of , and . Similar plots for the surface flux and activity index vs age show larger scatter of the data points especially within the TWA sample. This may be related to differences in radii within the TWA group that are not taken into account in our analysis.

5 Summary and conclusions
H, UV and X-ray emission are complementary indicators of magnetic activity probing the chromosphere, transition region and corona of late-type stars. We have quantified the emissions in these wavebands for a well-defined sample of nearby M dwarfs capitalizing on recent comprehensive catalogs for H emission and – partly unexplored – archival data from GALEX, ROSAT and XMM-Newton.
We present a catalog of H, NUV, FUV and X-ray fluxes for M dwarfs within pc of the Sun, together with the stellar parameters used to derive the fractional flux in each of the four bands with respect to the bolometric flux, the so-called activity indices. This sample has an estimated completeness of %.
We have subtracted the photospheric contribution to the UV fluxes of all stars with help of synthetic model spectra. A result of this analysis is that there are no M dwarfs in the -pc sample without a chromospheric contribution to the NUV and FUV emission. While generally the emission in the GALEX bands is dominated by the chromosphere there is a trend towards increasing photospheric contribution for earlier M spectral types reflecting the shift of the stellar spectral energy distribution towards bluer wavelengths. The UV fluxes used throughout this paper for comparison to the H and X-ray emission regard only the chromospheric excess remaining after the photospheric subtraction.
As a result of the limitations of the available instrumentation, up to the present day UV spectra are available for very few M dwarfs (see references in Sect. 1). In particular, the faint continuum has been difficult to assess. We found from a comparison of historical records of the Mg II Å doublet with GALEX/NUV fluxes that this line can contribute about one-third to the NUV emission of M dwarfs.
We have shown that with increasing activity level (measured by the X-ray flux) the relative contribution of UV emission shifts from the NUV to the FUV. Considering that stronger X-ray emitters have higher plasma temperatures (Güdel, 2004), this is qualitatively consistent with the shape of the thermal Bremsstrahlung continuum that increases towards shorter wavelengths for high temperatures (see Redfield et al., 2002). We recall here that the NUV band is dominated by chromospheric emission lines while the FUV band comprises many transition region emission lines. In this simplistic view, the observed dependence of on X-ray flux indicates that higher (X-ray) activity is related to a stronger enhancement of emission in the transition region with respect to the chromosphere. This is in agreement with the higher formation temperature of the FUV transition region lines ( K) with respect to the NUV emission.
We have examined flux-flux relations between H, NUV, FUV and X-ray emission. The tighest correlation is observed for FUV vs NUV. As GALEX observes simultaneously in both bands, while the X-ray and H observations are non-contemporaneous, this may indicate that the spread in the other relations is variability scatter. On the other hand, by comparing the fluxes for stars with more than one measurement of a given activity diagnostic (UV or X-rays) we have demonstrated that long-term variability is not an important factor for the average activity level. Therefore, the scatter in the flux-flux relations seems to represent an intrinsic range of physical conditions between the chromosphere and corona of M dwarfs. While variability in general plays a minor role in this sample, in individual cases it can be important. Comparing GALEX fluxes with published HST fluxes for two planet host stars we found one order of magnitude differences likely produced by flaring.
MD89 have studied the relation between Mg II flux and X-ray flux for M dwarfs observed with IUE, EXOSAT and Einstein. They found that the emission in these two observables are correlated for dMe stars while they are not correlated for dM stars. We have separated the -pc sample into H emitters (dMe) and stars with upper limit to the H flux (dM) and examined the flux-flux relations between UV and X-ray emission. For the -pc sample the trend towards larger scatter for the dM stars is confirmed but they are generally located on the extension of the flux-flux relation of dMe stars. In particular, several dM stars do show X-ray and/or chromospheric UV emission making the definition of dM as ‘non-active’ versus dMe as ‘active’ questionable. A similar conclusion was drawn by Walkowicz et al. (2008) who found substantial UV and X-ray flux in a number of M dwarfs without H emission.
For X-rays vs. H the power-law slope for the flux-flux relation of the -pc sample is slightly steeper than the results of Stelzer et al. (2012) for a sample of M dwarfs that comprised also late-M spectral types. The ultracool sample from Stelzer et al. (2012) is likely biased towards strongly active objects. However, Stelzer et al. (2012) constructed their vs relation using the faintest measured flux level in case of several epochs of data for a given object. Therefore, their steeper slope may indicate a change of X-ray-to-H flux ratio in the low-activity regime. The upper limits of the -pc sample are not sensitive enough to test this hypothesis.
Despite the fact that we have exploited the most sensitive available observations for this sample of nearby M dwarfs, a substantial number of objects ( %) remain undetected in the FUV and X-ray regime. The sensitivity limit may be responsible for the increase of the lower envelope of the values for the activity index in the X-ray band with increasing . The largest spread of the activity indices is observed at spectral type M4 where the range of rotation rates is largest. We have computed the average values of the activity indices for the subsample of fast rotators ( km/s). While there are clear signs for saturation in H and X-rays, the scatter of the data points for fast rotators in the NUV and FUV range is large. Comparing the fractional flux output of X-rays, FUV, NUV and H we find an increase with energy for the four diagnostics. This trend was already noted by Hawley et al. (1996) who found in a smaller volume-limited sample. For the -pc sample the saturation levels for X-rays and H differ by nearly one order of magnitude.
Finally, to study the age evolution of the activity in M dwarfs we have analysed the UV and X-ray emission of a young comparison sample composed of the M stars from the TWA. These stars are by about a factor hundred younger than the stars from the -pc sample yet accretion has stopped in the majority of them such that the observed emission can be attributed to magnetic activity. We found that between Myr and few Gyrs the X-ray, FUV and NUV luminosities drop by almost three orders of magnitude. A small group of young M dwarfs in the -pc sample bridges the gap between the luminosities of the TWA stars and the bulk of the field M dwarfs indicating that the decrease of activity with age is a continuous process. We have calculated the slopes of the age decay for the X-ray, FUV and NUV luminosities. Sanz-Forcada et al. (2011) have calculated the age-luminosity relation in the EUV band ( Å) for a sample of planet host stars with spectral types F-K. They found a somewhat steeper slope than we do for the UV and X-rays bands bracketing the EUV. As the stars in our -pc sample and possibly also those in the TWA have an unknown age spread that we did not take into account, we do not give weight to the absolute values of our slopes. However, we can state that the age decay of the luminosity of M dwarfs is steeper for the X-ray band than for the NUV and FUV. This is similar to analogous studies on solar analogs (G stars) (Ribas et al., 2005; Claire et al., 2012).
Acknowledgments
BS would like to thank J.Sanz-Forcada and C.Cecchi-Pestellini for helpful conversations, and A.Reiners for providing the table with optical spectroscopic measurements before its official availability. We appreciate the input of an anonymous referee. This work is based on archival data from the GALEX, XMM-Newton and ROSAT space missions. Partial financial support from ASI is acknowledged.
References
- Adelman-McCarthy & et al. (2009) Adelman-McCarthy J. K., et al., 2009, VizieR Online Data Catalog, 2294, 0
- Allard et al. (2001) Allard F., Hauschildt P. H., Alexander D. R., Tamanai A., Schweitzer A., 2001, ApJ, 556, 357
- Baraffe et al. (1998) Baraffe I., Chabrier G., Allard F., Hauschildt P. H., 1998, A&A, 337, 403
- Bayo et al. (2008) Bayo A., Rodrigo C., Barrado Y Navascués D., Solano E., Gutiérrez R., Morales-Calderón M., Allard F., 2008, A&A, 492, 277
- Bessell (1991) Bessell M. S., 1991, AJ, 101, 662
- Bianchi (2009) Bianchi L., 2009, Astrophys. Space Science, 320, 11
- Bianchi et al. (2011) Bianchi L., Efremova B., Herald J., Girardi L., Zabot A., Marigo P., Martin C., 2011, MNRAS, 411, 2770
- Bochanski et al. (2010) Bochanski J. J., Hawley S. L., Covey K. R., West A. A., Reid I. N., Golimowski D. A., Ivezić Ž., 2010, AJ, 139, 2679
- Browne et al. (2009) Browne S. E., Welsh B. Y., Wheatley J., 2009, PASP, 121, 450
- Buccino et al. (2007) Buccino A. P., Lemarchand G. A., Mauas P. J. D., 2007, Icarus, 192, 582
- Byrne (1979) Byrne P. B., 1979, MNRAS, 187, 153
- Byrne et al. (1980) Byrne P. B., Butler C. J., Andrews A. D., 1980, Irish Astronomical Journal, 14, 219
- Cecchi-Pestellini et al. (2009) Cecchi-Pestellini C., Ciaravella A., Micela G., Penz T., 2009, A&A, 496, 863
- Claire et al. (2012) Claire M. W., Sheets J., Cohen M., Ribas I., Meadows V. S., Catling D. C., 2012, ApJ, 757, 95
- Cutri et al. (2003) Cutri R. M. et al., 2003, 2MASS All Sky Catalog of point sources. The IRSA 2MASS All-Sky Point Source Catalog, NASA/IPAC Infrared Science Archive. http://irsa.ipac.caltech.edu/applications/Gator/
- Doyle (1989) Doyle J. G., 1989, A&A, 218, 195
- Doyle (1996) Doyle J. G., 1996, A&A, 307, L45
- Findeisen et al. (2011) Findeisen K., Hillenbrand L., Soderblom D., 2011, AJ, 142, 23
- France et al. (2013) France K. et al., 2013, ArXiv 1212.4833
- France et al. (2012) France K., Linsky J. L., Tian F., Froning C. S., Roberge A., 2012, ApJL, 750, L32
- Gliese & Jahreiss (1995) Gliese W., Jahreiss H., 1995, VizieR Online Data Catalog, 5070, 0
- Güdel (2004) Güdel M., 2004, A&Ar, 12, 71
- Hawley et al. (2003) Hawley S. L. et al., 2003, ApJ, 597, 535
- Hawley et al. (1996) Hawley S. L., Gizis J. E., Reid I. N., 1996, AJ, 112, 2799
- Hawley et al. (2007) Hawley S. L., Walkowicz L. M., Allred J. C., Valenti J. A., 2007, PASP, 119, 67
- Høg et al. (2000) Høg E. et al., 2000, A&A, 355, L27
- Isobe et al. (1990) Isobe T., Feigelson E. D., Akritas M. G., Babu G. J., 1990, ApJ, 364, 104
- Jardine & Unruh (1999) Jardine M., Unruh Y. C., 1999, A&A, 346, 883
- Johnson (1966) Johnson H. L., 1966, ARA&A, 4, 193
- Kahn et al. (1979) Kahn S. M., Mason K. O., Bowyer C. S., Linsky J. L., Haisch B. M., White N. E., Pravdo S. H., 1979, ApJL, 234, L107
- Kalas et al. (2004) Kalas P., Liu M. C., Matthews B. C., 2004, Science, 303, 1990
- Kasting et al. (1993) Kasting J. F., Whitmire D. P., Reynolds R. T., 1993, Icarus, 101, 108
- Koen et al. (2010) Koen C., Kilkenny D., van Wyk F., Marang F., 2010, MNRAS, 403, 1949
- Lammer et al. (2003) Lammer H., Selsis F., Ribas I., Guinan E. F., Bauer S. J., Weiss W. W., 2003, ApJL, 598, L121
- Lecavelier Des Etangs (2007) Lecavelier Des Etangs A., 2007, A&A, 461, 1185
- Lépine & Gaidos (2011) Lépine S., Gaidos E., 2011, AJ, 142, 138
- Lepine et al. (2012) Lepine S., Hilton E., Mann A., Wilde M., Rojas-Ayala B., Cruz K., Gaidos E., 2012, ArXiv 1206.5991
- Looper et al. (2010a) Looper D. L., Bochanski J. J., Burgasser A. J., Mohanty S., Mamajek E. E., Faherty J. K., West A. A., Pitts M. A., 2010a, AJ, 140, 1486
- Looper et al. (2007) Looper D. L., Burgasser A. J., Kirkpatrick J. D., Swift B. J., 2007, ApJL, 669, L97
- Looper et al. (2010b) Looper D. L. et al., 2010b, ApJ, 714, 45
- Luhman (1999) Luhman K. L., 1999, ApJ, 525, 466
- Mamajek (2005) Mamajek E. E., 2005, ApJ, 634, 1385
- Marino et al. (2000) Marino A., Micela G., Peres G., 2000, A&A, 353, 177
- Martin et al. (2005) Martin D. C. et al., 2005, ApJL, 619, L1
- Martínez-Arnáiz et al. (2011) Martínez-Arnáiz R., López-Santiago J., Crespo-Chacón I., Montes D., 2011, MNRAS, 414, 2629
- Mathioudakis & Doyle (1989) Mathioudakis M., Doyle J. G., 1989, A&A, 224, 179
- Mohanty & Basri (2003) Mohanty S., Basri G., 2003, ApJ, 583, 451
- Monet et al. (2003) Monet D. G. et al., 2003, AJ, 125, 984
- Neuhäuser et al. (1995) Neuhäuser R., Sterzik M. F., Schmitt J. H. M. M., Wichmann R., Krautter J., 1995, A&A, 297, 391
- Oranje et al. (1982) Oranje B. J., Zwaan C., Middelkoop F., 1982, A&A, 110, 30
- Osten et al. (2006) Osten R. A., Hawley S. L., Allred J., Johns-Krull C. M., Brown A., Harper G. M., 2006, ApJ, 647, 1349
- Pagano et al. (2000) Pagano I., Linsky J. L., Carkner L., Robinson R. D., Woodgate B., Timothy G., 2000, ApJ, 532, 497
- Penz & Micela (2008) Penz T., Micela G., 2008, A&A, 479, 579
- Perryman & ESA (1997) Perryman M. A. C., ESA, eds., 1997, ESA Special Publication, Vol. 1200, The HIPPARCOS and TYCHO catalogues. Astrometric and photometric star catalogues derived from the ESA HIPPARCOS Space Astrometry Mission
- Redfield et al. (2002) Redfield S., Linsky J. L., Ake T. B., Ayres T. R., Dupree A. K., Robinson R. D., Wood B. E., Young P. R., 2002, ApJ, 581, 626
- Reid et al. (2007) Reid I. N., Cruz K. L., Allen P. R., 2007, AJ, 133, 2825
- Reid et al. (1995) Reid I. N., Hawley S. L., Gizis J. E., 1995, AJ, 110, 1838
- Reiners et al. (2012) Reiners A., Joshi N., Goldman B., 2012, AJ, 143, 93
- Ribas et al. (2005) Ribas I., Guinan E. F., Güdel M., Audard M., 2005, ApJ, 622, 680
- Robinson et al. (2005) Robinson R. D. et al., 2005, ApJ, 633, 447
- Rodriguez et al. (2011) Rodriguez D. R., Bessell M. S., Zuckerman B., Kastner J. H., 2011, ApJ, 727, 62
- Rojas-Ayala et al. (2012) Rojas-Ayala B., Covey K. R., Muirhead P. S., Lloyd J. P., 2012, ApJ, 748, 93
- Sanz-Forcada et al. (2011) Sanz-Forcada J., Micela G., Ribas I., Pollock A. M. T., Eiroa C., Velasco A., Solano E., García-Álvarez D., 2011, A&A, 532, A6
- Schmitt & Rosso (1988) Schmitt J. H. M. M., Rosso C., 1988, A&A, 191, 99
- Scholz et al. (1999) Scholz R.-D., Irwin M., Schweitzer A., Ibata R., 1999, A&A, 345, L55
- Schrijver & Rutten (1987) Schrijver C. J., Rutten R. G. M., 1987, A&A, 177, 143
- Segura et al. (2005) Segura A., Kasting J. F., Meadows V., Cohen M., Scalo J., Crisp D., Butler R. A. H., Tinetti G., 2005, Astrobiology, 5, 706
- Shkolnik et al. (2011) Shkolnik E. L., Liu M. C., Reid I. N., Dupuy T., Weinberger A. J., 2011, ApJ, 727, 6
- Simon et al. (2006) Simon M., Bender C., Prato L., 2006, ApJ, 644, 1183
- Smith et al. (2004) Smith D. S., Scalo J., Wheeler J. C., 2004, Icarus, 171, 229
- Stelzer et al. (2012) Stelzer B. et al., 2012, A&A, 537, A94
- Stelzer & Neuhäuser (2001) Stelzer B., Neuhäuser R., 2001, A&A, 377, 538
- Tarter et al. (2007) Tarter J. C. et al., 2007, Astrobiology, 7, 30
- Taylor (2005) Taylor M. B., 2005, in Astronomical Society of the Pacific Conference Series, Vol. 347, Astronomical Data Analysis Software and Systems XIV, Shopbell P., Britton M., Ebert R., eds., p. 29
- Tian et al. (2008) Tian F., Kasting J. F., Liu H.-L., Roble R. G., 2008, Journal of Geophysical Research (Planets), 113, 5008
- Torres et al. (2006) Torres C. A. O., Quast G. R., da Silva L., de La Reza R., Melo C. H. F., Sterzik M., 2006, A&A, 460, 695
- van Leeuwen (2007) van Leeuwen F., 2007, A&A, 474, 653
- Vilhu (1984) Vilhu O., 1984, A&A, 133, 117
- Vilhu & Walter (1987) Vilhu O., Walter F. M., 1987, ApJ, 321, 958
- Walkowicz et al. (2008) Walkowicz L. M., Johns-Krull C. M., Hawley S. L., 2008, ApJ, 677, 593
- Watson et al. (2009) Watson M. G. et al., 2009, A&A, 493, 339
- Welsh et al. (2006) Welsh B. Y. et al., 2006, A&A, 458, 921
- Welsh et al. (2007) Welsh B. Y. et al., 2007, ApJS, 173, 673
- Zuckerman et al. (2001) Zuckerman B., Song I., Bessell M. S., Webb R. A., 2001, ApJL, 562, L87
| Name | Gl/GJ | SpT | ||||
| [pc] | [K] | [] | [km/s] | |||
| PM I00054-3721 | Gl 1 | M1.5 | 3575 | |||
| PM I00115+5908 | M5.5 | 2936 | … | |||
| PM I00154-1608 | GJ 1005 AB | M4.0 | 3165 | |||
| PM I00184+4401 | Gl 15 B | M3.5 | 3241 | |||
| PM I01025+7140 | Gl 48 | M3.0 | 3318 | |||
| PM I01026+6220 | Gl 49 | M1.5 | 3575 | |||
| PM I01103-6726 | Gl 54 | M2.0 | 3500 | … | ||
| PM I01125-1659 | Gl 54.1 | M4.5 | 3089 | |||
| This table is available in its entirety in the electronic edition of MNRAS. Here only the first eight rows are | ||||||
| shown to illustrate the format. | ||||||
| Name | |||||||||
|---|---|---|---|---|---|---|---|---|---|
| PM I00054-3721 | |||||||||
| PM I00115+5908 | |||||||||
| PM I00154-1608 | |||||||||
| PM I00184+4401 | |||||||||
| PM I01025+7140 | |||||||||
| PM I01026+6220 | |||||||||
| PM I01103-6726 | |||||||||
| PM I01125-1659 | |||||||||
| This table is available in its entirety in the electronic edition of MNRAS. Here only the first eight rows are shown to illustrate the format. | |||||||||