Search for correlations between solar flares and decay rate of radioactive nuclei
Abstract
The deacay rate of three different radioactive sources (40K, 137Cs and natTh) has been measured with NaI and Ge detectors. Data have been analyzed to search for possible variations in coincidence with the two strongest solar flares of the years 2011 and 2012. No significant deviations from standard expectation have been observed, with a few sensitivity. As a consequence, we could not find any effect like that recently reported by Jenkins and Fischbach: a few per mil decrease in the decay rate of 54Mn during solar flares in December 2006.
keywords:
Radioactivity , Solar Flare , Gran Sasso1 Introduction
In the past years, a correlation between the Sun and the decay rate of radioactive isotopes has been proposed. In particular, two effects have been considered: the annual modulation due to the seasonal variation of the Earth-Sun distance [1] and the decrease of the decay rate during a solar flare [2]. In this letter we are interested in the latter phenomenon.
Briefly, solar flares are explosions on the surface of the Sun near sunspots. They are powered by the release of magnetic energy stored in the corona, up to one hundredth of the solar luminosity, and they affect all layers of solar atmosphere, from the photosphere to the corona. On the Sun this amount of energy is released within a few minutes to tens of minutes. In this interval the plasma is heated to tens of millions of degrees with a strong X-ray emission and electron and proton acceleration (up to several tens and hundreds of MeV, respectively).
In particular, the 2006 flares from December 2nd 2006 to January 1st 2007 gave rise to X-ray fluxes which, measured on the the Geostationary Operational Environmental Satellites (GOES), were of a few times 10-4 W/m2 at the peak (see Fig. 1 of reference [2] for details). At that time the activity of a 1 Ci source of 54Mn was being measured by Jenkins and Fischbach [2] with a 2x2 inch NaI crystal detecting the 835 keV -ray emitted after the electron capture decay. A significant dip (up to 410-3, 7 effect), in the count rate, averaged on a time interval of 4 hours, has been observed in coincidence with the solar flares. On the other hand, a different experiment with a 10-3 sensitivity, carried out by Parkhomov [3], did not observe any deviation in the activity of 60Co, 90Sr-Y and 239Pu sources in coincidence with the same flare.
After a few years of quiet Sun, solar activity is now increasing, as shown both by the increase of the steady X-ray flux as well as of X-flares and of other typical solar phenomena. As a matter of fact, we are approaching the maximum of the 11 year solar cycle which is predicted to take place in Fall 2013. In our analysis we focus on the two most intense flares of the last years, namely those that occurred on August 2011 and March 2012: X6.9 on August 9th 2011 @ 08:08 UTC and X5.4 on March 7th 2012 @ 00:24 UTC [4].
| Flare time | Peak intensity | Source | detector | Observed decay type | Mean counting rate | Integration time |
|---|---|---|---|---|---|---|
| August 9th 2011 08:08 UTC | X6.9 | HPGe | 680 Hz | 1 hour | ||
| March 7th 2012 00:24 UTC | X5.4 | |||||
| August 9th 2011 08:08 UTC | X6.9 | NaI | decay chain | 3300 Hz | 24 hours | |
| March 7th 2012 00:24 UTC | X5.4 | NaI | EC | 790 Hz | 1 hour |
Solar flares are classified according to the power of the X-ray flux peak near the Earth as measured by the GOES-15 geostationary satellite: X identifies the class of the most powerful ones, with a power at the peak larger than 10-4 W/m2 (within the X-class there is then a linear scale). The two flares were well defined in time (a few minutes) and they illuminated the entire Earth. Their intensities are comparable, or even larger, than those observed in December 2006. During the 2011 flare the activity of the 137Cs and natTh sources were being measured with a Ge and with a NaI detector, respectively. On the other hand, during the 2012 flare the 137Cs and 40K sources were being studied with the same Ge detector and with a different NaI detector, as described in the next section. These different nuclides gives the possibility to search for possible effects correlated with solar flares in three different decay processes: alpha, beta and electron capture.
2 The set-ups
Table 1 summarizes the information on the experimental set-ups we are running to search for modulations in the decay rates of different radioactive sources (period from few days to one year). In particular, in this letter we only consider an interval of days around the time of the 2 solar flares in order to search for any significant deviation (positive or negative) in the decay rate correlated with the flares. The choice of this time window is quite arbitrary, since there is no model, to our knowledge, that correlates the flare intensity with the activity of a radioactive source. On the other hand, we note that, according to data shown in Fig. 2 of [2], the alleged influence of the flare on the source activity lasts for a few days around the occurrence of the flare.
2.1 Potassium source
A 3x3 inch NaI crystal is surrounded by about 16 kg of potassium bicarbonate powder. The set-up, installed above ground, is shielded by at least 10 cm of lead. The total count rate in the 17-3400 keV energy window is about 800 Hz, to be compared to the background of less than 3 Hz when the source is removed. The energy spectrum is dominated by the full energy peak at 1461 keV energy due to the electron-capture decay of 40K to 40Ar. The peak position and the energy resolution ( keV at 1461 keV) are fairly constant over months.
2.2 Cesium source
The activity of a 3 kBq 137Cs source is being measured since June 2011. The set-up is installed in the low background facility STELLA (SubTErranean Low Level Assay) located in the underground laboratories of Laboratori Nazionali del Gran Sasso (LNGS). The detector is a p-type High Purity Germanium (96 efficiency) with the source firmly fixed to its copper end-cap and it is surrounded by at least 5 cm of copper followed by 25 cm of lead to suppress the laboratory gamma ray background. Finally, shielding and detector are housed in a polymethylmetacrilate box flushed with nitrogen at slight overpressure and which is working as an anti-radon shield. The total count rate above the 7 keV threshold is of 680 Hz. The intrinsic background, i.e shielded detector without Cs source, has been measured during a period of 70 days: thanks to the underground environment and to the detector shielding, it is very low, down to about 40 counts/hour above the threshold (0.01 Hz). The spectrum is dominated by the 661.6 keV line due to the isomeric transition of 137mBa from the beta decay of 137Cs.
Details of the experiment and the results obtained in the first 210 days of running to search for an annual modulation of the 137Cs decay constant are given in [5]. Briefly, a limit of 8.510-5 at 95 C.L. is set on the maximum allowed amplitude independently of the phase.
2.3 Thorium source
The activity of a sample of natural Thorium is measured with a 3x3 inch NaI crystal installed underground in the same laboratory as the Germanium experiment with the 137Cs source. The sample is an optical lens, made by special glass heavily doped with Thorium Oxide. Note that this technique, used for improving the optical properties of glass, was quite common until the seventies. The lens is placed close to the crystal housing and both the lens and the NaI detector are shielded with at least 15 cm of lead. The total count rate above the threshold of 10 keV is of about 3200 Hz (gammas from 228Ac , 212Bi, 212Pb, 208Tl), with a background of 2.3 Hz (due to 40K, thorium and uranium chains and lead X-rays). The energy spectrum is acquired once a day, with a corrected dead time of 2.63. Even if the chain is not at the equilibrium, the total count rate increases by only over a time period of 1 month.
3 Results
We consider separately the two largest solar flares occurred in the data taking period, i.e. X6.9 August 9th 2011 and X5.4 March 7th 2012 [4]. For each of them only two of the set-ups given in Table 1 were running. As a matter of fact, the natTh set-up went out of order in February 2012, due to a failure in the DAQ system, whereas the 40K set-up started taking data in November 2011. On the contrary, the 137Cs set-up is continuously running since June 2011.
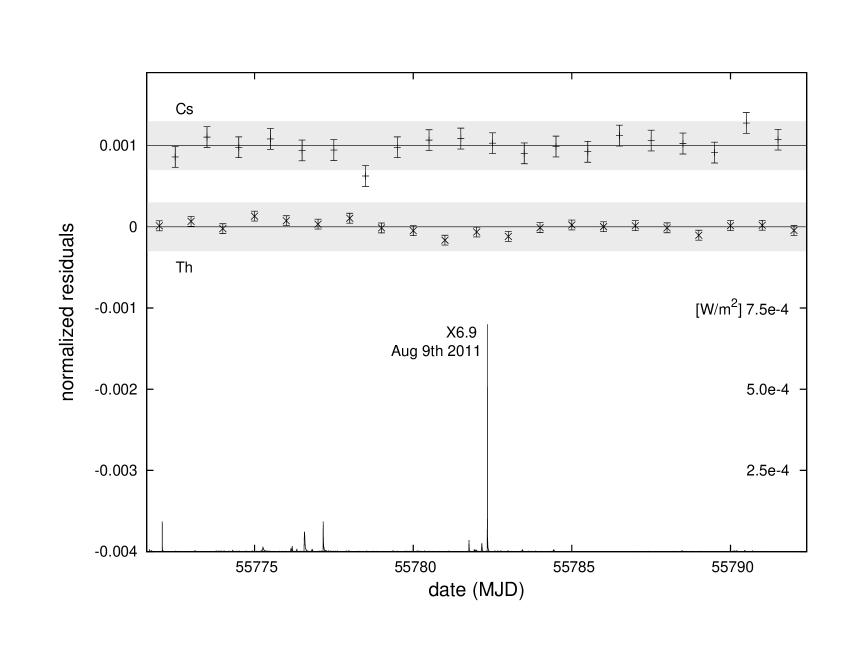
Figure 1 shows the data collected in a 20 day window centered on the August 9th 2011 flare (the day is given in terms of the Modified Julian Date). The X-ray peak flux is plotted in linear scale and given in W/m2, in the 0.1-0.8 nm band measured by the GOES-15 satellite [4]. Inside the two bands are plotted the residuals of the normalized count rate of the natTh and 137Cs sources (i.e. the difference between the measured and expected count rate divided by the measured one), averaged over a period of 1 day.
The error bars are purely statistical. Systematic errors are negligible as compared to the statistical ones during a data taking period of a few days only. For the natTh data a linear trend (5.7 ppm/day), due to the recovering of the secular equilibrium, is subtracted, while the 137Cs data are corrected for the exponential decay of the source, using the nominal mean life value of 43.38 y. This latter correction amounts to 63 ppm/day.
From the data we can conclude that the 137Cs source does not show any significant dip or excess in correspondence with the X-ray main peak. On the other hand, the natTh source shows a questionable dip in the count rate, starting 1.5 days before the X-flare. However, the dip is well compatible with a statistical fluctuation. As a matter of fact, fluctuations of the same order of magnitude can be seen at different times during the data taking, uncorrelated with X-ray flux peaks. In any case, the existence in our data of an effect as large as the one reported in [2], of the order of a few per mil per day and lasting several days, can be excluded. The maximum effect compatible with our data is smaller than per day at confidence level for the X6.9 flare. Such a limit is obtained by adding the double of the error to the value of the dip.
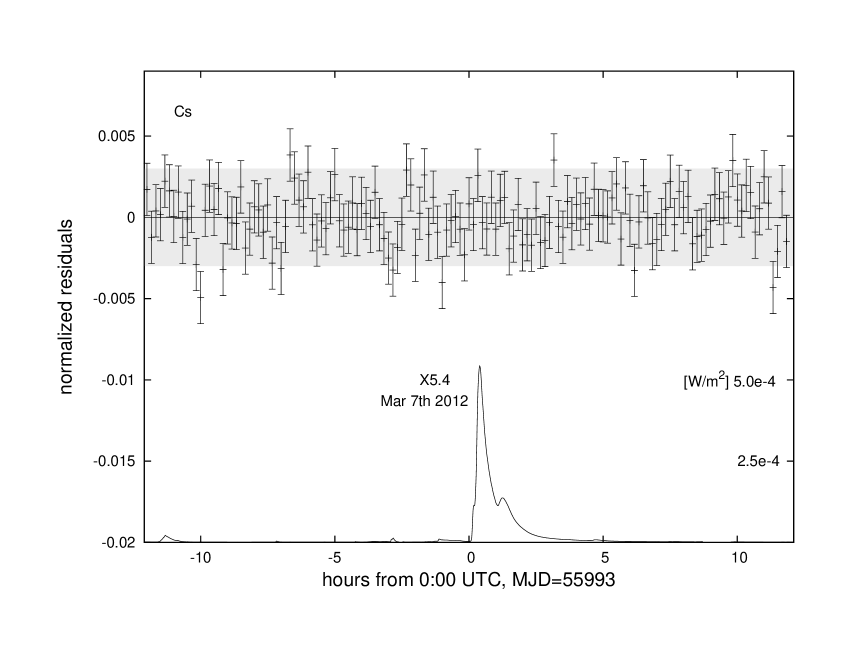
In Figure 2 similar data for the March 7th 2012 flare are presented. Also in this case, no significant effect can be seen related to the occurrence of the X5.4 flare, both in the 137Cs and in the 40K data. An upper limit similar to the one given above can be issued by taking twice the statistical error. Note that no effect can be seen also in correspondence with the arrival on earth of the two CME (coronal mass emission) related to this earth facing flare, respectively on March 8th and 11th 2012 (55994 and 55997 MJD).
During this March 7th 2012 flare we were taking the 137Cs data also with a fully digital list mode data acquisition system, recording the time of each event. As a consequence, we can have the source count rate averaged over shorter time than the day or the hour. In particular, Figure 3 shows the 137Cs source residuals averaged over 10 minutes in a 24 hour time window containing the X-ray peak. Again, no fast occurring effect incompatible with a statistical fluctuation and larger than (at ) can be seen (we note that the sensitivity scales linearly with the square root of the averaging time). We cannot repeat this analysis for the 2011 flare because at the very timing of the flare the data acquisition has been stopped for an hour due to liquid nitrogen refilling of the Germanium detector.
4 Conclusion
The gamma activity of three different sources, 40K (electron capture) , 137Cs (beta decay) and natTh (alpha and beta decays) have been measured during the occurrence of at least one of the two strongest solar flares of the years 2011 and 2012. No significant deviations from expectations have been observed. Up to now there are no quantitative models able to correlate the flare intensity with the decay constant of radioactive isotopes. However, from our data it is possible to conclude that a universal deviation of decay rate (alpha or beta or electron capture decay) is less than 10-4 per day for a flare of 10-4 W/m2 flux at the peak. By ’universal’ we mean a deviation in the count rate affecting in the same way all radioactive isotopes decaying through the same basic mechanism. We are now continuing the life-time measurements to search for modulations in the decay rate of different nuclides. This way we will have the opportunity to further investigate the issue of the solar flare correlation with nuclear decay in case stronger flares should happen closer in time to the expected 2013 solar maximum.
5 Acknowledgments
The Director of the LNGS and the staff of the Laboratory are warmly acknowledged for their support. We want to thank also Prof. Roberto Battiston for his continuous encouragement.
References
- [1] J.H. Jenkins et al., Astropart. Phys. 32 (2009) 42.
- [2] J.H. Jenkins et E. Fischbach, Astroparticle Physics 31 (2009) 407.
- [3] A.G. Parkhomov, arXiv:1006.2295 (2010).
-
[4]
Space Weather Prediction Center
http://www.swpc.noaa.gov/index.html - [5] E. Bellotti et al., Phys. Lett. B 710 (2012) 114.