Potential Importance of Binary Evolution in UV-Optical Spectral Fitting of Early-Type Galaxies
Abstract
Binaries are very common in galaxies, and more than half of Galactic hot subdwarf stars, which are thought as a possible origin of UV-upturn of old stellar populations, are found in binaries. Previous works showed that binary evolution can make the spectra of binary star populations significantly different from those of single star populations. However, the effect of binary evolution has not been taken into account in most works of spectral fitting of galaxies. This paper studies the role of binary evolution in spectral fitting of early-type galaxies, via a stellar population synthesis model including both single and binary star populations. Spectra from ultraviolet to optical band are fitted to determine a few parameters of galaxies. The results show that the inclusion of binaries in stellar population models may lead to obvious change in the determination of some galaxy parameters and therefore it is potentially important for spectral studies. In particular, the ages of young components of composite stellar populations become much older when using binary star population models instead of single star population models. This implies that binary star population models will measure significantly different star formation histories (SFHs) for galaxies compared to single star population models. In addition, stellar population models with binary interactions measure larger dust extinctions than single star population models on average. It suggests that when using binary star population models instead of single star population models, negative extinctions are possibly unnecessary in spectral fitting of early-type galaxies.
1 Introduction
Binaries are common in galaxies, and their evolution is often different from single stars if binary components are not too far (Eggleton, 2006). In our Galaxy, the fraction of binaries is shown as large as about 50%. Binaries are found in different parts of the Galaxy, e.g., Galactic field, halo, and thick and thin discs (Duquennoy & Mayor, 1991; Fischer & Marcy, 1992; Mayor et al., 1992; Raghavan et al., 2010; Carney et al., 2005). In addition, most stars massive than the sun are born in binaries (Brinchmann, 2010), and the massive the stars, the larger the fraction of binaries (Lada & Lada, 2003). Therefore, binaries are absolutely important for understanding the stellar populations of galaxies, and it is necessary to study the role of binary evolution in stellar population studies. The importance of binaries has been recently listed as one of six important challenges in stellar population studies in the next decades by Brinchmann (2010). However, most previous works used single stars for modeling stellar populations because of the complexity of binary evolution and more input parameters in binary star stellar population synthesis (bsSPS). Besides, astronomers hope that binary evolution does not change the results of single star stellar population (ssSP) studies too much. If this is true, to take single star stellar population synthesis (ssSPS) will be a good choice for stellar population studies.
Meanwhile, a few works (e.g., Li et al. 2006; Han et al. 2007; Li & Han 2008a, c, b; Li et al. 2012a; Hernández & Bruzual 2011) have tried to investigate the effects of binary evolution on stellar population studies and have used binary star stellar population (bsSP) model in a few works (e.g., Li et al. 2006, 2010, 2012b; Marks & Kroupa 2011, 2012). It shows that binary evolution is able to reproduce many interesting results such as blue stragglers, red stragglers, extended main sequence (Li & Han, 2008a; Li et al., 2012b), and UV flux excess (hereafter UV-upturn) in elliptical galaxies (e.g., Han et al. 2007; Li & Han 2008a; Li et al. 2012a), without any special assumptions like very old age or high mass-loss (see Lee 1994; Park & Lee 1997; Bressan et al. 1994; Yi et al. 1997 for comparison). Binary evolution is shown as a natural explanation for UV-upturn of elliptical galaxies, because more than half of Galactic hot subdwarf stars are found in binaries (Ferguson et al., 1984; Allard et al., 1994; Thejll et al., 1995; Ulla & Thejll, 1998; Aznar Cuadrado & Jeffery, 2001; Maxted et al., 2001; Williams et al., 2001; Reed & Stiening, 2004), and it is well established that the vast majority (and quite possibly all) of hot subdwarfs are the results of binary interactions (Han et al., 2007). On the other side, the widely used ssSP models fail to reproduce UV-upturn for old stellar populations under normal assumptions. Thus it suggests that binaries are important and possibly the main contributors to UV-upturn spectra of old populations. In addition, it shows that binaries can change the results of simple stellar population (SSP) studies obviously (Li & Han, 2008b), when spectral line indices or colours are used to determine stellar population parameters (age and metallicity) of galaxies. Although the importance of binaries has been shown, it is far from well understanding the role of binaries. Deeper and more detailed studies are therefore needed. Because it is shown that binary evolution leads to significant change in the UV and optical spectra of populations (Li et al., 2012a), and fitting such spectra are the basis of most stellar population studies (see, the review of Walcher et al. 2011 or papers such as Cid Fernandes et al. 2004, 2005; Lu et al. 2006; Tojeiro et al. 2007; Koleva et al. 2008; Tojeiro et al. 2009; Koleva et al. 2009), it is important to study the effect of binaries on full spectrum fitting.
This work aims to investigate the potential importance of binary evolution in spectral studies of early-type galaxies. The reason for studying early-type galaxies is that their stellar populations are relatively simple, which can possibly be modeled by two population components (Li et al., 2012a). Our main purpose is to study how the results of spectral fitting can be changed by using bsSP models instead of ssSP models. UV-optical spectra will be fitted by homogeneous ssSP and bsSP models that vary from only including binary interactions or not when evolving stars.
The structure of this paper is as follows. Sect. 2 introduces stellar population models, and Sect. 3 describes spectral synthesis. Sect. 4 then presents the spectral fitting code (BS2fit) used in this work. In Sect. 5, for some mock galaxies, the galaxy parameters determined by ssSP and bsSP models are compared. Then in Sect. 6, a sample of 10 early-type galaxies are used to give a similar test. Finally, Sect. 7 summarizes and discusses on the results.
2 Stellar population model
An advanced stellar population synthesis model including both ssSPs and bsSPs (Li & Han, 2008a; Li et al., 2012a) is taken for this work. This model supplies homogeneous spectra for both simple and composite stellar populations (SSPs and CSPs) with or without binary interactions. This makes it possible to study the result changes caused only by binary evolution. In the following two subsections, we introduce the stellar population synthesis model for SSPs and CSPs, respectively.
2.1 Simple stellar populations
Simple stellar populations (SSPs) are built as follows. Firstly, some stars (primary components of binaries) are generated following an initial mass function (IMF) of Chabrier (2003) with lower and upper mass limits of 0.1 and 100 M⊙ respectively. Then for each binary, the mass of its secondary component is generated by taking an uniform distribution for the mass ratio (, 0–1) of secondary to primary component (Mazeh et al. 1992; Goldberg & Mazeh 1994). The separation () between two binary components is given following an assumption that the fraction of binary in an interval of log() is constant when is big (10 5.75 106) and it falls off smoothly when is small ( 10) (Han et al., 1995), which can be written as
| (1) |
where and . The eccentricity () of each binary system is generated according to an uniform distribution. In this method, each population contains about 50% binaries with orbital period less than 100 yr, which is similar to the typical binary fraction of the Galaxy. When building binary star simple stellar populations (bsSSPs), the interactions between two binary components are taken into account when evolving stars, but all stars are evolved separately when building single star simple stellar populations (ssSSPs). All stars of an SSP are assumed to form in a star burst and have the same metallicity.
After the generation of population stars, all of them (4 000 000) are evolved using the rapid stellar evolution code of Hurley et al. (2002) (Hurley code). Most binary evolution processes such as mass transfer, mass accretion, common-envelope evolution, collisions, supernova kicks and angular momentum loss are included for bsSPs. Different mass transfer mechanisms, i.e., dynamical mass transfer, nuclear mass transfer and thermal mass transfer are taken into account using the results of many works (e.g., Tout et al. 1997; Hjellming & Webbink 1987). One can see Hurley et al. (2002) for more details. Some default values for Hurley code, i.e., 0.5, 1.5, 1.0, 0.0, 0.001, 3.0, 190.0, 0.5, and 0.5, are taken for wind velocity factor (), Bondi-Hoyle wind accretion faction (), wind accretion efficiency factor (), binary enhanced mass loss parameter (), fraction of accreted material retained in supernova eruption (), common-envelope efficiency (), dispersion in the Maxwellian distribution for the supernovae kick speed (), Reimers coefficient for mass loss (), and binding energy factor (), respectively. We take these default values, because they have been checked in the work of Hurley et al. (2002). Although these default values remain somewhat large uncertainties, the results for spectral stellar population synthesis will be not affected too much by the uncertainties in these parameters, according to a test in our previous work (Li et al., 2012a). In addition, because Hurley code uses some fitting formulae to calculate the evolution of stars, it causes about 5% uncertainty in the evolutionary parameters of stars.
The evolutionary parameters of stars are finally transformed to the spectral energy distributions (SED) (or spectra) of stellar populations by BaSeL 3.1 spectral library (Lejeune et al., 1997, 1998; Westera et al., 2002). The library is chosen here because of its wide wavelength coverage and reliability. The uncertainties in the spectra of populations caused by the spectral library is small (about 3% on average). In the same way, the homogenous spectra of both ssSSPs and bsSSPs are computed. Note that the only difference between two kinds of models is that bsSSPs take binary interactions into account but ssSSPs do not.
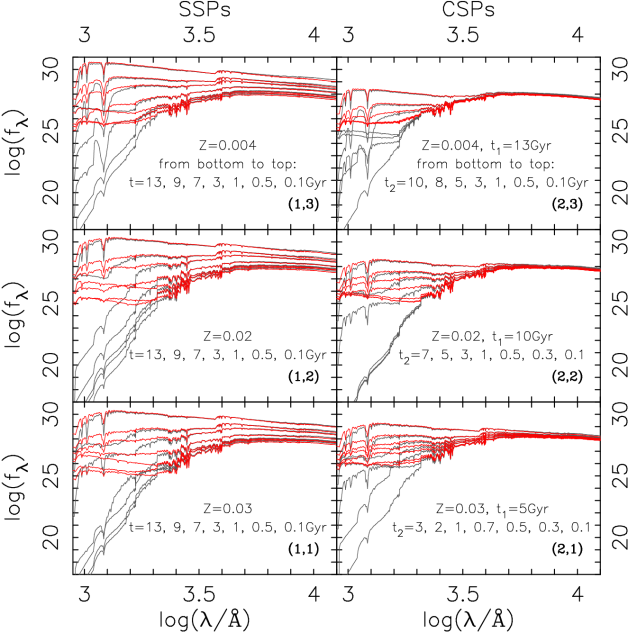
When comparing the spectra of bsSSPs to those of ssSSPs, we find obvious difference. The left panels of Fig. 1 show the comparison of spectra of two kinds of populations. It is clear that the spectra of bsSSPs and ssSSPs are different, especially in UV band. Many old ( 3 Gyr, bottom lines) bsSSPs show UV-upturn spectra, which is mainly caused by hot subdwarf and blue straggler stars (e.g., Han et al. 2007), but all old ssSSPs do not have similar spectra. Because UV-upturn phenomenon has been observed in many elliptical galaxies (O’Connell, 1999), which are usually thought as SSPs, our result suggests that bsSSPs can better fit to early-type galaxies than ssSSPs. In binary evolution, the formation channels for hot subdwarfs are common-envelope ejection, stable Roche lobe overflow, and merger of helium white dwarfs (WDs) (see also Han et al. 2007).
2.2 Composite stellar populations
The SEDs of CSPs are built on the basis of SEDs of SSPs. Because there is no common result for the star formation histories (SFHs) of early-type galaxies, a simple method is taken to model CSPs. In detail, each CSP is assumed to contain a pair of old and young components with the same metallicity. This assumption is in agreement of previous studies that early-type galaxies are dominated by old populations and there is only a little fraction of young populations in such galaxies. The mass fraction of young component is assumed to be dependent on the ages of two components of CSPs, which is calculated by formula (2). It means that the mass fraction of young component declines exponentially with increasing difference between the ages of old and young components. This agrees with previous studies on the SFHs of early-type galaxies, e.g., Thomas et al. (2005).
| (2) |
where is the mass fraction of young component; and are the ages of old and young components of a CSP, respectively. As a standard model, is taken as 3.02, according to the observational fraction of bright early-type galaxies with recent ( 1 Gyr) star formation at a level more than 1–2% (Yi et al., 2005; Li & Han, 2007).
By the above method, the SEDs of single and binary star composite stellar populations (ssCSPs and bsCSPs) are calculated. In the right panels of Fig. 1, the SEDs of two kinds of CSPs are compared. For some pairs of ssCSP and bsCSP with the same parameters, we see clear difference between the SEDs of two kinds of populations. Similar to the case of SSPs, the UV spectra of two kinds of populations are obviously different. In addition, we find that both ssCSPs and bsCSPs can show UV-upturn spectra, but UV-upturn comes from different reasons. The UV-upturn of bsCSPs are mainly caused by binary evolution, but that of ssCSPs by young stars. This suggests that bsCSP and ssCSP models possibly give different estimates for the SFHs of early-type galaxies.
3 Spectral synthesis
The observed spectra of stellar populations are built based on the SEDs of CSPs. According to our model, each CSP is described by three parameters: metallicity , old-component age , and young-component age . The effects of stellar velocity dispersion , extinction from dust around stellar population, redshift, and the extinction caused by the Milky Way are added to the SEDs of CSPs to form the observed spectra. Similar to the works of Cid Fernandes et al. (2005), the Line-of-sight stellar motions are modeled by a Gaussian distribution centered at velocity and with dispersion . The effect of dust around population, which is parametrized by -band optical depth , is modeled following the work of Charlot & Fall (2000). When modeling the Galactic extinction, which can be parametrized by -band extinction , the extinction law of Cardelli et al. (1989) with = 3.1 is adopted. The observed flux () at wavelength can be expressed by
| (3) |
where is the flux of a CSP with three parameters (), , ) is a Gaussian distribution with mean and standard deviation of and respectively, is the percentage of energy that pass through the dust with optical depth of , ) is the fraction of energy after the extinction () of Milky Way galaxy. denotes the convolution operator.
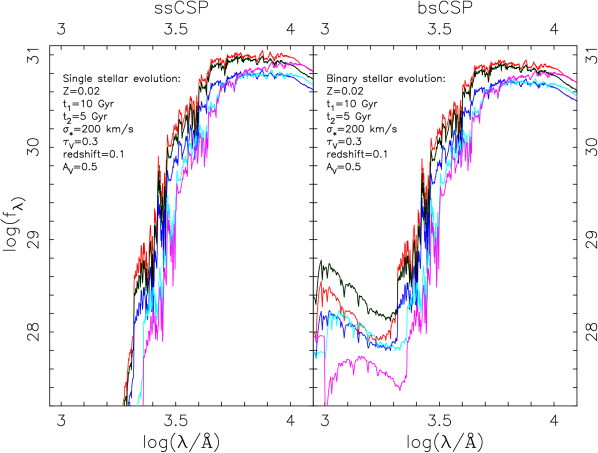
Fig. 2 gives two examples for the synthesis of the spectra of a pair of ssCSP and bsCSP. We see that Line-of-sight stellar motions (redshift and stellar velocity dispersion) affect the wavelength range and strength of absorption lines obviously, but stellar velocity dispersion does not affect continuum spectra too much. Meanwhile, the dust around stellar population and the Milky Way affects the whole spectra. We can also see significant difference between the spectra of ssCSPs and bsCSPs from this figure.
4 Spectral fitting: BS2fit code
Spectral fitting is an important technique to determine many properties of galaxies, e.g., redshift, stellar metallicity, age, velocity dispersion, mass, and dust extinction, because different wavelengths are usually dominated by various physical processes. Thus it is a good choice to study the role of binary evolution in stellar population studies via spectral fitting. Although there are some available spectral fitting codes, e.g., MOPED (Heavens et al., 2000), PLATEFIT (Tremonti et al., 2004), STARLIGHT (Cid Fernandes et al. 2004, 2005), VESPA (Tojeiro et al. 2007, 2009), STECKMAP (Ocvirk et al., 2006), sedfit (Walcher et al., 2006), NBURSTS (Chilingarian et al., 2007), and ULYSS (Koleva et al. 2009), they are not very suitable for this work. Firstly, all of them are developed for some special works so that their fitting methods and wavelength coverages are not suitable for this work. For example, STARLIGHT aims to fit the optical spectra of SDSS galaxies but our work needs a wider wavelength coverage. VESPA studies the SFHs of galaxies via some binned parameters, but we want to do more accurate studies. Furthermore, there are some other limitations to use these codes, e.g., the dependence of internet connection or unaltered procedures. Therefore, we decide to create a new code. We call our new code binary star to fit (hereafter BS2fit), which can be used for spectral fitting via both bsSPs and ssSPs, within a wide wavelength range from UV to optical band. The new code can be briefly introduced as follows.
BS2fit code will be revised and updated111The code and data can be obtained on request to Zhongmu Li, and the authors are trying to make it available on the internet.. At this stage, BS2fit aims to determine a few parameters of early-type galaxies from observed spectra using bsSP or ssSP models. An observed spectrum is assumed to be determined by eight input parameters, i.e., , , , , , , , and total stellar mass . Because there are so many input parameters, it is not easy to get a best-fit result by directly searching for the combination of parameters with minimum in a high-resolution parameter grid. Therefore, we divide the fitting task into three parts. First, Line-of-sight velocity (or redshift) is determined by a few methods that are widely used (e.g., absorption or emission line fitting and cross-correlation analysis) (see e.g., Colless et al. 2001). Then the Galactic extinction parameter is determined from the direction of galaxy and dust map of the Galaxy (e.g., Burstein & Heiles 1982; Schlegel et al. 1998). Finally, the other parameters are determined based on fixed redshift and Galactic extinction. Although this has made fitting process much faster, it is still difficult to get the result by a direct search on a personal computer. Two techniques are therefore used to make the fitting significantly quick. One is to estimate the possible ranges of parameters using SSP models before comparing the observed spectrum to those of CSPs. We call this procedure SSP-fitting. This is very effective, because it guides the code to search in only limited ranges of parameters. This method is also reliable for most populations, because SSPs usually estimate lower metallicities, smaller stellar velocity dispersions, and younger ages for populations, compared to CSPs. In detail, Fig. 3 shows how the ranges of parameters of 74 test stellar populations are related to SSP-fitted parameters. On average, the parameter ranges of about 95 percent of CSPs can be well estimated from SSP-fitting.
The other technique for speeding up the fitting is to compare continuum spectra before comparing whole spectra. This skips many populations according to their continuum difference from the observed spectra. This can be done because there is a maximum change in continuum spectra corresponding to the effects of dust extinction and stellar velocity dispersion when their ranges are given. The goodness of a fit is judged by , where and are observed and theoretical spectra, while is the weight for wavelength . The best-fit result corresponds to minimum .
We mask out some emission line regions as they can affect the final results obviously. According to some previous works (McQuade et al. 1995; Panter et al. 2007; Tojeiro et al. 2007, 2009), the following emission-line regions in every spectrum’s rest frame wavelength range are masked out: 1213–1219, 1548–1550, 1637–1643, 1905–1911, 2323–2329, 2421–2427, 2796–2803, 3423–3429, 3711–3741, 4087–4117, 4325–4355, 4846–4876, 4944–4974, 4992–5022, 5885–5900, 6535–6565, 6548–6578, 6569–6599, 6702–6732, 6716–6746, 6728–6734, 7132–7138, 7319–7330 .
Because we want to make the results accurate enough, a high-resolution grid of parameters is taken. In detail, stellar metallicity () is from 0.0003 to 0.03, with an interval of 0.0001 when is less than 0.001 and an interval of 0.001 for higher metallicity. The old-component age () of populations is in the range of zero to 15 Gyr, with an interval of 0.1 Gyr, and the young-component age () decreases from to zero. Stellar velocity dispersion, , changes from 0 to 350 km s-1 by a step of 10 km s-1, and the optical depth () is between 0 and 1.5, with an interval of 0.01. Note that the ranges of and are chosen according to some previous works, e.g., Cid Fernandes et al. (2005) and Tojeiro et al. (2007).

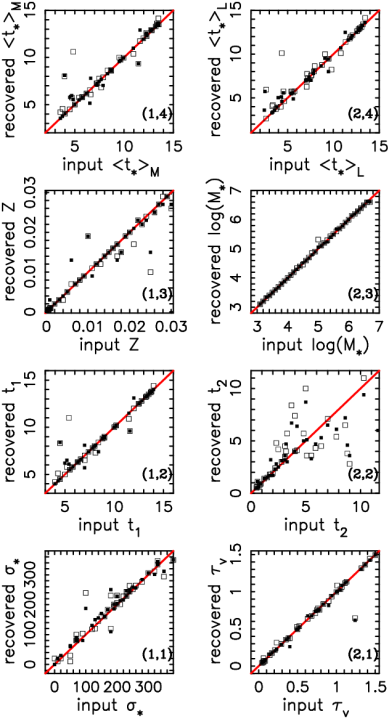
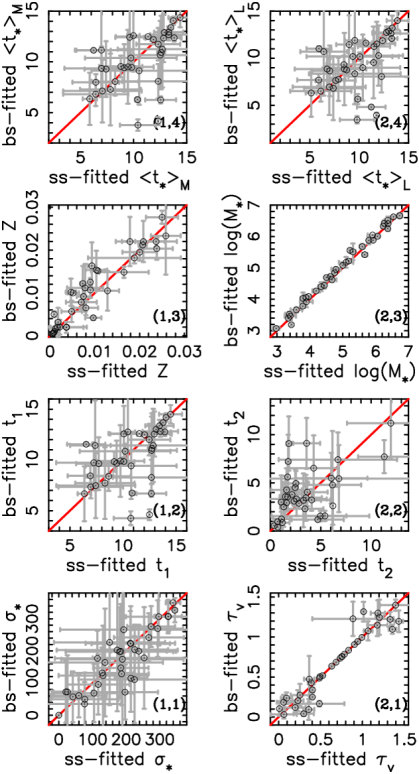
In order to check the accuracy of BS2fit code, Figs. 4 and 5 show the input versus recovered values of mass-weighted age , luminosity-weighted age , , , , , , , and of 37 ssCSPs (open squares) and 37 bsCSPs (filled squares). In the test relating to Fig. 4 all wavelengths are assumed the same weight because there is no error in spectra, while in the study corresponding to Fig. 5 the weight of each wavelength is set to be 1/, where is observational error. The stellar mass of each population is calculated from the input flux at 5500 and mass-to-light ratio of best-fit population. We see that when there is no error in input spectra, BS2fit code can well recover most parameters (Fig. 4), although the values of some populations with large ( 3.5 Gyr) input are not recovered accurately because of the degeneracy effects of various parameters on the same spectra. Note that the input spectra of a pair of ssCSP and bsCSP with the same set of input parameters are usually different.
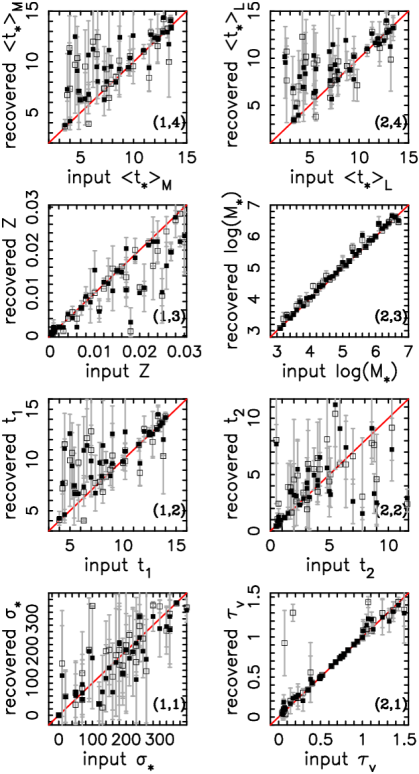
If there are uncertainties (signal-to-noise ratio S/N = 10) in input spectra (Fig. 5), BS2fit code reports obviously larger ages (especially ) for most populations. This because the change of spectra is less sensitive to the age change of old populations. Moreover, the uncertainties in input spectra result in lower estimates for stellar metallicities of some populations, because the change of spectra has different sensitivities to the metallicity changes of metal-poor and rich populations. The deviations in stellar age and metallicity are also related to the well-known age–metallicity degeneracy. Therefore, the S/N of observed spectra is crucial for constraining the stellar metallicities and ages of galaxies. In addition, we see that usually bsCSP and ssCSP models lead to similar difference between the input and recovered parameters. This means that BS2fit code can be used to study the difference between galaxy parameters, which are caused by taking various (bsCSP and ssCSP) models, although the values of parameters may be not so accurate. Note that the fitted parameters and uncertainties are given statistically by taking the average and 1 deviation of the results of fitting some perturbed spectra that are generated randomly according to the observational uncertainty (see also Cid Fernandes et al. 2005; Tojeiro et al. 2007).
5 Results from mock galaxies
This section studies the difference between bsSP and ssSP-fitted results, via a sample of 37 mock galaxies, which covers wide parameter ranges. We assume that all mock galaxies are bsCSPs, as almost all galaxies may contain some binaries. In addition, because any observed spectrum possibly contains some uncertainties, the effect of observational uncertainties is taken into account. Similar to the previous section, the S/N of spectra is set to 10, and is given as 1/.
Fig. 6 shows the comparison of bsSP and ssSP-fitted parameters of 37 bsCSPs (mock galaxies). We see that ssSP and bsSP-fitted results for mass and luminosity-weighted ages, metallicity, stellar mass, old-component age, stellar velocity dispersion, and galactic dust extinction are roughly consistent when uncertainties are taken into account. In particular, ssSP and bsSP-fitted stellar masses are almost the same. However, bsSP-fitted young-component ages () are different from ssSP-fitted results, significantly. For mock galaxies with ssSP-fitted younger than 3.5 Gyr, bsSP models measure much older young population components for most mock galaxies. This suggests that ssSP models usually measure more recent star formations for early-type galaxies, compared to bsSP models. In this case, maybe many early-type galaxies do not contain so much recent star formations as the results of Chen et al. (2012), which was obtained using some ssSP models.
6 Results from real galaxies
In this section, we try to compare the galaxy parameters that are determined via ssSP and bsSP models, for 10 early-type galaxies. The data are selected from a catalogue of UV-optical spectra of 99 local galaxies, which is available on the internet222ftp://ftp.stsci.edu/pub/catalogs/nearby-gal/sed.html. The advantage of using these data is the wide wavelength coverage from UV to optical band. Because binaries affect UV spectra obviously (Han et al., 2007; Li & Han, 2008a; Li et al., 2012a), such data seems ideal for exploring the effect of binary evolution on spectral fitting. Besides some emission lines, we also mask out the spectra around two conjunction wavelengths (2000 and 3000 ) as the two parts contain obviously larger uncertainties. In addition, because the quality of optical spectra is better than UV spectra, optical spectra are given higher weights by taking S/N = 8, while the S/N of UV spectra is taken as 7. The S/N values are given according to a description of the data (Kinney et al., 1996), but the data quality seems not as good as S/N = 8, because the minimum values of fittings are obviously larger than 1.
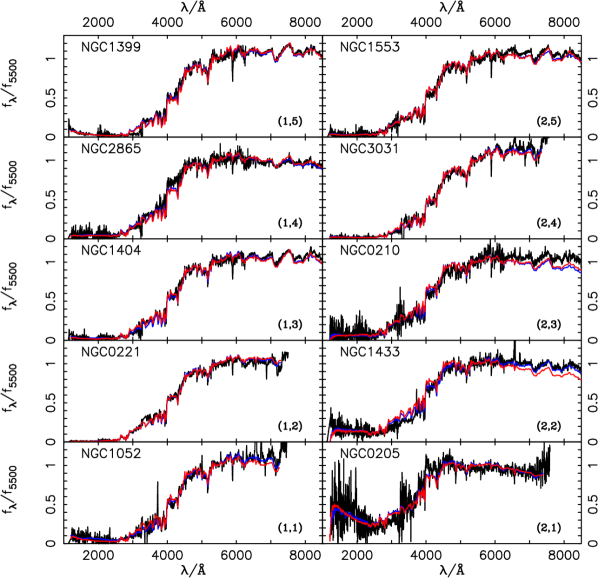
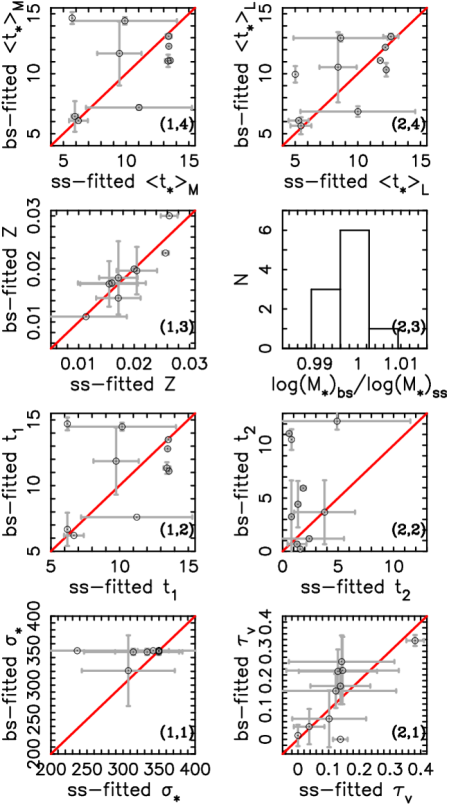
Using BS2fit code, six parameters of 10 galaxies are determined, and the ssSP and bsSP-fitted results are then compared. For convenience, we take the redshifts of 10 galaxies from NASA/IPAC Extragalactic Database (NED). The original results were obtained by Wegner et al. (2003); da Costa et al. (1991); Tully et al. (2008); Koribalski et al. (2004); Huchra et al. (1999); Denicoló et al. (2005). The Galactic extinctions are calculated using the extinction calculator of NED, which uses the data and technique of Schlegel et al. (1998). Tables 1 and 2 list the ssSP and bsSP-fitted parameters of 10 galaxies. Because the quality of observed spectra is not very good, the result for stellar velocity dispersion may be not accurate. Fig. 7 compares the best-fit spectra of ssSP and bsSP fittings with observed ones, and Fig. 8 compares ssSP and bsSP-fitted parameters. We find that both ssSP and bsSP models can fit to the spectra of eight galaxies, i.e, NGC1399, NGC1553, NGC2865, NGC3031, NGC1404, NGC221, NGC1052, and NGC205. At the same time, both bsSP and ssSP models do not fit the spectra part with wavelength larger than 6000 for NGC210. This may result from the low upper metallicity (0.03) of our theoretical populations. In addition, we find that ssSPs can fit the observed spectra of NGC1433 better than bsSPs. This implies that most stars of this galaxy may be single stars, rather than binary stars.
Fig. 8 shows the comparison of ssSP and bsSP-fitted parameters of 10 galaxies. We see that ssSP and bsSP models report obviously different results for many parameters of galaxies. In particular, the bsSP-fitted young-component ages () of six galaxies are significantly older than ssSP-fitted results, and the bsSP-fitted dust extinctions () of half galaxies are obviously larger than ssSP-fitted results. In addition, two kinds of stellar population models give different results for the mass-weighted, luminosity-weighted, and old-component ages of some galaxies. Furthermore, we see some difference between the bsSP and ssSP-fitted stellar velocity dispersions (). However, bsSP and ssSP models measure similar stellar metallicities and masses for most galaxies. When comparing the results of 10 real galaxies and 37 mock galaxies, we find good consistency: bsSP models measure older young-component ages and larger dust extinctions than ssSP models, while two types of models measure similar stellar metallicities and masses for galaxies. Because BS2fit can recover the ages of recent ( 3.5 Gyr) star bursts well (see Fig. 4), both tests of mock and real galaxies indicate that binary evolution affects the measurement of SFHs of early-type galaxies, significantly.
| Galaxy | redshift | ||||||||
|---|---|---|---|---|---|---|---|---|---|
| NGC1399 | 0.004753 | 0.0393 | 0.02630.0015 | 13.550.14 | 4.926.59 | 237195 | 0.1380.097 | 13.380.24 | 12.630.61 |
| NGC1553 | 0.004236 | 0.0468 | 0.01720.0035 | 9.751.65 | 2.403.13 | 33344 | 0.1430.172 | 9.461.76 | 8.421.49 |
| NGC2865 | 0.008619 | 0.1608 | 0.01720.0040 | 10.183.92 | 1.300.85 | 3500 | 0.0370.050 | 9.904.15 | 8.623.75 |
| NGC3031 | -0.000113 | 0.1486 | 0.02570.0006 | 13.500.00 | 0.820.05 | 3500 | 0.3820.029 | 13.400.00 | 12.190.06 |
| NGC1404 | 0.006391 | 0.0353 | 0.02050.0036 | 13.450.25 | 0.800.16 | 31468 | 0.1300.128 | 13.350.26 | 12.260.11 |
| NGC 210 | 0.005457 | 0.0673 | 0.01600.0061 | 6.680.72 | 1.870.23 | 34222 | 0.1460.183 | 6.200.75 | 5.280.80 |
| NGC 221 | -0.000667 | 0.4797 | 0.01130.0074 | 11.254.04 | 1.380.20 | 3500 | 0.1240.197 | 11.024.22 | 10.004.57 |
| NGC1433 | 0.003586 | 0.0282 | 0.01550.0052 | 6.200.00 | 3.782.74 | 3500 | 0.1020.120 | 5.910.26 | 5.460.83 |
| NGC1052 | 0.001004 | 0.0824 | 0.02000.0000 | 13.600.00 | 0.580.05 | 3500 | 0.1380.024 | 13.510.00 | 11.790.15 |
| NGC 205 | -0.000777 | 0.1685 | 0.01220.0005 | 6.200.00 | 1.600.00 | 30764 | 0.0000.000 | 5.700.00 | 5.020.01 |
| Galaxy | redshift | ||||||||
|---|---|---|---|---|---|---|---|---|---|
| NGC1399 | 0.004753 | 0.0393 | 0.03000.0000 | 13.500.00 | 12.270.81 | 3500 | 0.1820.062 | 13.130.20 | 13.100.23 |
| NGC1553 | 0.004236 | 0.0468 | 0.01830.0069 | 11.872.56 | 1.180.19 | 3485 | 0.2650.090 | 11.692.67 | 10.552.93 |
| NGC2865 | 0.008619 | 0.1608 | 0.01450.0033 | 14.480.30 | 0.680.16 | 3485 | 0.0430.060 | 14.410.31 | 12.980.29 |
| NGC3031 | -0.000113 | 0.1486 | 0.02300.0000 | 12.800.00 | 10.530.97 | 3500 | 0.3370.019 | 12.290.04 | 12.200.11 |
| NGC1404 | 0.006391 | 0.0353 | 0.01970.0045 | 11.330.45 | 3.253.43 | 3485 | 0.2320.075 | 11.070.52 | 10.330.56 |
| NGC 210 | 0.005457 | 0.0673 | 0.01730.0006 | 6.200.00 | 5.950.14 | 3500 | 0.2350.115 | 6.090.06 | 6.090.06 |
| NGC 221 | -0.000667 | 0.4797 | 0.01100.0000 | 7.600.00 | 4.432.19 | 3500 | 0.1650.058 | 7.180.19 | 6.850.44 |
| NGC1433 | 0.003586 | 0.0282 | 0.01720.0043 | 6.671.27 | 3.683.01 | 3500 | 0.0700.097 | 6.441.28 | 5.660.71 |
| NGC1052 | 0.001004 | 0.0824 | 0.02000.0000 | 11.100.00 | 11.100.00 | 3500 | 0.0000.000 | 11.100.00 | 11.100.00 |
| NGC 205 | -0.000777 | 0.1685 | 0.00320.0005 | 14.700.49 | 0.200.00 | 32151 | 0.0130.036 | 14.640.50 | 9.950.69 |
7 Conclusion and discussion
This paper investigates the potential importance of binary evolution in UV-optical spectral fitting of early-type galaxies, via a new spectral fitting code (BS2fit). Both the results of mock and real galaxies show that stellar population models including binary evolution will give different estimates for galaxy parameters such as young-component age and dust extinction. The difference between bsSP and ssSP-fitted young-component ages () can be as large as 7 Gyr (mock galaxies) or 10 Gyr (real galaxies), while the optical depth () can be different by about 0.15 if ssSP-fitted is low ( 0.25). Our results suggest that binary evolution can possibly play an important role in spectral fitting of early-type galaxies. It is therefore necessary to take binaries into account in spectral synthesis studies. Because stars of most galaxies are possibly formed in more than one star bursts, and SFHs supply unique information for studying galaxy formation and evolution, it is crucial to include the effects of binaries in stellar population models when studying the SFHs of galaxies. In addition, this study shows that bsSP models measure larger optical depth for galactic dust, because bsSPs are more luminous than ssSPs in UV band. This is possibly helpful for explaining why some minus extinction values are needed in some spectral fittings based on ssSP models (e.g., Cid Fernandes et al. 2005). Furthermore, although parameters such as old-component age and stellar velocity dispersion, which are derived from bsSP and ssSP models, are roughly consistent, the results for some specific galaxies are different a lot (e.g., 8 Gyr for and 100 km s-1 for ). This implies that binary evolution may affect more studies about galaxies.
A fixed binary fraction (50%) is taken for all bsSPs, although the real fraction may be different from a galaxy to another. However, our results are potentially useful, because 50% is a typical binary fraction of our Galaxy, and this fraction can fit the spectra of most galaxies. However, the assumption of separation of binary components may have obvious effects on the final results, although other adjustable parameters affect the results slightly (Hurley et al., 2002; Li et al., 2012a). On another side, although it is possible that UV-upturn is caused mainly by binary evolution, some single extreme horizontal branch (EHB) stars can also affect the UV flux of early-type galaxies (e.g., Brown et al. 2000). Thus our results actually show the maximum effects of binaries on spectral fittings of early-type galaxies. In addition, a simple assumption for SFH was used to model the CSPs of early-type galaxies. This is possibly reasonable for most galaxies, but it is interesting to do some researches via taking different SFHs. Furthermore, the stellar masses of populations were measured by the flux at 5500 in this work. If stellar mass is determined at other wavelengths, e.g., 4000 , the bsSP and ssSP-fitted stellar masses may be different more. Moreover, we used a rapid spectral fitting technique in BS2fit code because of the limitation of our computation ability. This leads to some uncertainties in the results. Although this does not affect the results of this work too much, it is necessary to make the code more accurate and check the results again.
References
- Allard et al. (1994) Allard, F., Wesemael, F., Fontaine, G., Bergeron, P., & Lamontagne, R. 1994, AJ, 107, 1565
- Aznar Cuadrado & Jeffery (2001) Aznar Cuadrado, R., & Jeffery, C. S. 2001, A&A, 368, 994
- Bressan et al. (1994) Bressan, A., Chiosi, C., & Fagotto, F. 1994, ApJS, 94, 63
- Brinchmann (2010) Brinchmann, J. 2010, in IAU Symposium, Vol. 262, IAU Symposium, ed. G. Bruzual & S. Charlot, 3–12
- Brown et al. (2000) Brown, T. M., Bowers, C. W., Kimble, R. A., Sweigart, A. V., & Ferguson, H. C. 2000, ApJ, 532, 308
- Burstein & Heiles (1982) Burstein, D., & Heiles, C. 1982, AJ, 87, 1165
- Cardelli et al. (1989) Cardelli, J. A., Clayton, G. C., & Mathis, J. S. 1989, ApJ, 345, 245
- Carney et al. (2005) Carney, B. W., Aguilar, L. A., Latham, D. W., & Laird, J. B. 2005, AJ, 129, 1886
- Chabrier (2003) Chabrier, G. 2003, ApJ, 586, L133
- Charlot & Fall (2000) Charlot, S., & Fall, S. M. 2000, ApJ, 539, 718
- Chen et al. (2012) Chen, Y.-M., Kauffmann, G., Tremonti, C. A., White, S., Heckman, T. M., Kovač, K., Bundy, K., Chisholm, J., Maraston, C., Schneider, D. P., Bolton, A. S., Weaver, B. A., & Brinkmann, J. 2012, MNRAS, 421, 314
- Chilingarian et al. (2007) Chilingarian, I., Prugniel, P., Sil’Chenko, O., & Koleva, M. 2007, in IAU Symposium, Vol. 241, IAU Symposium, ed. A. Vazdekis & R. F. Peletier, 175–176
- Cid Fernandes et al. (2004) Cid Fernandes, R., Gu, Q., Melnick, J., Terlevich, E., Terlevich, R., Kunth, D., Rodrigues Lacerda, R., & Joguet, B. 2004, MNRAS, 355, 273
- Cid Fernandes et al. (2005) Cid Fernandes, R., Mateus, A., Sodré, L., Stasińska, G., & Gomes, J. M. 2005, MNRAS, 358, 363
- Colless et al. (2001) Colless, M., Dalton, G., Maddox, S., Sutherland, W., Norberg, P., Cole, S., Bland-Hawthorn, J., Bridges, T., Cannon, R., Collins, C., Couch, W., Cross, N., Deeley, K., De Propris, R., Driver, S. P., Efstathiou, G., Ellis, R. S., Frenk, C. S., Glazebrook, K., Jackson, C., Lahav, O., Lewis, I., Lumsden, S., Madgwick, D., Peacock, J. A., Peterson, B. A., Price, I., Seaborne, M., & Taylor, K. 2001, MNRAS, 328, 1039
- da Costa et al. (1991) da Costa, L. N., Pellegrini, P. S., Davis, M., Meiksin, A., Sargent, W. L. W., & Tonry, J. L. 1991, ApJS, 75, 935
- Denicoló et al. (2005) Denicoló, G., Terlevich, R., Terlevich, E., Forbes, D. A., Terlevich, A., & Carrasco, L. 2005, MNRAS, 356, 1440
- Duquennoy & Mayor (1991) Duquennoy, A., & Mayor, M. 1991, A&A, 248, 485
- Eggleton (2006) Eggleton, P. 2006, Evolutionary Process in Binary and Multiple Stars, Cambridge University Press
- Ferguson et al. (1984) Ferguson, D. H., Green, R. F., & Liebert, J. 1984, ApJ, 287, 320
- Fischer & Marcy (1992) Fischer, D. A., & Marcy, G. W. 1992, ApJ, 396, 178
- Goldberg & Mazeh (1994) Goldberg, D., & Mazeh, T. 1994, A&A, 282, 801
- Han et al. (1995) Han, Z., Podsiadlowski, P., & Eggleton, P. P. 1995, MNRAS, 272, 800
- Han et al. (2007) Han, Z., Podsiadlowski, P., & Lynas-Gray, A. E. 2007, MNRAS, 380, 1098
- Heavens et al. (2000) Heavens, A. F., Jimenez, R., & Lahav, O. 2000, MNRAS, 317, 965
- Hernández & Bruzual (2011) Hernández, F. C., & Bruzual, G. 2011, in Revista Mexicana de Astronomia y Astrofisica Conference Series, Vol. 40, Revista Mexicana de Astronomia y Astrofisica Conference Series, 277–277
- Hjellming & Webbink (1987) Hjellming, M. S., & Webbink, R. F. 1987, ApJ, 318, 794
- Huchra et al. (1999) Huchra, J. P., Vogeley, M. S., & Geller, M. J. 1999, ApJS, 121, 287
- Hurley et al. (2002) Hurley, J. R., Tout, C. A., & Pols, O. R. 2002, MNRAS, 329, 897
- Kinney et al. (1996) Kinney, A. L., Calzetti, D., Bohlin, R. C., McQuade, K., Storchi-Bergmann, T., & Schmitt, H. R. 1996, ApJ, 467, 38
- Koleva et al. (2009) Koleva, M., Prugniel, P., Bouchard, A., & Wu, Y. 2009, A&A, 501, 1269
- Koleva et al. (2008) Koleva, M., Prugniel, P., Ocvirk, P., Le Borgne, D., & Soubiran, C. 2008, MNRAS, 385, 1998
- Koribalski et al. (2004) Koribalski, B. S., Staveley-Smith, L., Kilborn, V. A., Ryder, S. D., Kraan-Korteweg, R. C., Ryan-Weber, E. V., Ekers, R. D., Jerjen, H., Henning, P. A., Putman, M. E., Zwaan, M. A., de Blok, W. J. G., Calabretta, M. R., Disney, M. J., Minchin, R. F., Bhathal, R., Boyce, P. J., Drinkwater, M. J., Freeman, K. C., Gibson, B. K., Green, A. J., Haynes, R. F., Juraszek, S., Kesteven, M. J., Knezek, P. M., Mader, S., Marquarding, M., Meyer, M., Mould, J. R., Oosterloo, T., O’Brien, J., Price, R. M., Sadler, E. M., Schröder, A., Stewart, I. M., Stootman, F., Waugh, M., Warren, B. E., Webster, R. L., & Wright, A. E. 2004, AJ, 128, 16
- Lada & Lada (2003) Lada, C. J., & Lada, E. A. 2003, ARA&A, 41, 57
- Lee (1994) Lee, Y.-W. 1994, ApJ, 430, L113
- Lejeune et al. (1997) Lejeune, T., Cuisinier, F., & Buser, R. 1997, A&AS, 125, 229
- Lejeune et al. (1998) —. 1998, A&AS, 130, 65
- Li & Han (2007) Li, Z., & Han, Z. 2007, A&A, 471, 795
- Li & Han (2008a) —. 2008a, MNRAS, 387, 105
- Li & Han (2008b) —. 2008b, ApJ, 685, 225
- Li & Han (2008c) Li, Z., & Han, Z. 2008c, in IAU Symposium, Vol. 252, IAU Symposium, ed. L. Deng & K. L. Chan, 359–364
- Li et al. (2012a) Li, Z., Zhang, L., & Liu, J. 2012a, MNRAS, 424, 874
- Li et al. (2010) Li, Z.-M., Mao, C.-Y., Li, R.-H., Li, R.-X., & Li, M.-C. 2010, Research in Astronomy and Astrophysics, 10, 135
- Li et al. (2012b) Li, Z.-M., Mao, C.-Y., Zhang, Q., & Chen, L. 2012b, Astrophysical Journal Letters, 761, 22
- Li et al. (2006) Li, Z.-M., Zhang, F.-H., & Han, Z.-W. 2006, Chinese J. Astron. Astrophys., 6, 669
- Lu et al. (2006) Lu, H., Zhou, H., Wang, J., Wang, T., Dong, X., Zhuang, Z., & Li, C. 2006, AJ, 131, 790
- Marks & Kroupa (2011) Marks, M., & Kroupa, P. 2011, MNRAS, 417, 1702
- Marks & Kroupa (2012) —. 2012, A&A, 543, A8
- Maxted et al. (2001) Maxted, P. f. L., Heber, U., Marsh, T. R., & North, R. C. 2001, MNRAS, 326, 1391
- Mayor et al. (1992) Mayor, M., Duquennoy, A., Halbwachs, J.-L., & Mermilliod, J.-C. 1992, in Astronomical Society of the Pacific Conference Series, Vol. 32, IAU Colloq. 135: Complementary Approaches to Double and Multiple Star Research, ed. H. A. McAlister & W. I. Hartkopf, 73
- Mazeh et al. (1992) Mazeh, T., Goldberg, D., Duquennoy, A., & Mayor, M. 1992, ApJ, 401, 265
- McQuade et al. (1995) McQuade, K., Calzetti, D., & Kinney, A. L. 1995, ApJS, 97, 331
- O’Connell (1999) O’Connell, R. W. 1999, ARA&A, 37, 603
- Ocvirk et al. (2006) Ocvirk, P., Pichon, C., Lançon, A., & Thiébaut, E. 2006, MNRAS, 365, 74
- Panter et al. (2007) Panter, B., Jimenez, R., Heavens, A. F., & Charlot, S. 2007, MNRAS, 378, 1550
- Park & Lee (1997) Park, J.-H., & Lee, Y.-W. 1997, ApJ, 476, 28
- Raghavan et al. (2010) Raghavan, D., McAlister, H. A., Henry, T. J., Latham, D. W., Marcy, G. W., Mason, B. D., Gies, D. R., White, R. J., & ten Brummelaar, T. A. 2010, ApJS, 190, 1
- Reed & Stiening (2004) Reed, M. D., & Stiening, R. 2004, PASP, 116, 506
- Schlegel et al. (1998) Schlegel, D. J., Finkbeiner, D. P., & Davis, M. 1998, ApJ, 500, 525
- Thejll et al. (1995) Thejll, P., Ulla, A., & MacDonald, J. 1995, A&A, 303, 773
- Thomas et al. (2005) Thomas, D., Maraston, C., Bender, R., & Mendes de Oliveira, C. 2005, ApJ, 621, 673
- Tojeiro et al. (2007) Tojeiro, R., Heavens, A. F., Jimenez, R., & Panter, B. 2007, MNRAS, 381, 1252
- Tojeiro et al. (2009) Tojeiro, R., Wilkins, S., Heavens, A. F., Panter, B., & Jimenez, R. 2009, ApJS, 185, 1
- Tout et al. (1997) Tout, C. A., Aarseth, S. J., Pols, O. R., & Eggleton, P. P. 1997, MNRAS, 291, 732
- Tremonti et al. (2004) Tremonti, C. A., Heckman, T. M., Kauffmann, G., Brinchmann, J., Charlot, S., White, S. D. M., Seibert, M., Peng, E. W., Schlegel, D. J., Uomoto, A., Fukugita, M., & Brinkmann, J. 2004, ApJ, 613, 898
- Tully et al. (2008) Tully, R. B., Shaya, E. J., Karachentsev, I. D., Courtois, H. M., Kocevski, D. D., Rizzi, L., & Peel, A. 2008, ApJ, 676, 184
- Ulla & Thejll (1998) Ulla, A., & Thejll, P. 1998, A&AS, 132, 1
- Walcher et al. (2006) Walcher, C. J., Böker, T., Charlot, S., Ho, L. C., Rix, H.-W., Rossa, J., Shields, J. C., & van der Marel, R. P. 2006, ApJ, 649, 692
- Walcher et al. (2011) Walcher, J., Groves, B., Budavári, T., & Dale, D. 2011, Ap&SS, 331, 1
- Wegner et al. (2003) Wegner, G., Bernardi, M., Willmer, C. N. A., da Costa, L. N., Alonso, M. V., Pellegrini, P. S., Maia, M. A. G., Chaves, O. L., & Rité, C. 2003, AJ, 126, 2268
- Westera et al. (2002) Westera, P., Lejeune, T., Buser, R., Cuisinier, F., & Bruzual, G. 2002, A&A, 381, 524
- Williams et al. (2001) Williams, T., McGraw, J. T., Mason, P. A., & Grashuis, R. 2001, PASP, 113, 944
- Yi et al. (1997) Yi, S., Demarque, P., & Kim, Y.-C. 1997, ApJ, 482, 677
- Yi et al. (2005) Yi, S. K., Yoon, S.-J., Kaviraj, S., Deharveng, J.-M., Rich, R. M., Salim, S., Boselli, A., Lee, Y.-W., Ree, C. H., Sohn, Y.-J., Rey, S.-C., Lee, J.-W., Rhee, J., Bianchi, L., Byun, Y.-I., Donas, J., Friedman, P. G., Heckman, T. M., Jelinsky, P., Madore, B. F., Malina, R., Martin, D. C., Milliard, B., Morrissey, P., Neff, S., Schiminovich, D., Siegmund, O., Small, T., Szalay, A. S., Jee, M. J., Kim, S.-W., Barlow, T., Forster, K., Welsh, B., & Wyder, T. K. 2005, ApJ, 619, L111