Charged-particle pseudorapidity density and anisotropic flow over a wide pseudorapidity range using ALICE at the LHC
Abstract
The pseudorapidity density and anisotropic flow of charged-particles provide fundamental information about global variables and correlations in heavy-ion collisions. The pseudorapidity density is related to the energy available for particle production while the anisotropic flow is related to collective effects from interactions between these particles. Extending these measurements to very forward pseudorapidities yields information about the longitudinal expansion of the system. The first measurements performed at the LHC over more than 8 units of pseudorapidity are presented. The longitudinal scaling of the measurements is analyzed and comparison to models is performed.
Introduction
The goal of colliding heavy-ions is to understand the strong interaction in the hot dense state known as the Quark–Gluon Plasma (QGP). One of the most fundamental characteristics of these collisions is the energy available for particle production, which can be assessed by measuring the charged-particle pseudorapidity density, . Further insights can be gained by investigating quantities which probe the collective behavior of the produced particles. Anisotropic flow [1] is one signature of this collectivity arising from multiple interactions between particles which transfers the initial spatial anisotropy of the collision into a momentum anisotropy of the produced particles. It is quantified as the measurement of the flow harmonics, , of the particle distribution [2]. Extending the measurements to forward pseudorapidity allows for an assessment of the physics in the fragmentation region and clarifies the role of fluctuations in the initial energy in the anisotropic flow measurement.
Detector and data analysis
The measurements are carried out using the ALICE detector [3] at CERN. Three main sub-detectors, each with full () azimuthal coverage, are utilized in these measurements. At mid-rapidity, the Silicon Pixel Detector (SPD) [3] is used. This detector has 2 cylindrical layers of silicon at radii of 3.9 and 7.6 cm from the beampipe with pseudorapidity coverages of and , respectively. With almost 10 million total channels, the SPD provides excellent spatial resolution in both and for registering particles produced in the collision. The detector’s close proximity to the beampipe reduces the number of detected secondary particles.
At forward rapidities the Forward Multiplicity Detector (FMD) [4] and the VZERO [5] are used. The FMD is divided into three sections at different positions along the beam axis with each section made of one or two rings of silicon strip sensors. Each ring has 10240 silicon strips with high resolution and 20 or 40 azimuthal sectors for resolving . The nominal acceptance of the FMD is and . The VZERO has a nominal acceptance of and . This detector is composed of scintillator counters whose signal is proportional to the number of particles incident upon the detector. The detector has 4 radial segments for resolution and 8 azimuthal segments for resolution.
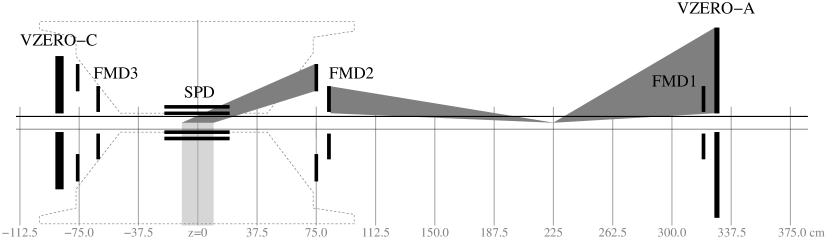
Figure 1 shows a schematic cross-section of these detectors and the trajectories which particles would follow from different interaction vertices. From the nominal vertex at , few secondary particles are detected in the SPD, but for FMD2, FMD3, and VZERO-C many secondary particles produced in support material are detected. This effect requires a very accurate material description and a correction dependent on simulations. An alternate method was, therefore, developed to measure where only FMD2, FMD1, and VZERO-A were used to extend the mid-rapidity measurement of from the SPD. ‘Satellite’ vertices spaced in intervals of 37.5 cm from created via beam debunching during injection and acceleration [6] were used to avoid large corrections due to secondary particle production and also to extend the coverage for the measurement to . The collision rate with displaced vertices is about 1000 times smaller than at the nominal vertex position which does not allow for a precision measurement of with this method.
Pseudorapidity density
Figure 2 shows the result of the analysis using the SPD with nominal vertex collisions for the region of and the FMD and VZERO detectors with ‘satellite’ vertex collisions. The results are compared to three models. The AMPT model [7] tuned to the measured mid-rapidity [8] fails to reproduce the shape of the distribution. UrQMD [9] predicts the shape in the region of in the two most central bins, but does not properly describe the distribution at forward . The CGC based model [10, 11] reproduces the shape within the limited pseudorapidity range of the prediction, .
|
|
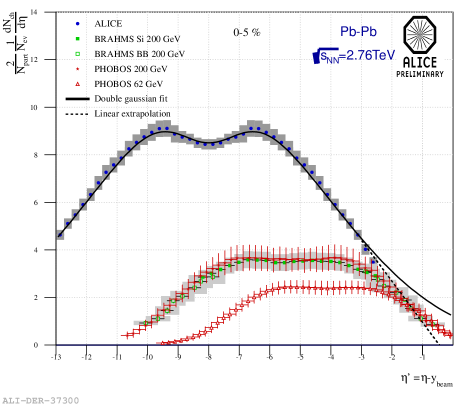
Figure 2 shows the distribution of per participant pair as a function of . The most central ALICE data are compared to lower energy data from RHIC [12, 13]. Near beam rapidity the lower energy distributions overlap, suggesting the validity of longitudinal scaling in the fragmentation region [14, 15]. The ALICE acceptance does not extend far enough to show an overlap with the lower energy data, but extrapolations are consistent with the preservation of longitudinal scaling in the fragmentation region.
Anisotropic flow
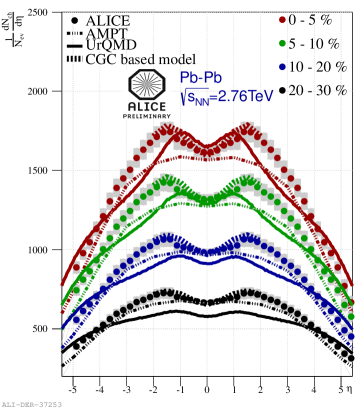
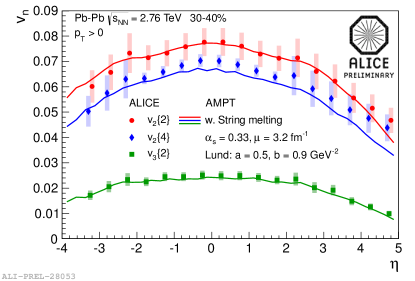
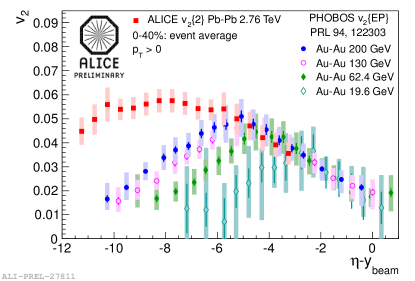
The data were analyzed using the cumulant method [16] to extract the values of the flow harmonics, . Different multiparticle correlators were used to understand the effect of flow fluctuations. The analysis was carried out using only collisions occurring around the nominal vertex region ( cm). The inner layer of the SPD was used for the measurement in the range and the FMD (all three sections) extended this measurement to the range . Figure 3 shows the result of the analysis. The large value of is due to the harmonic’s sensitivity to the large anisotropy in the initial geometrical shape present in the 30–40% most central collisions. The smaller value of is attributed to the harmonic’s dominant sensitivity to fluctuations in the initial geometrical shape. The essentially constant difference between and implies that the effect of flow fluctuations is similar at mid-rapidity and forward rapidity. The data are compared to the tuned AMPT model [8]. With this tuning, the model reproduces the shape of measured flow harmonics as a function of .
Summary
The charged-particle pseudorapidity density, elliptic flow (), and triangular flow () have been measured over more than 8 units of pseudorapidity. The available models do not predict the full shape. A large value of is seen for mid-central collisions (30-40%), consistent with the anisotropy of the initial geometrical shape of the collision, while is smaller, consistent with its sensitivity to fluctuations in the shape. The contribution of flow fluctuations to the flow signal appears to be similar over a wide range of pseudorapidity. The measured and elliptic flow appear to exhibit longitudinal scaling in the fragmentation region up to TeV.
References
References
- [1] Ollitrault J Y 1992 Phys. Rev. D 46(1) 229–245
- [2] Voloshin S and Zhang Y 1996 Z.Phys. C70 665–672 (Preprint hep-ph/9407282)
- [3] Aamodt K et al. (ALICE Collaboration) 2008 Journal of Instrumentation 3 S08002
- [4] Christensen C H et al. (ALICE Collaboration) 2007 Int.J.Mod.Phys. E16 2432–2437 (Preprint 0712.1117)
- [5] Cortese P et al. (ALICE Collaboration) 2004 CERN-LHCC-2004-025
- [6] Jeff A et al. 2012 CERN-ATS-2012-088
- [7] Lin Z W, Ko C M, Li B A, Zhang B and Pal S 2005 Phys. Rev. C 72(6) 064901
- [8] Xu J and Ko C M 2011 Phys. Rev. C 83(3) 034904
- [9] Mitrovski M, Schuster T, Graf G, Petersen H and Bleicher M 2009 Phys.Rev. C79 044901 (Preprint 0812.2041)
- [10] Albacete J L and Dumitru A 2010 (Preprint 1011.5161)
- [11] Albacete J L, Dumitru A and Nara Y 2011 J.Phys.Conf.Ser. 316 012011 (Preprint 1106.0978)
- [12] Alver B et al. (PHOBOS Collaboration) 2011 Phys. Rev. C 83(2) 024913
- [13] Bearden I G et al. (BRAHMS Collaboration) 2002 Phys. Rev. Lett. 88(20) 202301
- [14] Benecke J, Chou T T, Yang C N and Yen E 1969 Phys. Rev. 188(5) 2159–2169
- [15] Back B B et al. (PHOBOS Collaboration) 2003 Phys. Rev. Lett. 91(5) 052303
- [16] Bilandzic A, Snellings R and Voloshin S 2011 Phys.Rev. C83 044913 (Preprint 1010.0233)
- [17] Back B et al. (PHOBOS Collaboration) 2005 Phys.Rev.Lett. 94 122303 (Preprint nucl-ex/0406021)