PAH emission in the proplyd HST10: what is the mechanism behind photoevaporation?
Abstract
Proplyds are photodissociation region (PDR)-like cometary cocoons around young stars which are thought to originate through photo-evaporation of the central protoplanetary disk by external UV radiation from the nearby OB stars. This letter presents spatially resolved mid-infrared imaging and spectroscopy of the proplyd HST10 obtained with the VLT/VISIR instrument. These observations allow us to detect Polycyclic Aromatic Hydrocarbons (PAH) emission in the proplyd photodissociation region and to study the general properties of PAHs in proplyds for the first time. We find that PAHs in HST10 are mostly neutral and at least 50 times less abundant than typical values found for the diffuse ISM or the nearby Orion Bar. With such a low PAH abundance, photoelectric heating is significantly reduced. If this low abundance pertains also to the original disk material, gas heating rates could be too low to efficiently drive photoevaporation unless other processes can be identified. Alternatively, the model behind the formation of proplyds as evaporating disks may have to be revised.
Subject headings:
circumstellar matter — ISM: lines and bands — protoplanetary disks — stars: individual (HST10) — stars: winds, outflows1. Introduction
Most low mass stars are born in transient OB associations (e.g., Lada & Lada 2003), and there is evidence that our own young Solar System evolved near massive stars (e.g., Hester et al. 2004). Externally illuminated protoplanetary disks or proplyds (O’Dell et al. 1993) are young stellar objects (YSOs) surrounded by Solar System-sized protoplanetary disks and found embedded within or near a H ii region. In these extreme environments the disks are exposed to intense UV radiation fields and stellar winds from the OB stars, dynamical encounters with sibling stars and supernovae, on timescales of planetary system formation and early evolution. Hence, the study of their properties may bring key constraints on the understanding of the general mechanism of planet formation and the origins of our Solar System.
Proplyd morphology has been explained by models of evaporating flows in externally illuminated disks or globules (e.g., Henney et al. 1996; Sutherland 1997; Johnstone et al. 1998; Henney & Arthur 1998; Störzer & Hollenbach 1998, 1999; Richling & Yorke 1998, 2000; Vasconcelos et al. 2011) as a FUV (6 eV E 13.6 eV) heated photodissociation region (PDR) encased within a EUV (E 13.6 eV) ionized hydrogen cocoon with a “head-tail” shape. FUV photons of nearby OB stars penetrate deep into the disk and, at relative high column densities, dissociate hydrogen molecules, ionize carbon, and heat the gas to T400-4000 K, forming the PDR. The resulting thermal pressure drives an expanding hydrodynamical flow of neutral material escaping from the disk surface with velocities of 1-3 kms-1. The mass-loss rate generated by this photo-evaporation wind determines the lifetime of the gaseous disk and hence the timescale for the formation of giant planets. At some distance from the disk, the EUV photons ionize the neutral wind and form an ionization front (IF) with T104 K. The observed tails result from the diffuse UV radiation field (produced through the recombination of surrounding nebular gas) which drives an evaporation flow on the shadowed side of the disk. These models consider the FUV photoelectric effect on small dust grains and Polycyclic Aromatic Hydrocarbons (PAHs, Joblin & Tielens 2011) as the main gas-heating mechanism at the disk surface. Recent observations (Okada et al., submitted) show that PAHs play a major role in the heating process, and theoretical studies (Kamp & Dullemond 2004) confirm this also for protoplanetary disks. The proplyd models mentioned above are adapted from classical PDR models (see Hollenbach & Tielens 1997 for a review) which consider standard interstellar medium (ISM) PAH abundances. However, up to now, there is no observational abundance determination for proplyds.
HST10 (182-413; O’Dell & Wen 1994) is a teardrop-shaped proplyd (12 26) containing a prominent nearly edge-on disk (i80∘, PA86∘) visible as a dark silhouette in H, optical ionized species and the continuum, but glowing in [OI] 6300 and in the 2.12 m ro-vibrational line of H2 (Bally et al. 2000; Chen et al. 1998, Vicente et al., in prep.) This object is located at a projected distance of 56” from Ori C to the SE, the main ionizing star of the Trapezium Cluster (4147 pc, Menten et al. 2007). In this letter we present spatially resolved VLT/VISIR observations of PAH emission in HST10. We determine the PAH abundance in the neutral flow and discuss the implications for photo-evaporation models.
2. Observations and data reduction
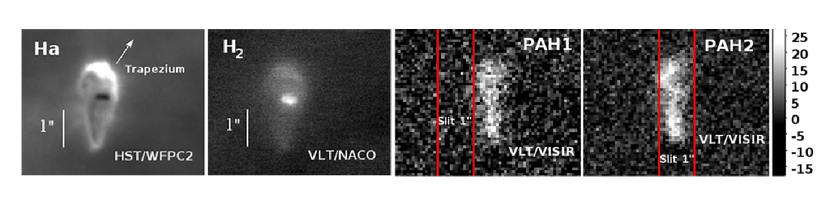
Mid-IR imaging (75 mas/pix) and low-resolution spectroscopy (R200-350, 127 mas/pix) of the proplyd HST10 were obtained on the 13th December 2005 with VISIR (Lagage et al. 2004), under good ambient conditions (seeing at 0.5 m between 06 and 1′′). A spectro-photometric standard (HD 35536) of similar airmass was observed immediately before and after the science target to allow for telluric absorption correction and calibration. The data were reduced with a VISIR customary pipeline based on IDL scripts (Pantin et al. 2005) and corrected for the background using a multi-resolution inpainting scheme (Pantin 2010). The images were collected with filters PAH1 (8.590.21 m), SIV (10.490.08 m), and PAH2 (11.250.3 m) for a total exposure time (on source) of 30min and using the parallel chopping/nodding jitter mode with a chopping throw of 7′′. The spatial resolution of the final images (), measured in the only point source in the field, was 035 for PAH1 and 034 for PAH2, the latter being diffraction limited and reflecting the improvement in the seeing111The diffraction limit at the VLT (8.2m) varies from 026 to 034 in the range 8.6 – 11.25m. As the size of a UT mirror is comparable to the turbulence outer scale, VISIR data are already diffraction limited for optical seeing below 06.. HST10 is spatially resolved in the PAH1 and PAH2 images (097 25), but not detected in SIV after nebular subtraction. No central star inside the disk is visible in any of the VISIR images (Fig. 1).
The -band spectroscopy consisted of three settings centered at 8.5, 9.8 and 11.4 m (1h integration time) chosen for covering the 10m silicate feature and PAH emission bands at 8.6 and 11.25 m. The 1′′ slit was placed along the proplyd head-tail, in the NS orientation, and the chop/nod was performed along the slit with a throw of 8′′. The 1D-spectra were extracted by integrating the flux for each wavelength over the spatial extension of the proplyd (17-19 pix) in the 2D background subtracted spectra. They show spatially resolved PAH emission at 11.25 m (Fig. 2) but no detection above the noise level at 8.6 m. The slit position, estimated using the RA and DEC values from the headers, is overlaid on top of the VISIR images in Fig. 1 and have an uncertainty of 02-03, corresponding to the accuracy of (small) relative offsets with the VLT. The RA offset of the slit at 8.6m, relative to the proplyd nominal position in O’Dell & Wen (1994), is 06-08 to the east which leaves the proplyd out of the slit. We believe this was due to errors occurring during the blind offsetting performed to obtain the HST10 spectra. For the 11.4 m setting the proplyd falls almost entirely inside the slit (see Fig. 1).
The H2 2.12 m image (27 mas/pix) was collected with the VLT adaptive optics instrument NACO under program ID 076.C-0874 (PI, S. Vicente). This data is described and analyzed in a forthcoming paper (Vicente et al., in prep.). The H 0.656m image (45.6 mas/pix) from the Hubble Space Telescope instrument WFPC2 was retrieved from the ESO archive (program GO 6603, J. Bally). The optical and near-IR images were rebinned to the same pixel size of the VISIR images and aligned with sub-pixel precision (0.01 pix) with IMALIGN/IRAF. The NACO image was used as reference because it contained several point sources in the field, contrary to the VISIR and HST images for which only one to two stars could be found. Although there is a perfect overlap of the centroids of the stars in the RGB image, the estimated error in the alignment is 1pix (or 75 mas) from comparison of the position of the silhouette disk seen in the H image to the H2 disk emission seen in the NACO image (Fig. 3). This error results from the different Point Spread Functions (PSFs) observed at the different wavelengths (006 for H, 008 for H2, and 035 for PAHs).
3. Observational results
Fig. 1 shows the optical, near-IR and mid-IR images of HST10 tracing the different key elements of its morphology. The optical H image traces the ionized gas at the ionization front with its peak surface brightness facing the Trapezium stars. This is a clear evidence that Ori C is the main source of UV radiation driving the photo-ionization and evaporation in HST10. The H2 2.12 m emission traces the molecular gas at the disk surface. This was first discovered in a HST/NICMOS image (Chen et al. 1998) and more recently confirmed with adaptive optics ground-based imaging (Vicente et al., in prep.). The VISIR mid-IR images reported here show emission associated to the proplyd in both filters PAH1 (8.6 m) and PAH2 (11.25 m). The latter detection is also confirmed with spectroscopic observations (Fig. 2) and can be attributed to (solo) C-H out-of-plane bending mode in PAH molecules with long straight edges. No continuum is observed below 11m, but beyond 11.3 m we see in Fig. 2 the 11-14 m PAH plateau resulting from the blend of C-H out-of-plane bending modes (e.g. arising from PAH clusters). On the basis of the similarity of the morphologies in the PAH1 and PAH2 images, and since the PAH1 filter is also situated on top of a C-H vibration (in-plane bending mode), we conclude the PAH1 emission is also due to PAHs. The total density flux integrated over the full proplyd extension (rectangular aperture of pix) in the PAH1 image is 26.60.5 mJy (3) when considering only the photon noise. Given that the uncertainty in the conversion factor used for calibrating the images is typically 10%, we obtain 26.62.6 mJy. The integrated flux of the 11.25 m feature in the spectrum, divided by the passband of the PAH2 imaging filter (10.9511.55 m), is 29.412.9 mJy (1) which is consistent, within the error, with the extracted photometry in the PAH2 image, 38.83.8 mJy. The smaller value obtained from the spectrum with respect to imaging is likely due to slit losses which were worsen by pointing inaccuracies from the blind offsetting. The 11.25 m emission observed in the 2D-spectrum in Fig. 2 is extended over 17-19 pixels or 22-24 (127 mas/pix), similar to the head-to-tail size of HST10 in the PAH images, and is about 50 mJy at the peak position. The maximum surface brightness in the PAH1 and PAH2 filters ( and ) were derived by taking the average of the four brightest pixels at the proplyd head in each VISIR image. These values are given in Table 1.
4. Properties of PAHs in HST10
4.1. Spatial distribution and ionization
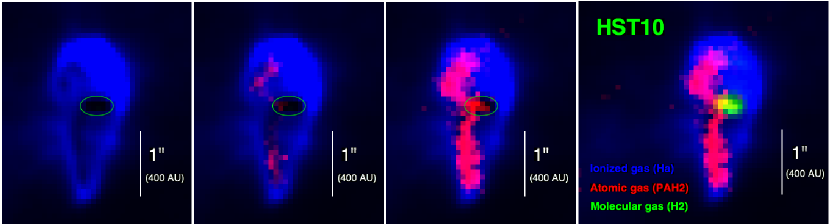
In PDRs, PAHs emit mostly in the neutral gas where the majority of molecules are dissociated by FUV photons (e.g. in the nearby Orion Bar, Tielens et al. 1994). Hence, PAHs are a tracer of the atomic gas (for instance in the NGC 7023 nebula they follow the far infrared emission of C+, Joblin et al. 2010), and in the particular case of proplyds, PAHs will trace the morphology of the photo-evaporating flow. This is well illustrated in Fig. 3 showing the ionized (H), neutral (PAHs) and molecular (H2) gas components of the proplyd HST10. The PAH emission is localized within the ionized envelope and at the disk surface from where, according to PDR models, the FUV-heated material evaporates generating the neutral wind and creating the proplyd PDR. Additionally, even thought the PAH1 and PAH2 emission show similar head-to-tail extent, their distribution is different. PAH1 emission at 8.6 m is fainter ( in surface brightness) and more homogeneously distributed within the cocoon, whereas the PAH2 emission at 11.25 m is sharper and brighter on the opposite side to the direction of Ori C, and coincident with the areas showing less emission or more heavily extincted in the optical H image (Fig. 3). Considering that most of the optical extinction is caused by 0.1m dust grains, and these are expected to be depleted in the neutral flow (with , Henney & O’Dell 1999) due to grain growth and settling in the protoplanetary disk, the 11.25 m emission is tracing the regions of higher density in atomic gas and possibly very small particles of dust. Additionally, while the 11.25 m feature is dominant for neutral PAH molecules, the 8.6 m feature is stronger for ionized PAHs mostly present in high UV irradiated regions (Joblin & Tielens 2011, and references there in). Hence, the difference in spatial distribution observed in the two filters may reflect a charge effect associated to the proplyd location in the foreground of the nebula, that is, in between Ori C and the observer. Positively ionized PAHs are expected to be more abundant on the irradiated side of the proplyd opposite to us, whereas the bulk of the PAHs reservoir, as seen in the proplyd “shadowed” side, seem to be in the form of neutral molecules. The band ratio, at the position where we extracted brightnesses in HST10, is of the order of 0.5, in accordance to the astronomical template of Pilleri et al. (2012) for which a value around 0.4 is found for neutral PAHs and 1.45 for PAH+. For high radiation fields, PAHs can be neutral if the density of the gas in the flow is high ( cm-3, Tielens 2005), allowing for efficient recombination of PAH cations with slow electrons. As we will see, this is most likely the case (Sect. 4.2). Finally, we note that there is no PAH emission beyond the ionization front, suggesting that they are largely destroyed beyond this point as seen in the Orion Bar (Giard et al. 1994).
| Parameter | Reference | |
| NGC 7023 | ||
| 1306 5 MJy sr-1 | this paper | |
| 2723 6 MJy sr-1 | this paper | |
| Joblin et al. 2010 | ||
| NH | cm-2 | Joblin et al. 2010 |
| Berné & Tielens 2012 | ||
| HST 10 | ||
| 720 111 MJy sr-1 | this paper | |
| 1466 111 MJy sr-1 | this paper | |
| 0.5 | this paper | |
| Störzer & Hollenbach 1999 | ||
| NH | cm-2 | Störzer & Hollenbach 1999 |
| this paper | ||
4.2. PAH abundance
Proplyd models consider disk photoevaporation to be due mainly to efficient heating of the gas by energetic photo-electrons provided by small grains and PAH molecules. However, these models assume PAHs in proplyds are as abundant as in the interstellar medium (ISM), an assumption which has not yet been verified with observations. PAHs have been detected in, at most, 15% of the observed disks around isolated TTauri stars and they are under-abundant by a factor of 25 when compared to the ISM (Geers et al. 2007; Oliveira et al. 2010). The VISIR images of HST10 presented in this paper can be used to estimate the abundance of PAHs in a proplyd PDR for the first time.
The mid-IR PAH emission at a given wavelength is proportional to the number of carbon atoms locked in PAHs in the line of sight (e.g. Joblin et al. 2010), and on the intensity of the UV radiation field, 222expressed in terms of the Habing field which corresponds to an integrated intensity between 91.2 and 240nm of ergs cm-2 s-1 (Habing 1968).. Hence, we can write
| (1) |
where is the fraction of elemental carbon locked in PAHs, is the column density of hydrogen atoms in the line of sight, is the abundance of carbon relative to hydrogen atoms (), and is the PAH emissivity at the given wavelength. The latter parameter, can be derived for sources where all the other parameters given in Eq. 1 can be determined independently as in the case of the reflection nebula NGC 7023. The values adopted for , and were taken from the literature (Table 1) while the intensities and for NGC 7023 were measured directly in the Spitzer IRS spectrum (Pilleri et al. 2012). This yields for the PAH emissivities and MJy sr-1cm which, when inserted in Eq. 1 combined with the parameters in Table 1, give the PAH abundance in the PDR of HST10, , if a good estimate of the column density of atomic gas in the line of sight is provided. This parameter can be estimated from the electron density at the ionization front which can be measured with a fair accuracy. Bally et al. (1998) obtain a value of cm-3 from the H surface brightness, while Störzer & Hollenbach (1999) find cm-3, when correcting for the extinction to the Orion Nebula. Assuming pressure equilibrium at the ionization front, the density of H atoms in the neutral flow , must be of the order of or cm-3. For a head width of cm, measured in the PAH2 image, and assuming this value for the neutral flow lenght along the line of sight (symmetry in HST10), we obtain cm-2. From models and using the same parameters, Störzer & Hollenbach (1999) find cm-2. Adopting their value for , and using the brightnesses and (Table 1) measured in the VISIR PAH1 and PAH2 images, we find similar PAH abundances in HST10 of and . These values are nevertheless extremely low: they correspond to an abundance of PAHs 90 times lower than in NGC 7023 (Berné & Tielens 2012), or about 50 times less than the values found in the Orion Bar or in the diffuse ISM (Tielens 2005). And, since the brightnesses have been measured for the brightest pixels at the proplyd head (Sect. 3), our estimation gives the maximum abundance of PAHs in the evaporating flow toward Ori C.
5. Discussion
As other studies of TTauri stars (Geers et al. 2007; Oliveira et al. 2010) we find PAHs to be under-abundant in the PDR of the proplyd HST10, by a factor of 50 or more relative to the diffuse ISM. The origin of this under-abundance cannot be readily explained, but some proposed hypotheses include clustering of PAHs followed by sedimentation inside the disk, destruction by FUV photons in the PDR, or destruction by X-rays emitted by the low-mass central star333The majority of stars in the Orion Nebula cluster are in the mass range of M⊙ (Hillenbrand & Hartmann 1998). Nevertheless, more important than the causes for PAH under-abundance are the implications this result has on our understanding of the physical processes shaping morphology and driving mass-loss in proplyds. Photo-evaporation of proplyds has been explained so far by the photo-electric heating of the gas which is known to have a much reduced photo-electric efficiency for grains larger than 100 (Tielens 2005). Given the high column density cm-2 and low extinction in the PDR of HST10, we expect these large grains to be depleted in the neutral flow. In fact, the photoelectric heating has it highest efficiency for PAHs (molecules of a few Å) and the small end of the very small grains (up to a few tens of Å). But according to Pilleri et al. (2012) (Fig. 6 in their paper), for high radiation fields as those found in proplyds (), the very small grains are destroyed and evaporated into free-flying PAHs. Therefore, we do expect PAHs to be the main agents of the photo-electric heating in proplyds.
Assuming the disk surface has the same PAH abundance as the proplyd PDR (they are lifted from the disk surface by the evaporative wind), the low fraction of PAHs found in this letter will have a profound impact on the disk surface gas temperature. And hence, the current hypothesis of an evaporating disk creating the proplyd PDR and morphology may have to be revised. Two possibilities arise: 1) other gas heating mechanisms are relevant for disk evaporation, such as collisional de-excitation of UV pumped H2 and H2 photo-dissociation followed by reformation on grain surfaces; 2) the PAH emission from the proplyd cocoon is associated to remnant atomic gas from the protostellar envelope or the surrounding nebula. By combining detailed modeling with upcoming Herschel (Berné et al., in prep.) and VLT data (Vicente et al., in prep.), the heating-cooling mechanisms at the disk surface can be assessed allowing to test each one of the possible scenarios creating the puzzling proplyd morphology.
References
- Bally et al. (1998) Bally, J., Sutherland, R. S., Devine, D., & Johnstone, D. 1998, AJ, 116, 293
- Bally et al. (2000) Bally, J., O’Dell, C. R., & McCaughrean, M. J. 2000, AJ, 119, 2919
- Berné & Tielens (2012) Berné, O., & Tielens, A. G. G. M. 2012, Proceedings of the National Academy of Science, 109, 401
- Chen et al. (1998) Chen, H., Bally, J., O’Dell, C. R., et al. 1998, ApJ, 492, L173
- Geers et al. (2007) Geers, V. C., van Dishoeck, E. F., Visser, R., et al. 2007, A&A, 476, 279
- Giard et al. (1994) Giard, M., Bernard, J. P., Lacombe, F., Normand, P., & Rouan, D. 1994, A&A, 291, 239
- Habing (1968) Habing, H. J. 1968, Bull. Astron. Inst. Netherlands, 19, 421
- Henney et al. (1996) Henney, W. J., Raga, A. C., Lizano, S., & Curiel, S. 1996, ApJ, 465, 216
- Henney & Arthur (1998) Henney, W. J., & Arthur, S. J. 1998, AJ, 116, 322
- Henney & O’Dell (1999) Henney, W. J., & O’Dell, C. R. 1999, AJ, 118, 2350
- Hester et al. (2004) Hester, J. J., Desch, S. J., Healy, K. R., & Leshin, L. A. 2004, Science, 304, 1116
- Hillenbrand & Hartmann (1998) Hillenbrand, L. A., & Hartmann, L. W. 1998, ApJ, 492, 540
- Hollenbach & Tielens (1997) Hollenbach, D. J., & Tielens, A. G. G. M. 1997, ARA&A, 35, 179
- Joblin et al. (2010) Joblin, C., Pilleri, P., Montillaud, J., et al. 2010, A&A, 521, L25
- Joblin & Tielens (2011) Joblin, C., & Tielens, A. G. G. M. 2011, EAS Publications Series, 46,
- Johnstone et al. (1998) Johnstone, D., Hollenbach, D., & Bally, J. 1998, ApJ, 499, 758
- Kamp & Dullemond (2004) Kamp, I., & Dullemond, C. P. 2004, ApJ, 615, 991
- Lada & Lada (2003) Lada, C. J., & Lada, E. A. 2003, ARA&A, 41, 57
- Lada et al. (2004) Lada, C. J., Muench, A. A., Lada, E. A., & Alves, J. F. 2004, AJ, 128, 1254
- Lagage et al. (2004) Lagage, P. O., Pel, J. W., Authier, M., et al. 2004, The Messenger, 117, 12
- Menten et al. (2007) Menten, K. M., Reid, M. J., Forbrich, J., & Brunthaler, A. 2007, A&A, 474, 515
- O’Dell et al. (1993) O’Dell, C. R., Wen, Z., & Hu, X. 1993, ApJ, 410, 696
- O’Dell & Wen (1994) O’Dell, C. R., & Wen, Z. 1994, ApJ, 436, 194
- Oliveira et al. (2010) Oliveira, I., Pontoppidan, K. M., Merín, B., et al. 2010, ApJ, 714, 778
- Pantin et al. (2005) Pantin, E., Lagage, O.-P., Claret, A., et al. 2005, The Messenger, 119, 25
- Pantin (2010) Pantin, E. 2010, Ph.D. Thesis, Infrared Observations of Circumstellar Disks and Exoplanets, Université de Paris Diderot, 2010
- Pilleri et al. (2012) Pilleri, P., Montillaud, J., Berné, O., & Joblin, C. 2012, A&A, 542, A69
- Richling & Yorke (1998) Richling, S., & Yorke, H. W. 1998, A&A, 340, 508
- Richling & Yorke (2000) Richling, S., & Yorke, H. W. 2000, ApJ, 539, 258
- Störzer & Hollenbach (1998) Störzer, H., & Hollenbach, D. 1998, ApJ, 495, 853
- Störzer & Hollenbach (1999) Störzer, H., & Hollenbach, D. 1999, ApJ, 515, 669
- Sutherland (1997) Sutherland, R. S. 1997, IAU Colloq. 163: Accretion Phenomena and Related Outflows, 121, 566
- Tielens et al. (1994) Tielens, A. G. G. M., McKee, C. F., Seab, C. G., & Hollenbach, D. J. 1994, ApJ, 431, 321
- Tielens (2005) Tielens, A. G. G. M. 2005, The Physics and Chemistry of the Interstellar Medium, by A. G. G. M. Tielens, pp. . ISBN 0521826349. Cambridge, UK: Cambridge University Press, 2005
- Vasconcelos et al. (2011) Vasconcelos, M. J., Cerqueira, A. H., & Raga, A. C. 2011, A&A, 527, A86