Study of ram pressure effects on NGC 2805 in Holmberg 124–LABEL:lastpage
Study of ram pressure effects on NGC 2805 in Holmberg 124
Abstract
In this paper we present new Hi 21cm spectral line images of the poor group of late type galaxies, Holmberg 124 made using archival data from the Giant Metrewave Radio Telescope (GMRT). Holmberg 124 is a group of four late type galaxies: NGC 2805, NGC 2814, NGC 2820 and Mrk 108. We detect spectral line emission from all the four galaxies and note several signatures of tidal interactions among the member galaxies. Our results for the triplet (namely NGC 2820, NGC 2814 and Mrk 108) confirm the earlier results of Kantharia et al. (2005) notably the detection of a possible tidal dwarf galaxy to the north-east of NGC 2820. Further, in these images where the pointing center of the observations was changed, we have recovered most of the Hi emission in NGC 2805 as compared to Kantharia et al. (2005). We also report possible detection of small discrete clouds between NGC 2820 and NGC 2805 which might be stripped Hi in the intragroup medium (IGrM). However, these need confirmation. The Hi distribution of NGC 2805 is asymmetric with peak Hi column densities seen along the southern spiral arm and along a northern arc. Diffuse Hi is seen from the entire optical galaxy and extends much further in the southern parts, especially in the south-west. An abrupt fall in Hi column densities is observed to the south of NGC 2820 which is a high inclination galaxy and to the north of NGC 2805 which is a low inclination galaxy. Vigorous star formation has been observed along the southern spiral arm of NGC 2805. Based on these new Hi images, we support the scenario given by Kantharia et al. (2005) that both tidal interactions and ram pressure are currently playing a role in the evolution of the triplet galaxies. From the observed northern Hi arc and extensive star formation in the southern spiral arm of NGC 2805 and additionally the systemic velocities of the four galaxies, we suggest ram pressure effects are also playing a role in the evolution of NGC 2805. We believe that the Hi in the north of NGC 2805 is being compressed as it moves in the IGrM and that it is moving along a direction in the north-east close to the line-of-sight so that the entire disk is encountering the IGrM. This interaction with the IGrM would have triggered star formation in the southern spiral arm. This model for NGC 2805 succeeds in explaining the compressed Hi in the north, widespread star formation and the diffuse Hi detected in the south/south-west of the optical galaxy. Deep X-ray observations of the IGrM and deeper Hi observations sensitive to larger angular scales will be very useful in furthering the understanding of this interesting group of galaxies.
keywords:
galaxies: interactions – galaxies: individual: NGC 2805 – galaxies: kinematics and dynamics – radio lines: galaxies – radio continuum: galaxies1 Introduction
Environment plays an important role in the evolution of galaxies. Tidal interactions (Toomre & Toomre, 1972), galaxy harassment (Moore et al., 1996), removal of gas via ram pressure stripping (Gunn & Gott, 1972), viscous stripping (Nulsen, 1982) and major & minor mergers (Toomre, 1977) play a key role in galaxy evolution and modify their characteristics, like morphology, kinematics and star formation rates(SFR). While the importance of the various physical mechanisms in determining the evolution of the member galaxies is well understood in cluster environments; we are still understanding the importance of the various processes in groups of galaxies. For example, in cluster environments, it is known that ram pressure stripping is the main mechanism for stripping the galaxies of their gas near the cluster center and that harassment plays an important role in stripping the galaxies of gas mass near the outskirts and intermediate distances from the cluster center. However, while tidal interactions are believed to play a major role in group environs due to the lower relative velocities and lower IGrM densities - it is not clear if this is the only major process active in group environs.
One major reason for the need to look for additional physical processes which are active in group environs is the presence of morphological signatures which have traditionally been attributed to ram pressure stripping if the galaxy was located in cluster environs. For example, in the galaxies which are found embedded inside cluster environs an abrupt drop in Hi column density giving rise to a smooth edge or Hi depletion are believed to be caused by their motion in the medium. However, when tidal interaction is invoked to explain similar signatures observed in group members, there are difficulties in explaining all the observed features. However since such observed cases are small in number, we still have much to learn about these systems (Verdes-Montenegro et al. 2001; Kantharia et al. 2005; Chung et al. 2007; Sengupta et al. 2007; Rasmussen et al. 2012). Several simulations of such systems for a range of physical parameters have shown ram pressure to lead to observable signatures on the galaxies (Vollmer et al. 2001; Roediger & Bruggen 2006). A study of this aspect for the poor group of late type galaxies, Holmberg 124, has been carried out by Kantharia et al. (2005) and in the present investigation we extend it further.
Holmberg 124 consists of four late type galaxies - NGC 2820, NGC 2805, NGC 2814 and Mrk 108 and has been subject of extensive study to name a few; radio continuum observations (van der Hulst et al. 1985; Kantharia et al. 2005) Hi observations (Reakes 1979; Bosma et al. 1980; Kantharia et al. 2005) and photometric observations (Bosma et al. 1980; Artamonov 1994). All the galaxies show several morphological and/ or other signatures attributable to tidal interactions. Besides, they show additional signatures which demand an alternative explanation such as ram pressure stripping (Kantharia et al., 2005). While the extensive Hi study of the group by Kantharia et al. (2005) using GMRT clearly detected several tidal and ram pressure events in the galaxies NGC 2820, NGC 2814 and Mrk 108 which are referred to as triplet in rest of the paper; owing to NGC 2805 being located close to the half power point in the GMRT primary beam during the observations; the reduced sensitivity did not recover all the Hi in the galaxy. The current data downloaded from the GMRT archives, is free from this constraint with the pointing centre being between NGC 2820 and NGC 2805.
NGC 2805 is an Sd galaxy seen nearly face-on and is the brightest member in the group Holmberg 124. The Hii regions in NGC 2805 appear to be distorted on the side of the galaxy opposite to the companion (Hodge, 1975). Hi has been detected from the galaxy (Reakes 1979; Bosma et al. 1980; Kantharia et al. 2005) and Bosma et al. (1980) report that the outer Hi layers are warped. A spectroscopic study of a few galaxies including NGC 2805 have been described by Ganda et al. (2006). This investigation reveals that the galaxy seems to be also optically disturbed, since the spiral arms appear to be broken up into segments. They have employed SAURON spectrograph and have studied the central parts of the galaxy and detect slow projected stellar velocities and a central drop in velocity dispersion. They conclude that this could be due to the lack of a classical stellar bulge and the presence of small-scale structures (nuclear star clusters, inner rings, inner bars). The gas has a clumpy distribution and rotates consistently with the stars. Low values of the line ratio [Oiii]/H are observed over the central 33 41 arcsec2 of the galaxy, possibly indicating ongoing star formation (Ganda et al., 2006). Boker et al. (2002) have reported that the galaxy hosts a compact luminous stellar cluster in the centre and performing an analytical fit to the surface brightness profiles have obtained a size for the nuclear star cluster of 8.2 pc and an absolute I-band magnitude of -13.32 for a distance of 28.1 Mpc to NGC 2805. The H rotation curve studies of NGC 2805 by Garrido et al. (2004) reveal that it is quite regular and symmetric and reaches 70 km s-1 at 30 arcsec, then rises slowly up to 85 km s-1 (beyond 120 arcsec). They find that on the isovelocities map, the position of the major axis is changing with radius and the approaching side rises beyond 120 arcsec up to 120 km s-1; confirming the warps pointed out by the Bosma et al. (1980). The equipartition magnetic field in NGC 2805 has been estimated to be 1.86 G (Fitt et al., 1993).
In this paper, we present new Hi images of the group Holmberg 124 especially the almost face-on spiral member, NGC 2805. We also present the kinematics of NGC 2805 and discuss the observed morphology. We combine our new sensitive radio continuum maps at 20cm of the triplet with the 325 MHz maps from Kantharia et al. (2005) and present the spectral index distribution across the triplet members. We compare the radio emission with other wavebands and comment on the evolution of the group especially the physical processes acting on NGC 2805. Based on our new images and using data from literature, we refine the model given by Kantharia et al. (2005) for the poor group of galaxies Holmberg 124. We assume the distance of the group to be 25 Mpc with the estimated velocity dispersion along the line of sight as 16273 km s-1 (Kantharia et al., 2005).
| Properties | NGC 2805 | NGC 2820 | NGC 2814 | IC 2458 |
|---|---|---|---|---|
| (Mrk 108) | ||||
| Optical sizea | ||||
| Classificationa | SAB(rs)d | SB(s)c | Sb | I0 pec |
| Radial velocitya (km s-1) | 1725 | 1574 | 1592 | 1534 |
| Optical linear size (kpc) b | 45 | 31.2 | 8.7 | 3.6 |
| B band magnitude (absolute)c | 20.84 | 20.70 | 18.88 | 16.89 |
| log FIR (W m-2)d 10-14 | 10.921.3 | 23.301.5 | 100.4 | —- |
| Single dish Hi flux density | ||||
| (Jy km s-1)e | 90.070.68 | —- | —- | —- |
Notes: (a) NASA/IPAC Extragalactic Data base (NED)
(b) distance, where is the major axis of the galaxies in arcmin.
(c) Hyperleda
(d) log FIR () =
The flux density values for 60 and 100 m have been taken from NED.
For Mrk 108, 60 and
100 m flux density values are not available.
(e) Lang et al. (2003); single dish flux densities are not available for the other galaxies.
2 Data analysis
The data analyzed and presented here are obtained from the GMRT archives. GMRT is an array of 30 antennas, each of 45 meter in diameter spread over a maximum baseline length of 25 km (Swarup et al., 1991). An observing bandwidth of 4 MHz centered at 1411.2 MHz (which corresponds to a heliocentric velocity 1725 km s-1) was used. The band was divided into 128 spectral channels giving a channel spacing of 6.63 km s-1. Flux calibration was done using scans on the standard calibrator 3C147 and 3C286, and which were observed at the start and end of the observing run. Phase calibration was done using the calibrator source 0834+555 ( away from the target source) which has GHz = 8.3 Jy. Phase calibrator was observed once in every 30 minutes. Bandpass calibration was done using 3C147. The total on-source time was 8 hours. The data was reduced using standard tasks in NRAO AIPS1. Bad data due to dead antennas or radio frequency interference (RFI) and antennas with significantly lower gain than others were flagged. The calibrated data were then used to make the 21cm radio continuum images by averaging the line-free channels. This data was imaged using IMAGR. The final continuum image with a resolution of , PA . was made using uniform weighting and had an rms noise of 0.067 mJy/beam. For making the Hi line emission images, the calibrated data were continuum subtracted using the AIPS tasks UVSUB. The task IMAGR was then used to get the final three-dimensional deconvolved Hi data cubes. From these cubes, the moment maps giving Hi column density, the intensity-weighted Hi velocity field and the intensity-weighted dispersion were extracted using the AIPS task MOMNT. Data cubes were made at various cutoffs in the uv plane such as 0-20 , 0-15 , 0-10 and 0-5 by using natural weighting. The corresponding angular resolutions are . RMS noise per channel for the different maps was 0.68 mJy/beam, 0.79 mJy/beam, 0.92 mJy/beam and 1 mJy/beam respectively. While the high resolution images fragmented the large scale emission; the lowest resolution image only smoothened the detected features. Thus, the image made with a resolution of , PA was used for subsequent analysis since it was sensitive to all the detected Hi and also retained sufficient resolution to resolve the features within the large disk. Peak Hi column density (as derived from the , PA resolution image) in NGC 2805 is about 1020 atoms cm-2. We use the image with an angular resolution of , PA in rest of the discussion unless specified otherwise.
| No | UV cutoff | Beam size | Position angle | Continuum | Spectral channel |
|---|---|---|---|---|---|
| k | arcsec2 | degree | mJy/beam | mJy/beam | |
| 1 | Full-range | 64 | 87.8 | 0.067 | - |
| 2 | 0-20 | 1311 | 69.7 | 0.079 | 0.68 |
| 3 | 0-15 | 1715 | 79.1 | 0.100 | 0.79 |
| 4 | 0-10 | 2622 | 70.3 | 0.130 | 0.92 |
| 5 | 0-5 | 4138 | 50.0 | 0.230 | 1.00 |
3 Results and discussion
3.1 Hi emission
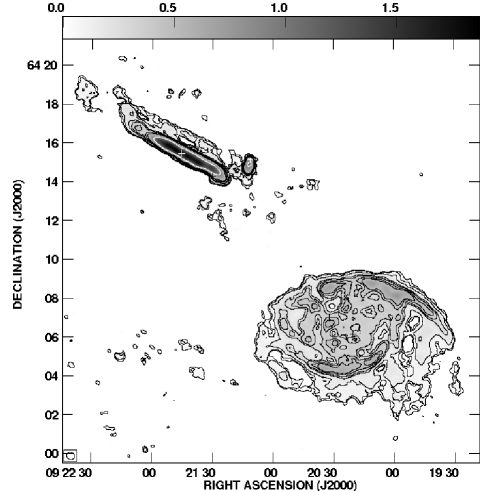
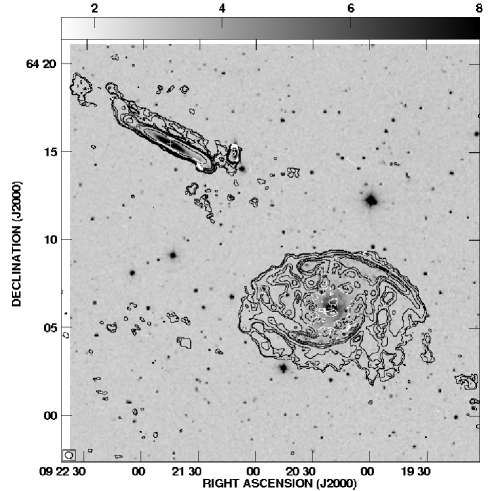
21cm Hi emission is detected from all the group members (NGC 2805, NGC 2820, NGC 2814 and Mrk 108). Fig. 1(a) shows the column density of Hi in the member galaxies. In Fig. 1(b), the column density of Hi is shown superposed on the DSS optical image. All the members of the group are Hi rich and the Hi disk is more extended than the optical galaxy. Hi emission is also detected from several other features such as the bridge. In the case of NGC 2820, the Hi morphology is asymmetric with a large Hi loop seen to the north-west of NGC 2820 and a bridge is detected connecting NGC 2820 and Mrk 108 with NGC 2814. This is the first detection to the best of our knowledge of the entire Hi bridge connecting the triplet members. However, detection of part of the bridge has been reported earlier by Kantharia et al. (2005). A streamer positionally emerging from NGC 2814 but kinematically distinct from it is also detected here. The Hi disk in NGC 2814 is displaced to the south relative to the optical disk. A Hi tail is seen to the west of NGC 2814. We confirm the detection of the tidal dwarf galaxy located to the north-east of NGC 2820 that Kantharia et al. (2005) had first reported. All features that were reported by Kantharia et al. (2005) are visible in our map - additionally we detect the entire Hi bridge and small Hi clouds around the triplet Fig. 1(a) and Fig. 1(b). Since these are low column density clouds, they need to be confirmed. We note that such Hi clouds residing in the intragroup environs have been detected in several groups (Verdes-Montenegro et al. 2001; Dahlem 2005; Kilborn et al. 2006).
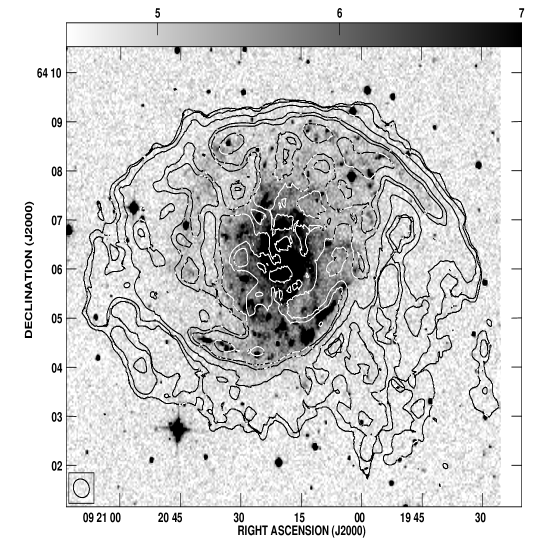
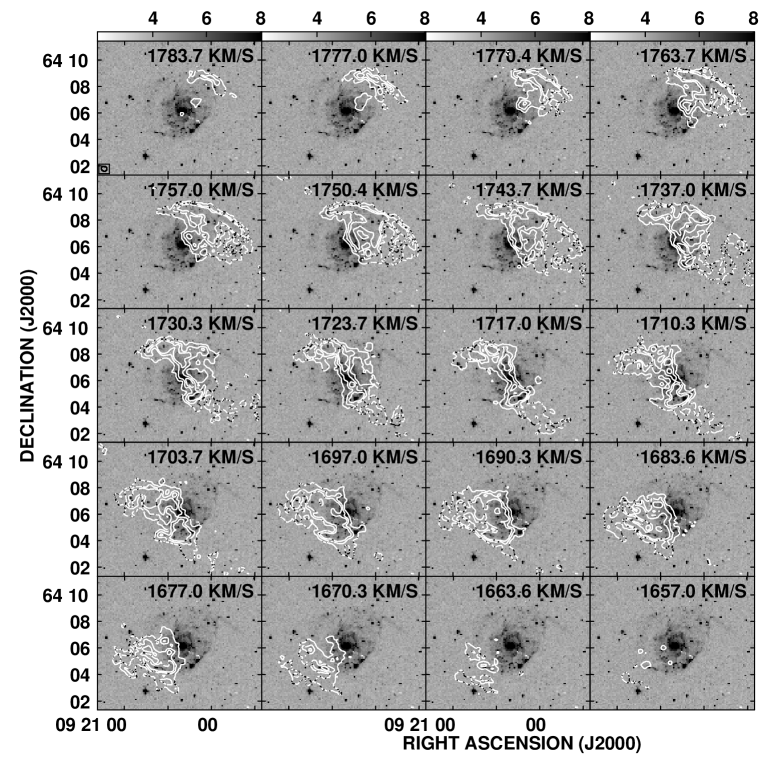
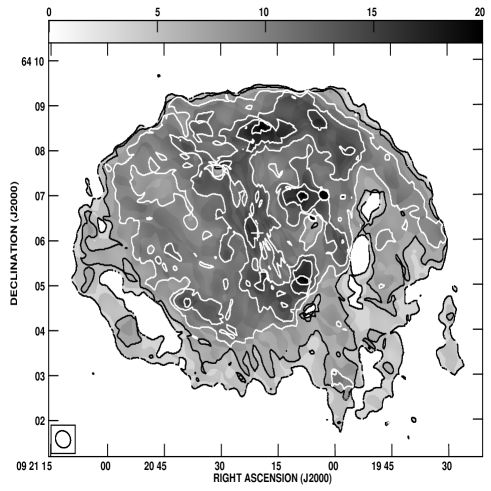
The Hi disk of NGC 2805 upto a column density cutoff of 1.081019 cm-2 is 8.3′ 6.6′ which is 30 % more extended than the optical disk. The integrated line strength is 86.91.2 Jy km s-1 and the Hi mass estimated from this is 12.5 109 M⊙. The integrated Hi intensity map and Hi kinematics of NGC 2805 overlayed on the digitized sky survey (DSS) blue band image are shown in Figs. 2, 3. As seen in Fig. 2, enhanced Hi column densities are seen to be confined to the optical disk of the galaxy with the highest column densities along the northern star forming ridge and the southern spiral arm. Hi extends well beyond the optical disk of the galaxy. Low column density gas is seen to extend beyond the southern ridge of star formation. This gas appears to be patchy and flocculent. Interestingly, Hi does not extend beyond the northern ridge and there seems to be an abrupt fall in the column densities. The column densities over most of the disk is uniform. In Fig. 4, the spectral channel maps of the Hi from NGC 2805 are shown. The disk is rotating with the north-west receding from us and the south-east approaching us. The SDSS gri image shows an intense bow-like ridge to the south (also seen in other images) which ends abruptly in the south-west. The morphology is reminiscent of star formation being triggered by compression such as by ram pressure. The Hi emission detected beyond this ridge might not arise in the disk of the galaxy but as the galaxy moves in the IGrM, is being blown away by ram pressure. The observations suggests that the extended gas might be non-coplanar with the NGC 2805 disk.
3.2 Hi kinematics
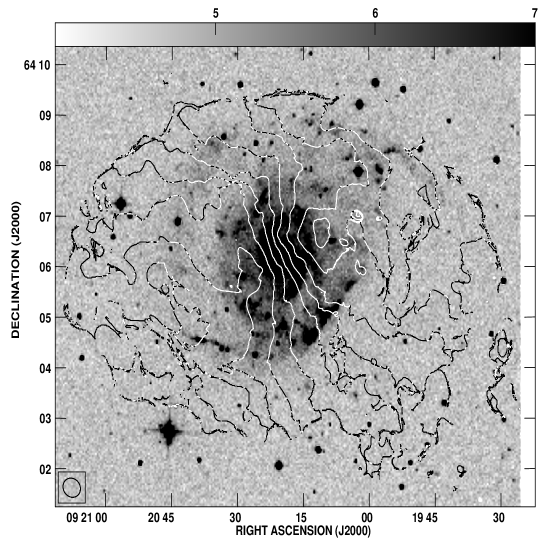
Fig. 3 shows the velocity field of NGC 2805. The gradient in the velocity field from the north-west to the south-east is clearly seen. The Hi velocity field is fairly regular inside the optical disk but appears distorted beyond it; which is quite often a signature of a warp in the Hi disk. Several galaxies which show such features are well-fitted by a tilted ring model. Wiggles are also visible on smaller scales inside the optical disk. Fig. 4 lets us better understand the connection between the optical and Hi structures. Notice the low column density gas in the west, south-west of the optical disk especially in the spectral channels with velocities ranging from 1744 km s-1 to 1710 km s-1. This tenuous gas shows peculiar morphological and kinematic characteristics raising interesting possibilities on its origin. Notice the cloud near the centre of galaxy detected near velocities km s-1 in Fig. 4 which might be extraplanar.
3.3 Hi Velocity dispersion
Intensity-weighted velocity dispersion (second moment) map of NGC 2805 is shown in Fig. 5. The dispersion ranges from 2 to 20 km s-1 with the largest dispersion seen in three distinct regions in the galaxy. The southern region showing a wide line is coincident with an intense star forming region in the southern arm. However the two other broad line regions are not coincident with intense star forming regions. One of them lies to the south of the northern arc in NGC 2805 and the other is coincident with the star forming region in the northern arc which has large Hi column densities. The central broad line region is coincident with the possible extraplanar cloud that was mentioned in the previous section. The central regions of the galaxy show lines of dispersion km s-1. Parts of the optical disk, the southern ridge and northern broken ring show dispersion of km s-1. Rest of the gas mass which is likely associated with the disk has a dispersion of about 9 km s-1.
The lines from diffuse gas in the southern region outside the star forming ridge are narrow and have a line width of 3 to 6 km/s. This gas has no star formation associated with it. Moreover as noted earlier, there is a possibility of this gas being extraplanar probably in the process of being gently stripped due to ram pressure effects.
3.4 Radio continuum
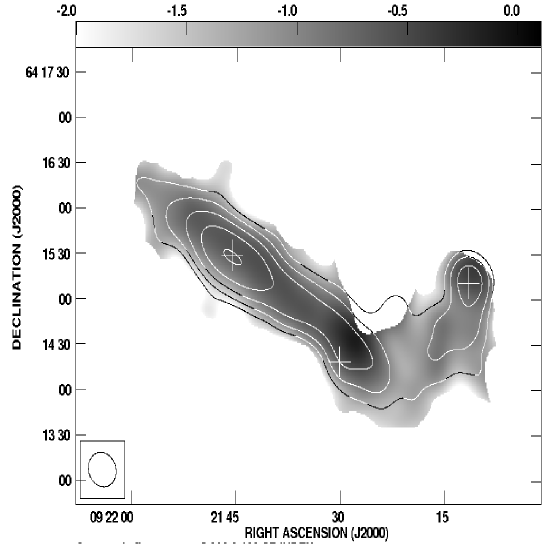
We detect radio continuum emission at 21cm from the triplet. We also detect the bridge of radio emission connecting NGC 2820/Mrk 108 with NGC 2814, which was first detected by van der Hulst et al. (1985). But, no radio continuum emission was detected down to a 3 flux density limit of about 0.4 mJy/beam (for beam size of ) from NGC 2805 at 21cm. Hence using the NVSS flux density of NGC 2805 at 21cm and the 90cm flux density from Kantharia et al. (2005), we estimate the spectral index to be 0.80.2. In order to study the spectral index distribution in the bridge and the triplet of galaxies we use the 21cm image along with the 90cm image from Kantharia et al. (2005) and the results are shown in Fig. 6. Kantharia et al. (2005) who used the total emission at 20cm and at 90cm estimated a spectral index of for the bridge emission. This is similar to the distribution shown in Fig. 6 which reveals that most of the bridge shows a spectral index steeper than . While the spectral index close to Mrk 108 and the optical disk of NGC 2814 seem to be about -0.6; the spectral index of most of the emission from NGC 2820 is found to be steeper than Mrk 108.
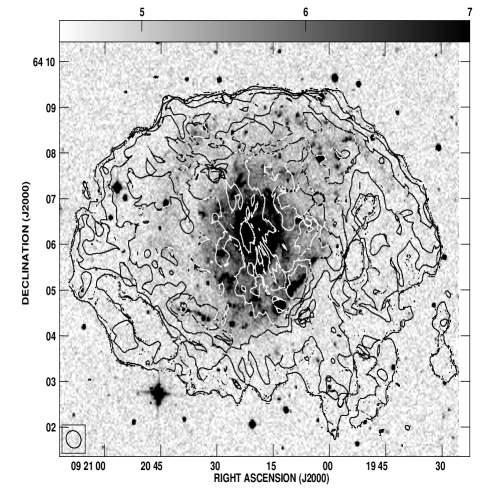
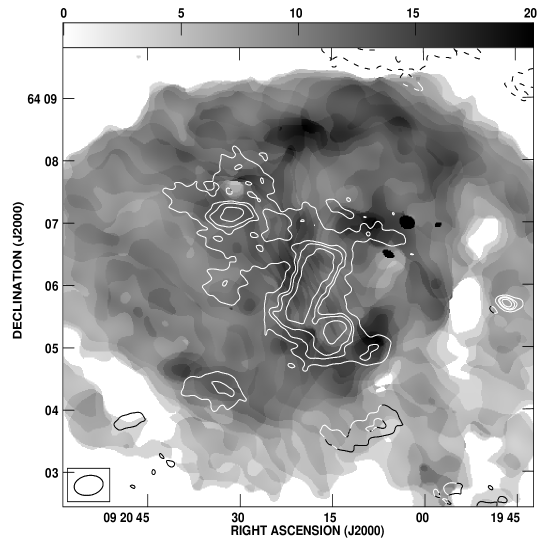
We present a comparison of 325 MHz radio continuum emission (from Kantharia et al. 2005) with the Hi emissions in Fig. 7. It turns out that the radio continuum emission at 325 MHz, which is confined to the optical disk, is seen to be coincident with the two of the broad line regions seen in Hi. Incidentally, the radio continuum emission is detected from the regions which show higher Hi velocity dispersion in the galaxy [Fig. 7]. However, no radio continuum emission at 325 MHz is detected from the northern arc which shows weak star formation.
Artamonov (1994) have pointed out the chain of blue condensation along the spiral arms in NGC 2805 and concluded that the median age of these blue objects with dust correction is 106 -107 yr. This interpretation is supported by the morphologies seen in the NIR by 2MASS and in the UV by GALEX images of NGC 2805. Both these show excess nuclear emission but the southern spiral arm is barely visible in the NIR image. In the UV image, young star forming regions are visible throughout the inner spiral arms and along the spiral bow-shaped ridge. This suggests that star formation has been recently triggered throughout this galaxy, probably due to an external interaction in the group environs. The burst of star formation could have been triggered less than 107 years ago, thus explaining the absence of radio continuum emission being associated with all the regions. Assuming that the entire emission detected from NGC 2805 at 1.4 GHz by NVSS is non-thermal synchrotron emission due to star formation, we estimate a global SFR of 0.86 Myr-1 for NGC 2805. The SFR per unit area of the NGC 2805 disk is estimated to be M⊙ yr-1 pc-2 and for the southern spiral arm is M⊙ yr-1 pc-2. This suggests that the parts of the disk of NGC 2805 from which radio continuum emission at 1.4 GHz is detected show uniform rate of star formation throughout the disk. Normal star forming galaxies show SFR which range from to M⊙ yr-1 pc-2 (Kennicutt, 1998) and NGC 2805 falls in this range as expected.
| Parameters | NGC 2805 | NGC 2820 |
|---|---|---|
| Hi flux density (Jy km s-1) | 86.91.2 | 49.41.1 |
| Hi mass (109 ) | 12.5 | 7.1 |
| Flux density at 1.4 GHz (mJy) | 19.50.3a | 900.26b |
| FIR to radio correlation (q) | 2.20.02 | 1.80.03 |
| SFR1.4MHzc (/yr) | 0.860.5 | 3.90.2 |
| Integrated flux density at 325 MHz(mJy) | 73.10.9 | 227 |
| Spectral Index () | -0.80.2 | -0.6d |
Notes: The result at 325 MHz are taken from (Kantharia et al., 2005). (a) The flux density of NGC 2805 is estimated from the NVSS 1.4 GHz image. (b) Flux density at 1.4 GHz has been estimated for NGC 2820+Mrk 108 using our 1.4 GHz radio continuum map. (c) SFR1.4GHz drive from the (Yun et al., 2001). (d) Since its difficult to separate the flux density of NGC 2820 and Mrk 108, The flux density and spectral index includes contribution from both the galaxies.
3.5 The model
Kantharia et. al (2005) have proposed a model for Holmberg 124; especially the triplet galaxies namely NGC 2820, NGC 2814 and Mrk 108; according to which both tidal and ram pressure effects are operative in this triplet galaxies and also likely for NGC 2805. Our analysis of the radio continuum and the 21cm Hi images support their scenario for the triplet. The tidal features that we detect are (i) the radio continuum and Hi bridge connecting NGC 2820, Mrk 108 with NGC 2814, (ii) the streamer spatially connected to NGC 2814 but kinematically distinct from it and (iii) the tidal dwarf galaxy to the north-east of NGC 2820. Further, as discussed below, our analysis supports their view regarding the triplet viz., NGC 2820 has dominant motion in the south-east and NGC 2814 to the north in the sky plane. This motion in the IGrM, with a small line-of-sight component, leads to ram pressure effects leaving detectable morphological imprints on the member galaxies in the atomic Hi and radio continuum emission in the sky plane.
We estimate an Hi deficiency of for NGC 2805 and for NGC 2820, indicating that the two giant spirals are not Hi-deficient and hence it is likely they have just started experiencing ram pressure effects which are observed as morphological signatures. For estimating the deficiency, we have used the prescription in which the Hi content of a particular galaxy type is compared to the Hi content in a field galaxy as given by Haynes & Giovanelli (1984). For NGC 2805, we used type 4 and for NGC 2820 we used the Hi content of type 5 galaxy. Since we have been able to obtain better Hi images of the low inclination galaxy NGC 2805, we can comment on the physical processes which the galaxy is likely experiencing and which in turn can explain the observed Hi distribution. We can explain both the sharp fall in the Hi column density in the north and the star forming ridge along the spiral arm in the south due to the motion of the galaxy in the IGrM. Enhanced star formation is observed in the nuclear regions of the galaxy (Ganda et al., 2006). Moreover while the NIR emission is predominantly centrally concentrated; the UV and H emission arise from several regions in the galaxy and is especially intense in the southern spiral arm. Based on all this, we suggest that NGC 2805 is moving along a direction at a small angle to the line-of-sight and tilted towards the triplet i.e. north-west. The ram pressure effects on NGC 2805 is due to an almost face-on encounter with the IGrM with the northern Hi arc being the leading edge. This is similar to the model given for NGC 4254 (Vollmer et al. 2005; Kantharia et al. 2008) where almost the entire disk of the galaxy is encountering the IGrM in a face-on event which leads to compression and enhanced star formation in the southern arm. The star formation in the southern spiral arm in NGC 2805 has been triggered by the large gas densities encountering the IGrM. The motion of the galaxy and the subsequent ram pressure effects leads to gas being stripped out of the disk which explains the tenuous Hi gas detected in the south-west. Simulations e.g. Roediger & Bruggen (2006) where the galaxy has an face-on encounter with the IGrM also show the gas being stripped off and appearing to form a gas halo around the galaxy in the sky plane. As suggested by Kantharia et al. (2005), the motion of NGC 2820 and NGC 2814 is predominantly in the sky plane with a small line-of-sight component. This is supported by the systemic velocity of all the components. The velocities of NGC 2820 and NGC 2814 are 1574 and 1592 km s-1 respectively while the velocity of NGC 2805 is 1725 km s-1 - this supports our model that its motion is predominantly radial and receding.
4 Summary
In this paper, we have presented new Hi images of the member galaxies of the group Holmberg 124 made from archival GMRT 21cm Hi data. These images confirm the results of Kantharia et al. (2005) for the triplet consisting of the large spiral NGC 2820 and the smaller late type galaxies NGC 2814 and Mrk 108 including the detection of a possible tidal dwarf galaxy and the large asymmetric Hi loop seen along the minor axis in NGC 2820. Moreover, superior quality Hi emission images of NGC 2805 are presented and comparison with single dish data shows that the GMRT data has recovered most of the Hi mass for this galaxy with large angular size with the GMRT estimate being lower by only about 5%. NGC 2805 is a low inclination galaxy and its optical emission is characterized by a star forming ridge along a spiral arm in the south and a star forming arc in the northern part in addition to star formation throughout the galaxy. Our Hi column density maps show enhanced column densities in the northern arc and in the southern spiral arm with Hi from the entire optical disk and diffuse Hi detected beyond the southern arm. This diffuse Hi shows peculiar morphology and has low velocity dispersion compared to rest of the galaxy. It also seems to be losing rotation. Based on these properties, we suggest that this gas might not be co-planar to the rest of the disk emission but might be being stripped off the galaxy as it moves through the IGrM. From the combined nature of the Hi and optical morphologies, we suggest that NGC 2805 is showing clear signatures of ram pressure effects resulting from it motion along a direction close to the line-of-sight but tilted towards the triplet i.e. towards north-east. This is supported by the systemic velocities of the galaxies - the velocities of the triplet galaxies are similar whereas that of NGC 2805 differs from these by more than 100 km s-1. So while the triplet have dominant motion in the sky plane, NGC 2805 has dominant motion along the line-of-sight direction. The compressed Hi in the north, the star formation triggered throughout the galaxy and especially the southern spiral arm and the diffuse gas to the south of the galaxy are all explained in this model, since the entire disk of NGC 2805 would encounter the IGrM. Neither of the large spiral galaxies are Hi deficient indicating that they are probably in the initial stages of experiencing ram pressure effects. We note that this is an interesting group of late type galaxies with one galaxy seen at high inclination and the other at low inclination allowing us to study a range of features due to ram pressure effects. We also report tentative detection of Hi in the IGrM in the form of small discrete clumps near NGC 2820. The clumps near NGC 2820 are detected near the asymmetric loop and south of the triplet. We note that these features need confirmation since their detection in the GMRT data is marginal. It will be very interesting to follow up these interesting results with deep X-ray observations of the IGrM and Hi observations sensitive to larger angular scales. It is necessary to observe many more such groups to understand the physical mechanisms which control the evolution of the member galaxies, especially since more than 60% of all galaxies are believed to be in group environs. While tidal interactions are believed to be active in such systems; there are increasing number of systems where ram pressure effects seem to be showing observable effects.
Acknowledgements
We thank the staff of the GMRT who made this observations possible. The GMRT is operated by the National Centre for Radio Astrophysics of the Tata Institute of Fundamental Research. A. Mishra thanks National Centre for Radio Astrophysics for support and hospitality. We thank S. Ananthakrishnan for suggesting that we examine the archival data on this group. We would also like to thank D.J. Saikia, Editor, BASI and an anonymous referee for giving several useful suggestions. This research has made use of NASA/IPAC Infrared Science Archive and the NASA/IPAC Extragalactic Data base (NED) both of which are operated by Jet Propulsion Laboratory, California Institute of Technology under contract with the National Aeronautics and Space Administration.
References
- Artamonov (1994) Artamonov B. P., 1994, IAUS, 161, 592
- Boker et al. (2002) Boker T., Laine S., van der M., Roeland P., Sarzi M., Rix H. W., Ho L. C., Shields J. C., 2002, AJ, 123, 1389B
- Bosma et al. (1980) Bosma A., Casini C., Heidmann J., van der Hulst J. M., van Woerden H., 1980, A&A, 89, 345
- Chung et al. (2007) Chung A., van Gorkom J. H., Kenney J. D. P., Vollmer B., 2007, ApJ, 659, 115
- Dahlem (2005) Dahlem M., 2005, A&A, 429, 5
- Fitt et al. (1993) Fitt J. A., Alexander P., 1993, MNRAS, 261, 445
- Ganda et al. (2006) Ganda K., Falcon-Barroso J., Peletier R. F., Cappellari M., Emsellem E., McDermid R. M., de Zeeuw P. T., Carollo C. M., 2006, MNRAS, 367, 46G
- Garrido et al. (2004) Garrido O., Marcelin M., Amram P., 2004, MNRAS, 349, 225
- Gunn & Gott (1972) Gunn J. E., Gott III J. R., 1972, ApJ, 176, 1
- Haynes & Giovanelli (1984) Haynes M. P., Giovanelli R., 1984, AJ, 89, 758
- Hodge (1975) Hodge W. P., 1975, ApJ, 201, 556
- van der Hulst et al. (1985) van der Hulst J. M., Hummel E., 1985, A&A, 150L, 7V
- Kantharia et al. (2005) Kantharia N. G., Ananthakrishnan S., Nityananda R., Hota A., 2005, A&A, 435, 483
- Kantharia et al. (2008) Kantharia N. G., Rao A. Pramesh, Sirothia S. K., 2008, MNRAS, 383, 173
- Kennicutt (1998) Kennicutt Robert C. Jr., 1998, ApJ, 498, 541
- Kilborn et al. (2006) Kilborn V. A., Forbes D. A., Koribalski B. S., Brough S., Kern K., 2006, MNRAS, 371, 739
- Lang et al. (2003) Lang H. R., Boyce P. J., Kilborn V. A., Minchin R. F., Disney M. J., Jordan C. A., Grossi M., Garcia D. A., Freeman K. C., Philipps S., Wright A. E., 2003, MNRAS, 342, 738L
- Moore et al. (1996) Moore B., Katz N., Lake G., Dressler A., Oemler A., 1996, Natur., 379, 613
- Nulsen (1982) Nulsen P. E. J., 1982, MNRAS, 198, 1007
- Rasmussen et al. (2012) Rasmussen J., Bai X. N., Mulchaey J. S., van Gorkom J. H., Jeltema T. E., Zabludoff A. I., Wilcots E., Martini P., Lee D., Roberts T. P., 2012, ApJ, 747, 31
- Reakes (1979) Reakes M., 1979, MNRAS, 187, 525
- Roediger & Bruggen (2006) Roediger E., Bruggen M., 2006, MNRAS, 369, 567
- Sengupta et al. (2007) Sengupta C., Balasubramanyam R., Dwarakanath K. S., 2007, MNRAS, 378, 137
- Swarup et al. (1991) Swarup G., Ananthakrishnan S., Kapahi V. K., Rao A. P., Subrahmanya C. R., Kulkarni V. K., 1991, Current Science, 60, 95
- Toomre & Toomre (1972) Toomre A., Toomre J., 1972, ApJ, 178, 623
- Toomre (1977) Toomre A., 1977, in Beatrice M., Tinsley and Richard B. Larson, eds. Evolution of Galaxies and Stellar Population, New Haven, Yale University Observatory, p. 401
- Verdes-Montenegro et al. (2001) Verdes-Montenegro L., Yun M.S., Williams B.A., Huchtmeier W. K., Del Olmo A., Perea J., 2001, A&A, 377, 812
- Vollmer et al. (2001) Vollmer B., Cayatte V., Balkowski C., Duschl W. J., 2001, ApJ, 561, 708
- Vollmer et al. (2005) Vollmer B., Huchtmeier W., van Driel W., 2005, A&A, 439, 921
- Yun et al. (2001) Yun M.S., Reddy N.A., Condon J.J., 2001, ApJ, 554, 803