DISCOVERY OF A GIANT RADIO HALO IN A NEW PLANCK GALAXY CLUSTER PLCKG171.9-40.7
Abstract
We report the discovery of a giant radio halo in a new, hot, X-ray luminous galaxy cluster recently found by Planck, PLCKG171.9-40.7. The radio halo was found using Giant Metrewave Radio Telescope observations at 235 MHz and 610 MHz, and in the 1.4 GHz data from a NRAO Very Large Array Sky Survey pointing that we have reanalyzed. The diffuse radio emission is coincident with the cluster X-ray emission, and has an extent of 1 Mpc and a radio power of W Hz-1 at 1.4 GHz. Its integrated radio spectrum has a slope of between 235 MHz and 1.4 GHz, steeper than that of a typical giant halo. The analysis of the archival XMM-Newton X–ray data shows that the cluster is hot ( keV) and disturbed, consistent with X-ray selected clusters hosting radio halos. This is the first giant radio halo discovered in one of the new clusters found by Planck.
Subject headings:
galaxies: clusters: general — galaxies: clusters: individual (PLCKG171.9-40.7) — intergalactic medium — radio continuum: general — X–rays:galaxies: clusters1. Introduction
Spectacular diffuse radio sources, with very low surface brightness and Mpc extent, are observed in some of the most massive galaxy clusters. Depending on their location, i.e., cluster center versus outskirts, these cluster-wide sources are classified as giant radio halos or relics (see Ferrari et al., 2008; Venturi, 2011; Feretti et al., 2012, for reviews; see van Weeren et al. (2012); van Weeren (2011); Kale & Dwarakanath (2010, 2012); Giacintucci et al. (2011); Brown & Rudnick (2011); Bonafede et al. (2012) for recent results). Halos and relics are due to synchrotron emission from ultrarelativistic electrons with energy of several GeV, spinning in G magnetic fields that permeate the hot intracluster medium (ICM).
Particle acceleration and magnetic field amplification during cluster mergers have been proposed as mechanisms by which diffuse radio emission is generated in clusters. In particular, relics should be produced by electron (re)acceleration at merger shocks (Ensslin et al., 1998; Markevitch et al., 2005; Hoeft & Brüggen, 2007; Kang & Ryu, 2011; Kang et al., 2012), while giant halos may be caused by reacceleration of lower energy relativistic electrons by MHD turbulence during mergers (Brunetti, 2011, and references therein). Although alternative possibilities have been proposed for the origin of the radio-emitting electrons – the secondary models (e.g., Dennison, 1980; Blasi & Colafrancesco, 1999; Pfrommer & Enßlin, 2004; Keshet & Loeb, 2010; Enßlin et al., 2011) – turbulent reacceleration models seem to be favored by current radio observations (e.g., Venturi et al., 2008; Brunetti et al., 2008; Brunetti et al., 2009; Macario et al., 2010; Donnert et al., 2010; Brown & Rudnick, 2011; Brunetti et al., 2012). In particular, radio halos with very steep spectral index111We adopt the convention , where is the is the flux density at the frequency . () have been found (the prototype case is A 521 with , Brunetti et al., 2008; Dallacasa et al., 2009), consistent with turbulent reacceleration in weak mergers, i.e., collisions between clusters with relatively low mass ( M⊙) or accretion of smaller systems into a massive cluster. Secondary models have difficulty explaining such ultra-steep spectrum radio halos (USSRHs), due to the large energy required in the form of relativistic protons (e.g., Brunetti et al., 2008; Macario et al., 2010; van Weeren et al., 2011). However, only two giant radio halos are confirmed USSRHs so far – A 521 and A 697 – based on a well-constrained spectrum with five data points between 150 MHz and 1.4 GHz (Macario et al. 2013). Other possible USSRHs still lack confirmation of their spectral index (e.g., Giacintucci et al. 2011) and are currently under investigation. Therefore, it is necessary to confirm the candidates and find more of these USSRHs, with an accurate determination of their spectral index, before ruling out the secondary models.
A number of dedicated searches for cluster diffuse radio sources have been carried out in the past decade (e.g., Giovannini et al., 1999; Kempner & Sarazin, 2001; Venturi et al., 2007; Venturi et al., 2008; Giovannini et al., 2009; van Weeren et al., 2009; van Weeren et al., 2011), and the number of giant halos and relics has rapidly increased. While 50 objects are presently known (including candidates), because of their low surface brightness, most of them lack detailed spectral information, crucial to test theoretical models and understand the origin of the radio-emitting electrons (e.g., Venturi et al., 2013).
The Planck222Planck (http://www.esa.int/Planck), a project of the European Space Agency (ESA) with instruments provided by two scientific consortia funded by ESA member states (in particular the lead countries France and Italy), with contributions from NASA (USA) and telescope reflectors provided by a collaboration between ESA and a scientific consortium led and funded by Denmark. Early Sunyaev-Zel’dovich (ESZ) cluster sample (Planck Collaboration et al., 2011b) is an all-sky sample of clusters, detected by their multi-frequency signature in the Planck microwave observing bands (30–857 GHz; Planck Collaboration et al., 2011a). Clusters are detected through the measurement of the spectral distortion of the cosmic microwave background (CMB) due to inverse Compton scattering of CMB photons by the thermal electrons in the ICM – the Sunyaev Zel’dovich (SZ) effect (Sunyaev & Zeldovich, 1972). The Compton -parameter, a measure of the SZ effect, does not suffer dimming due to distance, and its integral over the cluster is a measure of the total thermal energy in the cluster. Therefore, SZ surveys are a powerful tool to find massive clusters at high redshifts. A total of 51 new clusters discovered by Planck have been confirmed by follow-up X-ray XMM-Newton and optical observations (Planck Collaboration et al., 2011c, 2012a, 2012b). Most of these new clusters appear to be hot, massive systems with highly irregular and disturbed X-ray morphologies, and thus good targets to search for new radio halos and relics. Recently, double radio relics in one of the new Planck clusters, PLCKESZ G, have been discovered by Bagchi et al. (2011) using the Giant Metrewave Radio Telescope (GMRT). Here, we report a GMRT detection of a giant radio halo in the newly discovered Planck cluster PLCKESZ G171.94-40.65 (hereafter PLCK171). The cluster, whose general properties are summarized in Table 1, is an X-ray luminous ( erg s-1) system at a redshift of , as determined through the XMM Fe K line spectroscopy (Planck Collaboration et al., 2011c). An optical photometric redshift of , based on 29 cluster members, is reported by Planck Collaboration et al. (2012a).
In this paper, we adopt and the CDM cosmology with H0=70 km s-1 Mpc-1, and . Under these assumptions, corresponds to 4.135 kpc.
| RAJ2000 (h m s) | 03 12 57.4 |
|---|---|
| DECJ2000 (∘ ′ ′′) | 08 22 10 |
| 0.27 | |
| ( erg s-1) | 1.13 |
| (keV) | 10.65 |
| M500 (M⊙) | |
| (Mpc) | 1364.5 |
| angular scale (kpc/ ′′) | 4.135 |
2. Radio observations
2.1. GMRT observations
PLCK171 was observed with the GMRT at 235 MHz and 610 MHz in October 2011, as part of a project to search for diffuse radio emission in 8 Planck clusters (project ). The cluster was observed for 5 hours in dual-frequency mode, recording LL polarization at 235 MHz and RR polarization at 610 MHz.
The data were collected in spectral-line mode, using the GMRT software backend (GSB; Roy et al., 2010) with a total observing bandwidth of 32 MHz at 610 MHz divided in 512 spectral channels. A bandwidth of 6 MHz was used at 235 MHz. Details on these observations are summarized in Table 2, which reports observing date, frequency and total bandwidth (columns 1, 2 and 3), total time on source (column 4), usable time after data editing (column 5), full-width half maximum (FWHM) and position angle (PA) of the full array (column 6), rms level () at full resolution (column 7).
| Observation | ttot | t | FWHM, p.a. | rms | ||
|---|---|---|---|---|---|---|
| date | (MHz) | (MHz) | (hours) | (hours) | (, ∘) | (mJy beam-1) |
| Oct 22, 2011 | 235 a | 6 | 5 | 1 | 15.49.0, 64 | 0.80 |
| Oct 22, 2011 | 610 a | 32 | 5 | 1 | 5.54.5, 0 | 0.12 |
Notes to Table 2 – : observed in simultaneous 235 MHz/610 MHz mode.
The data sets were calibrated and reduced using the NRAO Astronomical Image Processing System (AIPS) package. The data were initially inspected to identify and remove bad channels, time intervals and visibilities with radio frequency interference (RFI). The data were found to be affected by severe phase instabilities caused by ionospheric scintillation during most of the observation, leaving only 1 hour of usable time at both 610 MHz and 235 MHz. The data were then calibrated. The flux density scale was set using 3C48 and 3C147 as amplitude calibrators and the Baars et al. (1977) scale. The source 0323+055 was used as a phase calibrator. The bandpass calibration was carried out using the flux density calibrators. Few of the central channels free of RFI were used to normalize the bandpass for each antenna. After the bandpass calibration, the central 420 channels were averaged to 35 channels each 0.78 MHz wide to reduce the size of the data set at 610 MHz, and, at the same time, to minimize the bandwidth smearing effects within the primary beam of the GMRT antenna. At 235 MHz, 72 channels were averaged to 18 channels of 0.25 MHz width each.
After further careful editing in the averaged data, a number of phase-only self-calibration cycles and imaging were carried out to reduce residual phase variations and improve the quality of the final images. Wide-field imaging was implemented at each step of the self-calibration process, to account for the non-planar nature of the sky. The final images were made using the multi-scale CLEAN implemented in IMAGR, which results in better imaging of extended sources compared to the traditional CLEAN (e.g., Clarke & Ensslin, 2006, for a detailed discussion see Appendix A in Greisen et al. (2009)). We used -functions as model components for the unresolved features and circular Gaussians for the resolved ones, with increasing width to progressively highlight the extended emission during the clean. The rms sensitivity levels achieved in the images at full resolution is 0.12 mJy beam-1 at 610 MHz and 0.80 mJy beam-1 at 235 MHz (Table 2). We also produced images with lower resolutions, down to , by tapering the data using UVTAPER and ROBUST in IMAGR. The noise reached in the images at the lowest resolution is 0.3 mJy beam-1 at 610 MHz and mJy beam-1 at 235 MHz. Residual amplitude errors should be within at 610 MHz (e.g., Chandra et al., 2004); a calibration uncertainty of is estimated at 235 MHz.
2.2. VLA observations
We also reprocessed and analyzed Very Large Array (VLA) data at 1.4 GHz from the NVSS (NRAO VLA Sky Survey; Condon et al., 1998) pointing containing PLCK171 (project AC308). The data were calibrated and reduced in AIPS. We used the standard Fourier transform deconvolution method to produce the images (CLEAN and RESTORE), and applied self-calibration to reduce the effects of residual phase errors in the data. The rms sensitivity level achieved in the final image is 0.2 mJy beam-1, with a restoring beam of . Our image is times more sensitive than the public NVSS image, which has a local rms noise of 0.4 mJy beam-1 ( restoring beam). Residual amplitude errors are within .
| Source | RAJ2000 | DECJ2000 | morphology | |||
|---|---|---|---|---|---|---|
| (h, m, s) | (, , ) | (mJy) | (mJy) | |||
| S1 | 03 12 53.2 | +08 23 12 | NAT | |||
| S2 | 03 12 53.9 | +08 23 05 | unresolved | |||
| S3 | 03 12 56.9 | +08 22 11 | † | - | unresolved | |
| S4 | 03 12 57.5 | +08 22 09 | † | - | NAT | |
| S5 | 03 12 57.3 | +08 21 37 | NAT | |||
| S6 | 03 12 58.3 | +08 21 14 | NAT | |||
| S7 | 03 12 54.4 | +08 20 35 | - | - | unresolved |
Notes to Table 3 – Peak coordinates are from the GMRT full-resolution image at 610 MHz (Fig. 1). Flux densities have been measured on the GMRT full-resolution images at 610 MHz and 235 MHz (Fig. 2). S1 and S5 are partially detected at 235 MHz, therefore lower limits are reported for and . † Sources S3 and S4 are not resolved in the 235 MHz image. Their combined flux density at 235 MHz is 248.4 mJy.
3. Radio galaxies in the cluster region
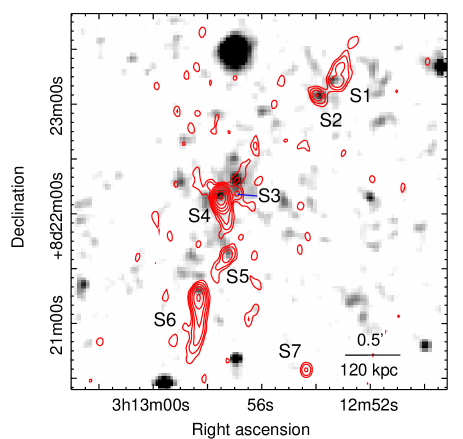
Figure 1 presents the GMRT 610 MHz contour image of PLCK171 at full resolution (5′′), overlaid on the optical image from the Digital Sky Survey (DSS). Discrete radio sources are labelled from S1 to S7. Their flux densities at 610 MHz and positions, both measured from the image in Fig. 1, are summarized in Table 3. All have optical counterparts on the DSS, except for S7. No redshift measurements are currently reported for these galaxies in the literature and optical catalogs. The cluster X-ray centre (Table 1) is approximately coincident with the peak of S4. Four sources (S1, S4, S5 and S6) show a narrow-angle tail (NAT) morphology. The tails of S4 and S6 are both oriented northward, while the tails of S1 and S5 point toward South-East and North-West, respectively, almost opposite to each other. Assuming that the NATs are at the redshift of the cluster, the length of their tails ranges, in projection, from 90 kpc (S5) to 180 kpc (S6), and their radio powers at 610 MHz are of the order of W Hz-1. These values are consistent with the range of size and radio power typically measured for NAT radio galaxies (e.g., Feretti & Venturi, 2002).
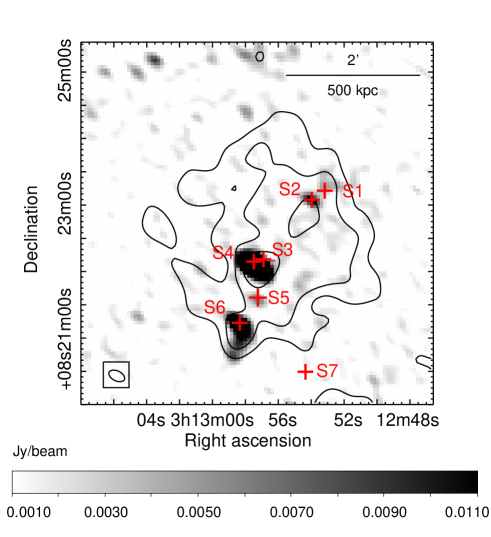
The full resolution GMRT image at 235 MHz is presented in Fig. 2 (grey scale), with the positions of sources S1 to S7 marked by red crosses and labels. Source S7 is not detected at 235 MHz. This is consistent with the fact that the source appears very compact at 610 MHz, so it is probably an active AGN with flat or inverted spectrum. The 235 MHz flux densities of S1, S2, S5 and S6 are reported in Table 3, along with the spectral index computed between 235 MHz and 610 MHz. Sources S1 and S5 are only partially detected at 235 MHz, thus the flux density and spectral indeces in Table 3 should be considered as lower limits. Sources S3 and S4 appear blended together in Fig. 2, therefore it is not possible to measure their individual flux density at 235 MHz. A total of 248.4 mJy is measured for the blend.
| (mJy) | |
|---|---|
| (mJy) | |
| (mJy) | |
| () | |
| (W Hz-1) | |
| Linear size (Mpc) |
4. The giant radio halo
A low-resolution () image at 235 MHz of PLCK171 is presented as contours in Fig. 2, overlaid on the full-resolution image in gray scale. The image shows the residual emission after subtraction of the CLEAN components of sources S1 to S6 from the data. The CLEAN components were obtained from an image produced using only the baselines longer than 3 k, containing information on structures on angular scales . The presence of a large diffuse source filling the central region of the cluster is evident. Its large linear size ( kpc in Fig. 2), roundish morphology and the central cluster location are consistent with the properties of a giant radio halo.
We note that the peaks of the radio halo image in Fig. 2 are approximately coincident with the position of some individual sources. To estimate the possible residual contribution of these sources, we made an image of the halo region from the source-subtracted data set, using only the long baselines ( k). We indeed found some residual emission possibly associated with the blend of S3 and S4 ( mJy) and with S6 ( mJy). This will be taken into account when measuring the flux density and spectral index of the halo in Sect. 5.
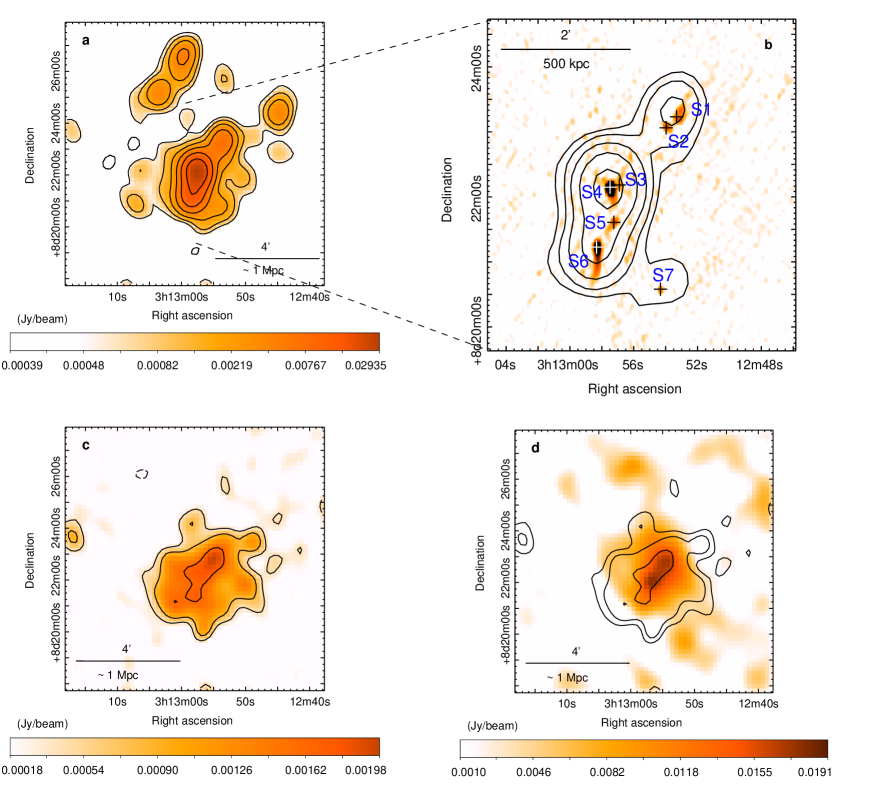
Hints of the halo are already visible on the public NVSS image at 1.4 GHz. To obtain a better quality image of the diffuse source, we re-analyzed the NVSS pointing (see Sect. 2.2). Our 1.4 GHz images are presented in Fig. 3. Panel a shows the total radio emission, i.e. the halo and the radio galaxies. Following the procedure adopted at 235 MHz, we re-derived the image using only the baselines longer than 0.8 k (angular scales ) to identify the contribution of the discrete radio sources in the cluster area. A central region of the resulting image is shown in panel b, with the position of the sources detected at 610 MHz (Fig. 1) highlighted by crosses and labels. Even though the resolution of the two images is very different ( at 610 MHz and at 1.4 GHz), there is a good match between the location of the radio sources at 610 MHz and the structure imaged at 1.4 GHz. The CLEAN components associated with this image were then subtracted from the -data, and the resulting data set was used to obtain an image of just the radio halo, shown in Figure 3c (colors and contours). An overlay of this 1.4 GHz diffuse emission on the GMRT 235 MHz image of the radio halo, convolved with a circular beam of , is shown in Figure 3d. The overall shape of the halo is similar at both frequencies, while its extent is slightly larger at 1.4 GHz ( Mpc). The difference is likely due to the low sensitivity and quality of the 235 MHz observation, which was strongly affected by ionospheric scintillation during most of the observing time (Sect. 2.1).

5. Integrated spectrum of the radio halo
Using the images of the diffuse component alone (Fig. 2 and Fig. 3c), we measured a total flux density of the halo of mJy at 235 MHz333The residual 13 mJy, possibly associated with the individual sources (see Sect. 4), have been added into the error. and mJy at 1.4 GHz in the region defined by the first contour in Fig. 3d (3). These are also reported in Table LABEL:tab:halo, along with the other main observational properties of the halo, and in Fig. 4. The derived total radio power at 1.4 GHz is W Hz-1.
Our flux density values at 235 MHz and 1.4 GHz correspond to a very steep spectral index, , which makes PLCK171 one of the steepest-spectrum giant halos known so far. However, large uncertainties affect our measurement. In particular, it is possible that some of the halo flux density is missed in both the reprocessed NVSS image and the GMRT 235 MHz image due to the short duration of the observations, which results in sparse coverages of the plane and loss of sensitivity to structure. Furthermore, the low resolution of the 1.4 GHz image does not allow an accurate removal of the discrete radio galaxies in the halo region, and, consequently, the halo flux density could be overestimated.
A flux density of 45–50 mJy is measured from low-resolution () images at 610 MHz (not shown here), obtained after the subtraction of the discrete sources. However, these images detect only the brightest peaks of the halo and, therefore, its flux density at this frequency is only a lower limit. The 610 MHz measurement is lower than the value expected based on the spectral index between 235 MHz and 1.4 GHz (Fig. 4). Our experience with the GMRT at 610 MHz suggests that the flux density losses at this frequency can indeed be conspicuous, up to 40 (Venturi et al., 2008; Dallacasa et al., 2009; Macario et al., 2010).
6. X-ray analysis
PLCK171 was observed with XMM-Newton for 14 ks in 2010 August under ObsID 0656201101. The EPIC data were reduced using the Extended Source Analysis Software (XMM-ESAS)444http://heasarc.gsfc.nasa.gov/docs/xmm/xmmhp_xmmesas.html package part of SAS version 11.0.0. For the EPIC MOS detectors, the analysis of galaxy clusters with this software was introduced by Snowden et al. (2008), but the methodology has since been expanded to include the EPIC pn data (e.g., Bulbul et al., 2012, for a more detailed description). In summary, a filtered event list is created by removing periods of excessive count rate in the light curve caused by proton flaring events (retaining 13.7 ks, 13.4 ks, and 8.2 ks of the exposures for the MOS1, MOS2, and pn data, respectively), excluding anomalous MOS CCDs (in this case CCDs 4, 5, and 6 for MOS1), and identifying and excluding point sources. Spectra and images are then extracted, including for the quiescent particle background, which is derived from a database of filter wheel closed observations that are matched to data from the unexposed corners of the chips. The remaining background components (residual soft proton contamination, instrumental lines, solar wind charge exchange (SWCX) emission, and the cosmic fore- and backgrounds from the local hot bubble, the Galaxy, and extragalactic unresolved point sources) are all explicitly modeled and determined empirically when fitting spectra in XSPEC. While robust best fits of these components can be trickier to obtain in shorter exposures such as this one, the smaller angular extent of this cluster provides for a large local background region from which their parameters can be sufficiently constrained.
In this case, nearly all of the cluster emission is taken to fall within a circle of radius; EPIC MOS and pn spectra from this region and the remaining field of view out to (containing only background) are simultaneously fit. We find a global cluster temperature of keV, in good agreement with that reported in Planck Collaboration et al. (2011c) of keV. Our slightly lower temperature likely reflects a different source region and background treatment, and our greater uncertainty is a consequence of treating background components as free parameters. For the image analysis, the best-fit values for the non-cosmic backgrounds (quiescent particle, soft proton, and SWCX) are translated into images and subtracted from the data.
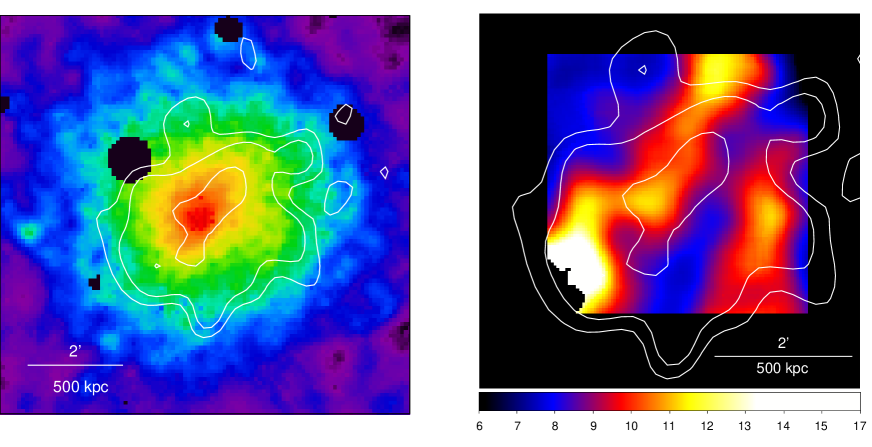
The resulting adaptively smoothed, full band (0.4-7.2 keV) image is presented in Figure 5a with the 1.4 GHz radio halo contours overlaid (same as Fig. 3c). Structurally, the central region is elongated in the North–West/South–East direction with the X-ray peak slightly towards the SE side from the large-scale emission centroid. The radio halo and X-ray surface brightness generally follow each other, as often observed in clusters hosting radio halos. The asymmetric ICM morphology is consistent with a recent merger event.
To investigate the merger state in more detail, we constructed a temperature map using smoothed narrow-band images fitted with the MeKaL plasma model, using a method described in Markevitch et al. (2000). Images are extracted in seven bands (0.4-0.8 keV, 0.8-1.1 keV, 1.1-1.35 keV, 1.9-2.1 keV, 2.35-3.2 keV, 3.2-4.8 keV, and 4.8-7.2 keV) that avoid instrumental lines. A local background, accounting for Galactic and extragalactic non-cluster sources, is estimated from the region outside the cluster in each image and subtracted, after which the image is corrected by vignetting and exposure maps. Using the ESAS task comb, which adjusts each exposure map to the response of the MOS2, medium filter response, the three EPIC instruments are combined to maximize the signal-to-noise before smoothing. The images, with pixels, are variably smoothed by a 10 pixel Gaussian kernel at the image edges, which transitions to a pixel kernel inversely following the wide band surface brightness to the 0.2 power. Chip and point source gaps are interpolated over (for purely cosmetic purposes). Then, an absorbed MeKaL model with fixed absorption ( cm-2), abundance (0.3 solar), and redshift (0.27) is fit to the coarse spectrum in the seven energy bins corresponding to each pixel. The resulting best-fit temperatures are shown in Figure 5b, which have 1-sigma errors on the order of 1 keV in the center and keV near the edge.
The general picture that emerges is a roughly isothermal central region, without a central cool core and with a slight, but only marginally significant, temperature peak ( keV) coincident with the X-ray peak. The temperature peak extends in the same direction, but more narrowly, as does the broad band surface brightness. This elongation follows that evident in the core of the radio halo, suggesting a merger along the NW-SE axis. The temperature of the cooler region to the SW of the X-ray peak ( keV) deviates from the temperatures along the NW-SE axis at the 2.3 level and is confirmed in direct spectral fits. Deeper X-ray observations are necessary to discern exactly what this feature is and its relationship to the merger.
7. Discussion
The Planck mission has discovered several new clusters using the SZ signal. These systems were not detected from the all sky X-ray surveys, such as the ROSAT All Sky Survey, because of their low surface brightness and being near the flux limit of the surveys. The newly discovered Planck clusters are mostly massive systems with highly disturbed ICM. With the current knowledge of the connection between cluster mergers and the presence of giant radio halos (Cassano et al., 2010, and references therein; see also Rossetti et al. (2011)), these new clusters are excellent targets for searching for new halos. In this paper, we reported the discovery of the first giant radio halo in these new Planck clusters – in PLCK171 – based on GMRT observations at 235 MHz and 610 MHz and re-analysis of the VLA 1.4 GHz NVSS data.
The diffuse halo is 1 Mpc in extent and is cospatial with the brightest X-ray emission, as typically observed in radio-halo clusters (e.g., Govoni et al., 2004; Venturi et al., 2013). The spectral index of the halo between 235 MHz and 1400 MHz is quite steep, . This is one of the steepest slopes measured for a giant radio halo so far – in fact, it is similar to of the prototype USSRH in A 521 (Dallacasa et al., 2009). However, the spectral index of the PLCK171 halo is affected by large uncertainties. In particular, due to the short usable time of our 235 MHz observation and short integration time of the NVSS pointing, it is possible that the halo extends more than imaged here, and a fraction of its flux density is missed at both frequencies. Moreover, the low resolution of the 1.4 GHz image does not allow an accurate subtraction of the discrete radio galaxies enclosed in the halo emission. Therefore, deeper observations at 1.4 GHz with higher angular resolution, and deeper exposures at lower frequencies are essential before any conclusive interpretation of the spectral index of this halo can be made. If future observations confirm its steep radio spectrum, PLCK171 would be another important case of USSRH (of which only a few other examples are known so far; e.g., Brunetti et al. 2008, Macario et al. 2010, van Weeren et al. 2011, and a candidate in Giacintucci et al. 2011), whose study is crucial to understand the physics behind the origin of radio halos in general. While such objects are expected in turbulent reacceleration models, the existence of halos with poses serious problems for secondary models due to the required large energy in cosmic ray protons (Brunetti et al. 2008, Macario et al. 2010, van Weeren et al. 2011). Such energies are above the current upper limits from the -ray observations of nearby clusters (Aharonian et al. 2009, Ackermann et al. 2010, Jeltema & Profumo 2011), assuming the G cluster magnetic field values indicated by Farady rotation measure studies (e.g., Bonafede et al. 2010 and references therein).
The analysis of the X-ray XMM-Newton observation of PLCK171 reveals high temperature ( keV) and signatures of a recent merger in both the surface brightness and gas temperature distributions. A NW-SE elongation of the central X-ray emission, coupled with a similar structure in the temperature map, suggests that the merger occurred along this axis. The radio halo displays a similar asymmetry in its central region, suggesting a correlation between the thermal and non-thermal emissions, as typically observed in radio-halo clusters.
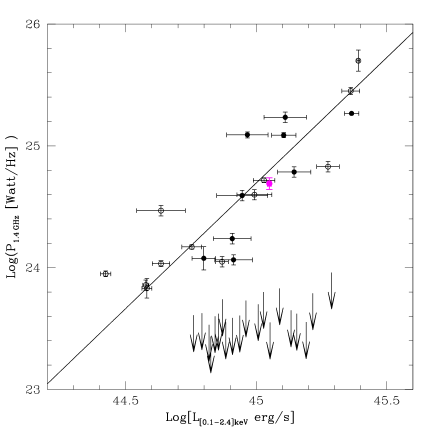
Figure 6 shows the distribution of the clusters of the GMRT radio-halo survey (Venturi et al. 2007, 2008), along with other radio-halo clusters from the literature, in the – plane (from Brunetti et al. 2009). The bimodality evident in this diagram (with some clusters lacking diffuse radio emission, while those that exhibit radio halos follow a correlation) is one of the main outcomes of the GMRT radio-halo survey and provides quantitative support to reacceleration models for the origin of radio halos (Brunetti et al. 2007, 2009). The separation between clusters hosting a radio halo and those without (upper limits) is most likely caused by the different dynamical properties of the clusters: clusters without a radio halo tend to be more relaxed systems, while radio halos are exclusively found in disturbed clusters (Cassano et al. 2010).
PLCK171 (magenta symbol) falls on the radio halo correlation. Furthermore, our X-ray analysis shows that the cluster is unrelaxed, as expected for a system hosting a radio halo. Ongoing dynamical activity in PLCK171 is also suggested by the presence of four NATs in its central Mpc region, with tails pointing away from the cluster center, suggesting infall of multiple subctructures onto the main cluster and bulk motions of the ICM driven by the ongoing merger (e.g., Bliton et al. 1998). Thus, the radio halo in PLCK171 provides further support to the existence of a direct link between the radio halo phenomenon and cluster mergers.
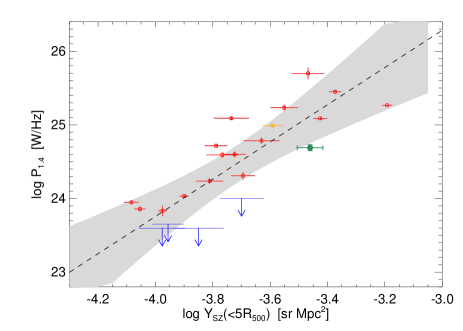
A scaling relation between the radio power at 1.4 GHz and the integrated SZ effect measurement (Y) has been recently presented by Basu (2012). Such a relation is a direct probe of the connection between the mass of the cluster and presence of a radio halo. In Fig. 7 we report the position PLCK171 in the - plane using the integrated Y published in Planck Collaboration et al. (2011c). PLCK171 (green square) follows the scaling relation obtained for the other radio-halo clusters.
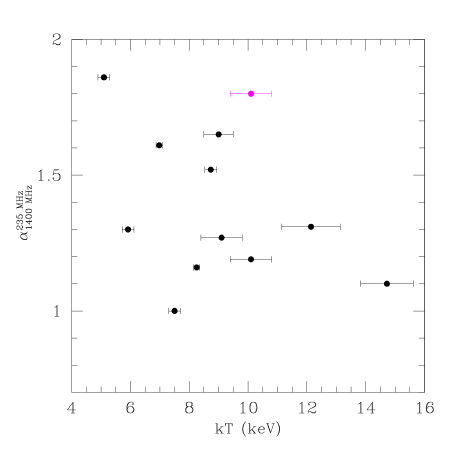
What is unusual about PLCK171 is its combination of high gas temperature ( keV) and ultra-steep spectrum of its radio halo (, with the caveats given above). If the steep spectrum is confirmed, it would be the hottest cluster with a USSRH – all other USSRHs have keV, as visible in Fig. 8, that reports the distribution of radio-halo clusters in the plane adapted from Venturi et al. (2013). The magenta point marks the position of PLCK171 using keV, as measured in Sect. 6. Thus, this object may provide an important data point for our understanding of giant radio halos in clusters.
8. Conclusions
We have discovered a Mpc-size radio halo in PLCK171, using GMRT observations at 235 MHz and 610 MHz and re-analysis of NVSS 1.4 GHz data. This is the first giant radio halo found in the new clusters discovered by Planck.
With a spectral index , this source might be another system with a very steep radio spectrum, so far found in only a few other clusters. However, deeper multi-frequency observations are required before any definitive interpretation of the spectral index of this radio halo.
The X-ray luminosity of the cluster and radio power of the halo at 1.4 GHz are consistent with the correlation known to be followed by radio-halo clusters. Its location in the - plane also follows the scaling relation found for clusters with radio halos. The asymmetries observed in the X-ray surface brightness and temperaure distributions, derived from the XMM data, indicate a disturbed ICM resulting from a recent merger. This is in line with the expectation that giant radio halos are exclusively associated with cluster mergers.
With an X-ray luminosity of 1.13 erg s-1 and a redshift of , PLCK171 represents the kind of clusters that have been missed in X-ray flux limited surveys, such as the Rosat All Sky Survey, and, consequently, in radio surveys based on X-ray selection criteria, such as the GMRT radio-halo survey (Venturi et al. 2007, 2008). It is therefore important to consider biases due to clusters such as PLCK171 in X-ray flux limited samples selected for radio surveys.
References
- Ackermann et al. (2010) Ackermann, M., Ajello, M., Allafort, A., et al. 2010, ApJ, 717, L71
- Aharonian et al. (2009) Aharonian, F., Akhperjanian, A. G., Anton, G., et al. 2009, A&A, 502, 437
- Baars et al. (1977) Baars, J. W. M., Genzel, R., Pauliny-Toth, I. I. K., & Witzel, A. 1977, A&A, 61, 99
- Bagchi et al. (2011) Bagchi, J., Sirothia, S. K., Werner, N., et al. 2011, ApJ, 736, L8
- Basu (2012) Basu, K. 2012, MNRAS, 421, L112
- Blasi & Colafrancesco (1999) Blasi, P., & Colafrancesco, S., 1999, APh, 12, 169
- Bliton et al. (1998) Bliton, M., Rizza, E., Burns, J. O., Owen, F. N., & Ledlow, M. J. 1998, MNRAS, 301, 609
- Bonafede et al. (2012) Bonafede, A., Brüggen, M., van Weeren, R., et al. 2012, MNRAS, 426, 40
- Brown & Rudnick (2011) Brown, S., & Rudnick, L. 2011, MNRAS, 412, 2
- Brunetti et al. (2007) Brunetti, G., Venturi, T., Dallacasa, D., et al. 2007, ApJ, 670, L5
- Brunetti et al. (2008) Brunetti, G., et al. 2008, Nature, 455, 944
- Brunetti et al. (2009) Brunetti, G., Cassano, R., Dolag, K., & Setti, G. 2009, A&A, 507, 661
- Brunetti (2011) Brunetti, G. 2011, Journal of Astrophysics and Astronomy, 32, 437
- Brunetti et al. (2012) Brunetti, G., Blasi, P., Reimer, O., et al. 2012, MNRAS, 426, 956
- Bulbul et al. (2012) Bulbul, G. E., Smith, R. K., Foster, A., et al. 2012, ApJ, 747, 32
- Cassano et al. (2010) Cassano, R., Ettori, S., Giacintucci, S., Brunetti, G., Markevitch, M., Venturi, T., & Gitti, M. 2010, ApJ, 721, L82
- Chandra et al. (2004) Chandra, P., Ray, A., & Bhatnagar, S. 2004, ApJ, 612, 974
- Clarke & Ensslin (2006) Clarke, T. E., & Ensslin, T. A. 2006, AJ, 131, 2900
- Condon et al. (1998) Condon, J. J., Cotton, W. D., Greisen, E. W., et al. 1998, AJ, 115, 1693
- Dallacasa et al. (2009) Dallacasa, D., Brunetti, G., Giacintucci, S., et al. 2009, ApJ, 699, 1288
- Dennison (1980) Dennison, B. 1980, ApJ, 239, L93
- Donnert et al. (2010) Donnert, J., Dolag, K., Cassano, R., & Brunetti, G. 2010, MNRAS, 407, 1565
- Ensslin et al. (1998) Ensslin, T., A., Biermann, P. L., Klein, U., Kohle, S., 1998, A&A, 332, 395
- Enßlin et al. (2011) Enßlin, T., Pfrommer, C., Miniati, F., & Subramanian, K. 2011, A&A, 527, A99
- Ferrari et al. (2008) Ferrari, C., Govoni, F., Schindler, S., Bykov, A. M., & Rephaeli, Y. 2008, SSRv 134, 93
- Feretti & Venturi (2002) Feretti, L., & Venturi, T. 2002, Merging Processes in Galaxy Clusters, 272, 163
- Feretti et al. (2012) Feretti, L., Giovannini, G., Govoni, F., & Murgia, M. 2012, A&A Rev., 20, 54
- Giacintucci et al. (2011) Giacintucci, S., Dallacasa, D., Venturi, T., et al. 2011, A&A, 534, A57
- Giovannini et al. (1999) Giovannini, G., Tordi, M., & Feretti, L. 1999, NewA, 4, 141
- Giovannini et al. (2009) Giovannini, G., Bonafede, A., Feretti, L., et al. 2009, A&A, 507, 1257
- Govoni et al. (2004) Govoni, F., Markevitch, M., Vikhlinin, A., et al. 2004, ApJ, 605, 695
- Greisen et al. (2009) Greisen, E. W., Spekkens, K., & van Moorsel, G. A. 2009, AJ, 137, 4718
- Hoeft & Brüggen (2007) Hoeft, M., & Brüggen, M., 2007, MNRAS, 375, 77
- Jeltema & Profumo (2011) Jeltema, T. E., & Profumo, S. 2011, ApJ, 728, 53
- Kale & Dwarakanath (2010) Kale, R., & Dwarakanath, K. S., 2010, ApJ, 718, 939
- Kale & Dwarakanath (2012) Kale, R., & Dwarakanath, K. S., 2012, ApJ, 744, 46
- Kang & Ryu (2011) Kang, H., & Ryu, D., 2011, ApJ, 734, 18
- Kang et al. (2012) Kang, H., Ryu, D., & Jones, T. W. 2012, ApJ, 756, 97
- Kempner & Sarazin (2001) Kempner, J. C., & Sarazin, C. L. 2001, ApJ, 548, 639
- Keshet & Loeb (2010) Keshet, U., & Loeb, A. 2010, ApJ, 722, 737
- Macario et al. (2010) Macario, G., Venturi, T., Brunetti, G., et al. 2010, A&A, 517, A43
- Macario et al. (2013) Macario, G., Venturi, T., Intema, H. T., et al. 2013, A&A, 551, 141
- Markevitch et al. (2000) Markevitch, M., Ponman, T. J., Nulsen, P. E. J., et al. 2000, ApJ, 541, 542
- Markevitch et al. (2005) Markevitch, M., Govoni, F., Brunetti, G., Jerius, D., 2005, ApJ, 627, 733
- Pfrommer & Enßlin (2004) Pfrommer, C., & Enßlin, T. A. 2004, Journal of Korean Astronomical Society, 37, 455
- Planck Collaboration et al. (2011a) Planck Collaboration, Ade, P. A. R., Aghanim, N., et al. 2011, A&A, 536, A1 (a)
- Planck Collaboration et al. (2011b) Planck Collaboration, Ade, P. A. R., Aghanim, N., et al. 2011, A&A, 536, A8 (b)
- Planck Collaboration et al. (2011c) Planck Collaboration, Aghanim, N., Arnaud, M., et al. 2011, A&A, 536, A9 (c)
- Planck Collaboration et al. (2012a) Planck Collaboration, Aghanim, N., Arnaud, M., et al. 2012, A&A, 543, A102 (d)
- Planck Collaboration et al. (2012b) Planck Collaboration, Ade, P. A. R., Aghanim, N., et al. 2012, arXiv:1205.3376 (e)
- Rossetti et al. (2011) Rossetti, M., Eckert, D., Cavalleri, B. M., et al. 2011, A&A, 532, A123
- Roy et al. (2010) Roy, J., Gupta, Y., Pen, U., Peterson, J. B., Kudale, S., Kodilkar, J., 2010, ExA, 28, 25
- Snowden et al. (2008) Snowden, S. L., Mushotzky, R. F., Kuntz, K. D., & Davis, D. S. 2008, A&A, 478, 615
- Sunyaev & Zeldovich (1972) Sunyaev, R. A., & Zeldovich, Y. B. 1972, Comments on Astrophysics and Space Physics, 4, 173
- van Weeren et al. (2009) van Weeren, R. J., Röttgering, H. J. A., Brüggen, M., Cohen, A., 2009, A&A, 508, 75
- van Weeren et al. (2011) van Weeren, R. J., Brüggen, M., Röttgering, H. J. A., et al. 2011, A&A, 533, A35
- van Weeren (2011) van Weeren, R. J., 2011, PhDT, 14
- van Weeren et al. (2012) van Weeren, R. J., Bonafede, A., Ebeling, H., et al. 2012, MNRAS, 425, L36
- Venturi et al. (2007) Venturi, T., Giacintucci, S., Brunetti, G., et al. 2007, A&A, 463, 937
- Venturi et al. (2008) Venturi, T., Giacintucci, S., Dallacasa, D., et al. 2008, A&A, 484, 327
- Venturi (2011) Venturi, T. 2011, Mem. Soc. Astron. Italiana, 82, 499
- Venturi et al. (2013) Venturi, T., Giacintucci, S., Dallacasa, D., et al. 2013, A&A, 551, 24