Spectropolarimetry of the Type Ia Supernova 2012fr††thanks: Based on observations made with ESO Telescopes at the Paranal Observatory, under program 290.D-5009 and 290.D-5006.
Abstract
Spectropolarimetry provides the means to probe the 3D geometries of Supernovae at early times. We report spectropolarimetric observations of the Type Ia Supernova 2012fr at four epochs: -11, -5, +2 and +24 days, with respect to -lightcurve maximum. SN 2012fr is a normal Type Ia SN, similar to SNe 1990N, 2000cx and 2005hj (that all exhibit low velocity decline rates for the principal Si ii line). The SN displays high velocity components at -11 days that are highly polarized. The polarization of these features decreases as they become weaker from -5 days. At +2 days, the polarization angles of the low velocity components of silicon and calcium are identical and oriented at relative to the high velocity Ca component. In addition to having very different velocities, the high and low velocity Ca components have orthogonal distributions in the plane of the sky. The continuum polarization for the SN at all four epochs is low . We conclude that the low level of continuum polarization is inconsistent with the merger-induced explosion scenario. The simple axial symmetry evident from the polarization angles of the high velocity and low velocity Ca components, along with the presence of high velocity components of Si and Ca, is perhaps more consistent with the pulsating delayed detonation model. We predict that, during the nebular phase, SN 2012fr will display blue-shifted emission lines of Fe-group elements.
keywords:
supernovae:general – supernovae:individual:2012fr1 Introduction
Type Ia Supernovae (SNe) are energetic events resulting from the thermonuclear explosions of carbon-oxygen Chandrasekhar mass white dwarfs (WDs), in either single or double degenerate progenitor systems (?). The exact nature of the explosion mechanism behind Type Ia SNe is unknown, but a number of theoretical models have been proposed: deflagrations (??), detonations (?), delayed detonations (?), pulsating delayed detonations (??) or the mergers of two WDs (??). A key differentiating factor between these different models, with different physical considerations, is the geometry of the resulting explosion. Spectropolarimetry permits the direct observation of the 3D geometries of SN explosions and provides, therefore, a direct probe of the underlying physics behind these explosions (for a review, see ?).
In general, Type Ia SNe are characterized by low levels of polarization, that decrease as time and the depth into the ejecta increase. Previous studies have shown that photometric and spectroscopic properties of Type Ia SNe are intimately tied to the geometry of these events, through the correlation of the polarization (specifically of the Si ii feature ) with the lightcurve decline parameter (?) and the decline rate of the velocity at the absorption minimum (?).
Here we report early spectropolarimetric observations of the Type Ia SN 2012fr. SN 2012fr was discovered by ?) on 2012 Oct 27.05 (UT) in the galaxy NGC 1365 ( East and North of the nucleus). Based on previous observations of NGC 1365, the SN was discovered d post-explosion (?). ?) and ?) spectroscopically classified SN 2012fr as being a normal Type Ia SN. The heliocentric recessional velocity for NGC 1365111Quoted from the NASA/IPAC Extragalactic Database - http://ned.ipac.caltech.edu is . Contreras et al. (2013, in prep.) report that the B-band light curve maximum occurred at 2012 Nov 12.04 and measured .
2 Observations and Data Reduction
Spectropolarimetric observations of SN 2012fr were conducted using the European Southern Observatory (ESO) Very Large Telescope (VLT) Antu Unit Telescope and the Focal Reducer and low dispersion Spectrograph (FORS; ?). The observations were made at four separate epochs, and a log of the observations is presented in Table 1. The data were acquired using the grism and order separation filter (to prevent second order contamination in the red portion of the spectrum), providing a wavelength range of with resolution at . At the +2d, observations were conducted with both the half-wavelength and quarter wavelength retarder plates, to measure the linear ( and ) and circular () Stokes parameters, respectively. The data were reduced using IRAF222IRAF is distributed by the National Optical Astronomy Observatory, which is operated by the Association of Universities for Research in Astronomy (AURA) under cooperative agreement with the National Science Foundation. following the method presented by ?). The reduction procedure was identical for observations conducted with half- and quarter-wavelength retarder plates. Flux spectra of the target SN were calibrated using observations of a flux standard acquired with the polarimetry optics in place. The Stokes parameters were rebinned to , slightly larger than one resolution element, to increase the level of signal to noise.
| Object | Date | Exposure | Mean | Epoch⋆ |
|---|---|---|---|---|
| (UT) | (s) | Airmass | (days) | |
| SN 2012fr | 2012 Nov 1.07 | 1.56 | -11 | |
| LTT1020‡ | 2012 Nov 7.06 | 1.20 | ||
| SN 2012fr | 2012 Nov 7.24 | 1.03 | -5 | |
| LTT1020†‡ | 2012 Nov 14.19 | 1.09 | ||
| LTT1020‡ | 2012 Nov 14.19 | 1.08 | ||
| SN 2012fr | 2012 Nov 14.22 | 1.03 | +2 | |
| SN 2012fr | 2012 Nov 14.23 | 1.04 | +2 | |
| SN 2012fr† | 2012 Nov 14.23 | 1.04 | +2 | |
| SN 2012fr | 2012 Dec 06.31 | 2.02 | ||
| G94-48‡ | 2012 Dec 07.01 | 1.49 | +24 |
⋆ Relative to the maximum of the -band lightcurve on 2012 Nov 12.04
† Observations conducted with the quarter wavelength retarder plate.
‡ Flux standard.
3 Results
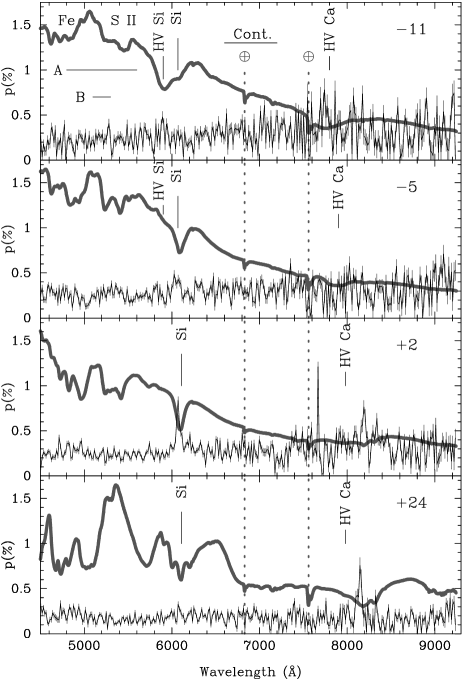
The polarization and flux spectra for SN 2012fr at the four observational epochs are presented in Figure 1. We compared the flux spectra at each epoch with those of other Type Ia SNe using GELATO333http://gelato.tng.iac.es/(?).The first two flux spectra appear similar to SN 1990N at -13 and -7d (relative to -band maximum; ?) and to the “Branch normal” SN 2005hj (?); whilst the later spectra appear similar to 2000cx (?).
At the first epoch, the Si ii line is composed of two separate absorption components, a high velocity (HV) component at and a low velocity (LV) component at . In the later epochs, Si ii is dominated by the narrow LV component, although HV absorption is discernible at the second epoch. Based on the measured decline of the velocity of the Si ii LV component over the four epochs (), SN 2012fr is a member of the Low Velocity Gradient (LVG) group of Type Ia SNe (?). The HV component of Si ii appears detached from the LV component, and we find the velocity at the blue edge of the absorption trough at -11d is the same as the velocity measured at absorption minimum for the Ca ii Infrared Triplet (IR3), as observed by ?) in spectra of SN 2005hj.
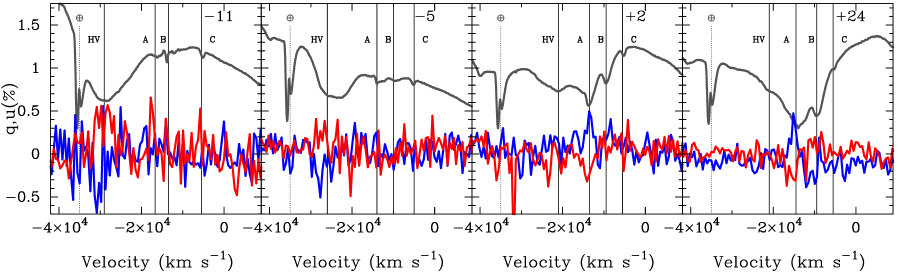
At the first two epochs, the Ca ii IR3 profile (shown in Figure 2) displays a significant HV component ( and , for the first and second epochs respectively), with three weaker LV components (labeled A, B and C in Fig. 2). The HV component appears in the last two epochs, but as a much weaker absorption, while the strongest absorption arises from the “A” LV component. At +2d, we measure velocities of the three LV components to be , and , relative to Ca ii , respectively. The “saw tooth” pattern of absorption components (+2d) is similar to that observed for SN 2000cx at +7d post-maximum (?). We suggest that the LV components arise from the partially resolved individual lines of which the IR3 is composed.
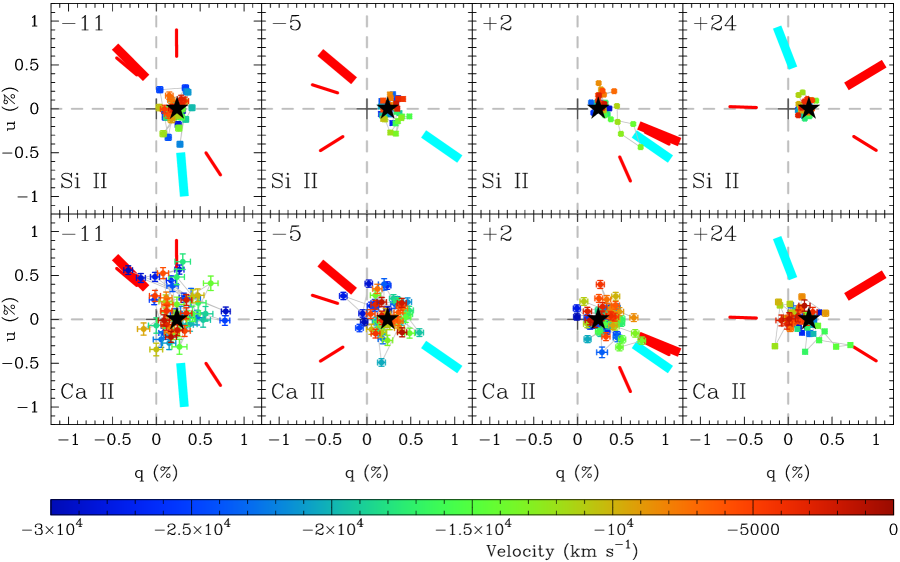
At each epoch the polarization spectrum is characterized by a relatively low level of polarization . Although peaks in the polarization spectra may be associated with the blue Fe lines and the S ii absorption features (), the most significantly polarized features are the Si ii and Ca ii IR3 lines. At the first two epochs, the apparent rise in polarization at longer wavelengths coincides with the increasing uncertainty on the polarization commensurate with the decreasing signal-to-noise. The apparent polarization at is due to the significant telluric absorption around that wavelength and is not intrinsic to the SN. On the Stokes plane (see Figure 3), the data at all epochs are characterized by a central concentration of points, with significant departures at wavelengths associated with Si ii and Ca ii features.
Stokes was measured at to be , consistent with there being no circular polarization over the entire wavelength range; as was the case with the previous reported broad-band polarimetric measurement of the Type I SN 1972E (?) and spectropolarimetry of Type Ia SN 1983J (?). The equipment used for the observations made of SN 1972E, one month after maximum light, is not identified. SN 1983J was observed around maximum light with a 4-m telescope and no solid-state detector. Our VLT CCD data for SN 2012fr, at maximum light, should set the tightest limits to date on circular polarization of any Type Ia SN (or even yield a marginal detection). We will pursue this in a separate study.
4 Analysis
The correct interpretation of the intrinsic polarization of SNe requires the removal of the interstellar polarization (ISP). We estimated the degree of the ISP directly from the observations, under the assumption that regions of the SN spectra are intrinsically unpolarized due to line blanketing of Fe lines (????). We identify two regions in the spectrum of SN 2012fr that are likely to be intrinsically depolarized due to multiple overlapping Fe lines at the first three epochs: regions A () and B (), as shown in Fig. 1. At +24d it is apparent that lines in these regions have ceased to be blended and we see strong individual line profiles, so it was not included in the determination of the ISP. The weighted average Stokes parameters over these wavelength ranges were used as a measure of the ISP: , and ,. These correspond to and , roughly aligned with the position angle of SN 2012fr with respect to the nucleus of NGC 1365.
Under the assumption that the wavelength region is representative of the continuum (?), we the weighted average continuum polarization (after correction for the ISP) to be: , , and at -11, -5, +2 and +24d respectively, consistent with null polarization. The low level of continuum polarization is consistent with a spherical photosphere (with axial ratio ; ?). After correction for the ISP, the only lines remaining with significant polarization are the Si ii and Ca ii IR3 lines.
At -11d, the polarization signal associated with Si ii is dominated by the HV component at , but as the optical depth of this component decreases we no longer observe it to be polarized by -5d; whilst the polarization signal of the LV component increases. On the Stokes plane (see Figure 3), the polarization signals of the HV component (observed at -11d) and the LV component (at -5d) are found to be separated by (which is evidence that the HV and LV components are physically separated, both in radial velocity and on the sky). Although the degree of polarization of the LV component increases from (at -5d) to (at +2d), the polarization angle remains the same, implying that the LV Si ii line forming region is a single continuous region covering the photosphere. At +24d, we measure a reduced level of polarization of associated with the now weaker Si ii absorption, accompanied by a rotation of the polarization angle through .
At the first epoch, the HV component of Ca ii shows the largest polarization of ; by -5d the degree of polarization decreases to (see Figure 2). At +2d, the polarization signal associated with Ca ii is dominated by the LV component with (specifically the absorption “A” in Fig. 2). From Fig. 2 it is clear that the Stokes parameters associated with the HV component at earlier epochs are inverted with respect to the Stokes parameters of the LV components observed late (i.e. the signs of Stokes and parameters for the HV component are opposite to those of the LV component); this is also visible as a rotation of the polarization angle of the Ca ii features on Fig. 3. This implies that the HV and LV components arise from line forming regions that are not only kinematically distinct, but also orthogonal to each other on the plane of the sky. At +2 and +24d, the polarization angles of the strong Ca ii absorption (arising from the LV component) are aligned with the highly polarized Si ii feature observed at +2d, suggesting a common line forming region; however, the velocities of the LV Ca ii components are lower and decline faster than for Si ii . At +24d, the polarization signal at the wavelength of the HV component is dominated by the polarization of the underlying LV component.
5 Discussion & Conclusions
We have presented early spectropolarimetric observations of the Type Ia SN 2012fr; finding the degree of polarization to be generally low, except for significant line polarization associated with Si ii and Ca ii. At early times we see evidence for kinematically distinct HV components, which weaken significantly by +2d. Simultaneously, the strength of the LV components increases and their respective polarizations also increase, but at different polarization angles than the HV components. The low decline rate of the LV Si ii velocity and the degree of polarization measured for the line at -5d adheres closely to the relationship established by ?) (see their Figure 1) between these two parameters; and closely matches the values measured for the 1991T-like SN 1997br (??). The degree of Si ii polarization and the measured also follows the correlation found by ?). In comparison with the ? sample, SN 2012fr is the only SN with that also exhibits low and belongs to the LVG group. Based on the previous correlation established between Si ii polarization and the characteristics of the late-time nebular spectrum (??), we predict that the profiles of lines of Fe-group elements in the nebular spectrum of SN 2012fr will exhibit a blue shift.
The presence of short lived HV Ca ii IR3 components in the spectra of Type Ia SNe is not unusual. ?) modeled this feature, in SN 2003du, as arising from a low mass () shell of primordial material from the circumstellar medium. Both HV Si ii and Ca ii were observed in the spectra of SN 2005hj (?). The presence of these two features in a similar velocity space demands the presence of a large mass of SN processed material at high velocities, leading ? to suggest an explosive origin for the shell through pulsating delayed detonations (PDDs; ??) or mergers. The 3D signatures of these mechanisms, however, will be very different. Approximate spherical symmetry is expected to be maintained in the PDD model (although this must be verified with multidimensional simulations), but large scale asymmetries are expected in mergers. The overall low level of continuum polarization observed for SN 2012fr, however, is inconsistent with the asymmetric nickel distributions predicted by ?) for violent mergers. The apparent orthogonality of the line forming regions for the HV and LV Ca ii components observed for SN 2012fr, on the plane of the sky, is evidence for a simple axial symmetry. We also note that the slow rise time of the light curve of SN 2012fr and the low decline rate of the Si ii velocity are consistent with the predictions of the PDD model (??).
The spectroscopic and photometric similarities between the low , low SNe, such as 1990N, 2000cx and 2005hj, with SN 2012fr, suggest that these events may be similar events observed at similar orientations (possibly consistent with the PDD model).
Acknowledgments
We thank the ESO Director General for awarding discretionary time for the observations and the observers at Paranal for conducting such exquisite observations. We thank Carlos Contreras and Jeffery Silverman for early notification of the results of their photometric monitoring of SN 2012fr. The research of JRM is supported through a Royal Society University Research Fellowship. The work of JCW is supported in part by NSF Grant AST-1109801. AC & PZ acknowledge support from Iniciativa Cientifica Milenio (MINECON, Chile) through the Millennium Center for Supernova Science (P10-064-F) and Basal grant CATA PFB 06/09 from CONICYT, Chile.
Bibliography
- Appenzeller I., Fricke K., Furtig W., Gassler W., Hafner R., Harkl R., Hess H.-J., Hummel W., et al. 1998, The Messenger, 94, 1
- Arnett W. D., 1969, Ap&SS, 5, 180
- Benetti S., Cappellaro E., Mazzali P. A., Turatto M., Altavilla G., Bufano F., Elias-Rosa N., Kotak R., Pignata G., Salvo M., Stanishev V., 2005, ApJ, 623, 1011
- Branch D., Livio M., Yungelson L. R., Boffi F. R., Baron E., 1995, PASP, 107, 1019
- Buil C., 2012, Central Bureau Electronic Telegrams, 3277, 3
- Childress M., Zhou G., Tucker B., Bayliss D., Scalzo R., Yuan F., Schmidt B., 2012, Central Bureau Electronic Telegrams, 3277, 2
- Chornock R., Filippenko A. V., Branch D., Foley R. J., Jha S., Li W., 2006, PASP, 118, 722
- Gamezo V. N., Khokhlov A. M., Oran E. S., 2004, Physical Review Letters, 92, 211102
- Gerardy C. L., Höflich P., Fesen R. A., Marion G. H., Nomoto K., Quimby R., Schaefer B. E., Wang L., Wheeler J. C., 2004, ApJ, 607, 391
- Harutyunyan A. H., Pfahler P., Pastorello A., Taubenberger S., Turatto M., Cappellaro E., Benetti S., Elias-Rosa N., Navasardyan H., Valenti S., Stanishev V., Patat F., Riello M., Pignata G., Hillebrandt W., 2008, A&A, 488, 383
- Hoeflich P., Khokhlov A., 1996, ApJ, 457, 500
- Höflich P., 1991, A&A, 246, 481
- Howell D. A., Höflich P., Wang L., Wheeler J. C., 2001, ApJ, 556, 302
- Khokhlov A., Mueller E., Hoeflich P., 1993, A&A, 270, 223
- Khokhlov A. M., 1991a, A&A, 245, 114
- Khokhlov A. M., 1991b, A&A, 245, L25
- Klotz A., Normand J., Conseil E., Parker S., Fabrega J., Maury A., 2012, Central Bureau Electronic Telegrams, 3277, 1
- Leibundgut B., Kirshner R. P., Filippenko A. V., Shields J. C., Foltz C. B., Phillips M. M., Sonneborn G., 1991, ApJL, 371, L23
- Li W., Filippenko A. V., Gates E., Chornock R., Gal-Yam A., Ofek E. O., Leonard D. C., Modjaz M., Rich R. M., Riess A. G., Treffers R. R., 2001, PASP, 113, 1178
- Li W. D., Qiu Y. L., Qiao Q. Y., Zhu X. H., Hu J. Y., Richmond M. W., Filippenko A. V., Treffers R. R., Peng C. Y., Leonard D. C., 1999, AJ, 117, 2709
- Maeda K., Benetti S., Stritzinger M., Röpke F. K., Folatelli G., Sollerman J., Taubenberger S., Nomoto K., Leloudas G., Hamuy M., Tanaka M., Mazzali P. A., Elias-Rosa N., 2010, Nature, 466, 82
- Maund J., Wheeler J., Patat F., Baade D., Wang L., Höflich P., 2007, MNRAS, 381, 201
- Maund J. R., Höflich P., Patat F., Wheeler J. C., Zelaya P., Baade D., Wang L., Clocchiatti A., Quinn J., 2010, ApJL, 725, L167
- Maund J. R., Wheeler J. C., Wang L., Baade D., Clocchiatti A., Patat F., Höflich P., Quinn J., Zelaya P., 2010, ApJ, 722, 1162
- McCall M. L., Reid N., Bessell M. S., Wickramasinghe D., 1984, MNRAS, 210, 839
- Pakmor R., Kromer M., Taubenberger S., Sim S. A., Röpke F. K., Hillebrandt W., 2012, ApJL, 747, L10
- Patat F., Baade D., Höflich P., Maund J. R., Wang L., Wheeler J. C., 2009, A&A, 508, 229
- Quimby R., Höflich P., Wheeler J. C., 2007, ApJ, 666, 1083
- Röpke F. K., Gieseler M., Reinecke M., Travaglio C., Hillebrandt W., 2006, A&A, 453, 203
- Wang L., Baade D., Patat F., 2007, Science, 315, 212
- Wang L., Wheeler J. C., 2008, ARAA, 46, 433
- Webbink R. F., 1984, ApJ, 277, 355
- Wolstencroft R. D., Kemp J. C., 1972, Nature, 238, 452