XMM-Newton/RGS Detection of the Missing Interstellar OVII K Absorption Line in the Spectrum of Cyg X-2
Abstract
The hot interstellar medium is an important part of the Galactic ecosystem and can be effectively characterized through X-ray absorption line spectroscopy. However, in a study of the hot medium using the accreting neutron star X-ray binary, Cyg X-2, as a background light source, a mystery came about when the putatively strong O VII K line was not detected in Chandra grating observations, while other normally weaker lines such as O VII K as well as O VI and O VIII K are clearly present (Yao et al. 2009). We have investigated the grating spectra of Cyg X-2 from 10 XMM-Newton observations, in search of the missing line. We detect it consistently in nine of these observations, but the line is absent in the remaining one observation or is inconsistent with the detection in others at a confidence level. This absence of the line resembles that seen in the Chandra observations. Similarly, the O VI K line is found to disappear occasionally, but not in concert with the variation of the O VII K line. All these variations are most likely due to the presence of changing O VII and O VI K emission lines of Cyg X-2, which are blurred together with the absorption ones in the X-ray spectra. A re-examination of the Chandra grating data indeed shows evidence for a narrow emission line slightly off the O VI K absorption line. We further show that narrow N V emission lines with varying centroids and fluxes are present in far-UV spectra from the Cosmic Origins Spectrograph aboard the Hubble Space Telescope. These results provide new constraints on the accretion around the neutron star and on the X-ray-heating of the stellar companion. The understanding of these physical processes is also important to the fidelity of using such local X-ray binaries for interstellar absorption line spectroscopy.
keywords:
X-rays: individual: Cyg X-2, X-Rays: ISM1 INTRODUCTION
Diffuse hot gas is an important, yet probably the least understood component of the interstellar medium (ISM) in and around the Milky Way (e.g., Wang 2010; Putman et al. 2012 and references therein). The hot ISM has been proposed to account for much of the missing baryon matter within the Galactic halo and traces energetic feedback from stars, which shapes the ecosystem of the Galaxy. However, little is actually known observationally about the kinematic, chemical and spatial properties, as well as the content of the hot ISM. It has been chiefly studied in its emission, which carries little distance information and is subject to absorption by cool gas – an effect that is often difficult to quantify. In the past several years, however, it has been demonstrated that the hot ISM can be effectively characterized through X-ray absorption line spectroscopy (e.g., Wang et al. 2005; Williams et al. 2005; Yao & Wang 2005; Juett et al. 2006; Costantini et al. 2012; Wang 2010 and references therein). Through the measurements of absorption lines produced by various ions in the spectra of bright X-ray sources, primarily active galactic nuclei and X-ray binaries, it becomes possible to constrain the spatial, physical, chemical, and kinematic properties of the hot gas. One key step in such a study is the identification and correction for any potential spurious features, which may be intrinsic to the background source or to the instruments. This issue is particularly acute for local sources, which may produce features that cannot be easily recognized because of little systematic velocity offset.
The existing interstellar X-ray absorption line study of Cyg X-2 represents such an outstanding case (Yao et al. 2009). This archetypal Z-source is a bright binary system containing a neutron star, accreting from its low-mass companion (V1341) with an orbital period of 9.84450 days (Casares et al. 2009). In their study with a Chandra grating spectrum, Yao et al. (2009) particularly noted a puzzling lack of the interstellar O VII K (21.602 Å) absorption line. Other important Oxygen absorption lines, such as O VII K (18.654 Å), O VIII K (18.967 Å) and O VI K (22.040 Å), were all detected. The missing line is known to lay in the middle of these other lines in terms of the transition wavelengths and ionization states of the ions and is usually known to be the strongest of them all. One possibility presented, but ruled out, by Yao et al. was that the absorption line might be filled or contaminated by a broad emission line similar to those detected at wavelengths shorter than 10 Å in the same spectrum (Schulz et al. 2009). These broad emission lines originate from the photo-ionized accretion disk corona (ADC) surrounding the neutron star. The presence of a broad O VII K emission line, which could only be partly absorbed, would leave broad wings in the spectrum, which were not detected.
In the present work, we test a hypothesis that the absorption line could be contaminated by a relatively narrow emission line. Such a line or lines might be expected from X-ray heating of the atmosphere of the companion star and/or an outer region of the expected accretion disk, where the Doppler broadening may be sufficiently small. This is possible because the O VII K line is at a lower energy than where the broad emission lines were detected. At such lower energies, relatively narrow emission lines were indeed observed in the spectra of LMC X-3 (Song et al. 2010), for example, although it is a high-mass X-ray binary with an accreting black hole. If this was the case, Cyg X-2 may then be a problematic background source for the study of interstellar absorption lines. A varying, narrow emission line could not only make absorption lines ’vanish’, but change their depths and other properties key to such a study. In the present work, we mainly use multiple XMM-Newton observations to test our hypothesis and to potentially enhance our understanding of the hot ISM along the line of sight as well as this well-known source itself.
Indeed, Vrtilek et al. (2003) have suggested that He II and N V emission lines, as detected with HST/GHRS observations of Cyg X-2, seem to arise from the surface of the companion. These lines show velocity shifts that are consistent with this interpretation; but the FWHMs of the lines are larger than expected. It may be possible that the line emission is from an accretion heated corona above the disk; however, the FWHMs are smaller than expected by simple models of line emission from accretion disks; the lines also do not exhibit the double-peaked structure as predicted. We use recently available HST/COS data of Cyg X-2 with improved sensitivity and resolution to search for the N V counterpart of the putative O VII K line and to determine the nature of the line emission. In addition, we have carefully re-examined the Chandra/HETG data to check the consistency of the XMM-Newton results and to further the test of our scenario.
The organization of the paper is as follows: In § 2, we describe the XMM-Newton observations and our data reduction procedure. We present the analysis and results of the data in § 3. The results are then compared with those from other X-ray and UV data analyses in § 4. In § 5, we discuss the origins of the absorption and emission seen in the Cyg X-2, as well as the consistency of our scenario. All errors are measured at the 68% (1) confidence, unless marked otherwise.
2 XMM-Newton OBSERVATIONS AND DATA REDUCTION
| Obs# | ObsID | (s) | (s) | Start Time | CR | (Å) | (Å) | EWovii (mÅ) | EWovi (mÅ) | |||
|---|---|---|---|---|---|---|---|---|---|---|---|---|
| N1 | 0111360101 | 21481 | 14030 | 2002-06-03@10:13 | 0.83 | 33.84 | 1.03 | 82.36/79 | ||||
| N2 | 0303280101 | 31784 | 31510 | 2005-06-14@13:49 | 0.30 | 34.37 | 0.97 | 83.19/77 | ||||
| N3 | 0561180201 | 10004 | 9753 | 2008-11-10@13:40 | 0.76 | 30.42 | 1.20 | 87.20/82 | 22.0254 (fixed) | |||
| N4 | 0561180401 | 4942 | 4786 | 2008-12-22@05:40 | 0.99 | 35.67 | 1.11 | 77.27/81 | 21.6081 (fixed) | |||
| N5 | 0602310101 | 84850 | 83270 | 2009-05-12@09:44 | 0.37 | 34.56 | 1.00 | 110.8/76 | ||||
| N6 | 0561180501 | 13725 | 13280 | 2009-05-13@10:03 | 0.44 | 30.14 | 1.02 | 96.97/81 | 22.0254 (fixed) | |||
| N7 | 0650040801 | 30941 | 3138 | 2010-11-22@13:24 | 0.22 | 46.18 | 1.37 | 81.96/78 | ||||
| N8 | 0650040901 | 30940 | 15540 | 2010-11-24@05:47 | 0.39 | 35.51 | 1.30 | 102.8/79 | ||||
| N9 | 0650041001 | 30939 | 3638 | 2010-11-24@15:00 | 0.43 | 37.16 | 1.24 | 81.71/78 | ||||
| N10 | 0650041101 | 30939 | 30610 | 2010-11-26@13:15 | 0.62 | 17.33 | 1.16 | 79.87/77 | ||||
| N1-10 | Combined | 290545 | 209600 | - | - | - | 1.05 | 201.0/165 |
Our data analysis includes ten archival XMM-Newton exposures (Table LABEL:t:xmm). Only the data from one of the two reflection grating spectrometers (RGS1) are used. The RGS2 had a failed CCD covering the wavelength range including the O VII K line, rendering the data irrelevant in the present study.
Note: and are the original and cleaned exposures, while is the Cyg X-2 orbital phase of an individual observation. in units of is the 1.5-12 keV band flux from RXTE/ASM (). The RGS count rate (CR), in units of , is estimated in the range of 21.0-22.7 Å. The and number of degrees of freedom are for the best model fit to the RGS spectrum. The last row (N1-10) gives the parameters for the combined spectrum.
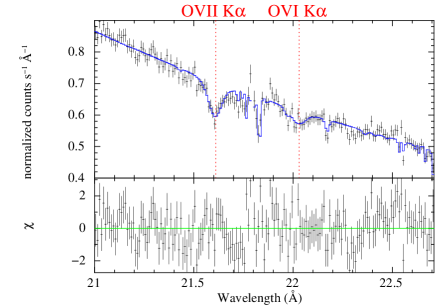
We reduce the data, using the current calibration files and Scientific Analysis System software (version 10.0.0). Our spectral extraction from each observation adopts the source coordinates of Cyg X-2 (RA = , Dec = 38∘19′18.0′′; J2000) from NED and the default 90% count enclosed region. Both the background and response matrix files are also extracted using the default setting. We also produce a combined spectrum by merging the on-source spectral, response matrix, and background files from individual observations. We fit the spectrum with a simple power law with two multiplicative Gaussian components representing the O VII and O VI K absorption lines, as well as a foreground photo-electric absorption in the range of 21.0 - 22.7 Å. Our focus is on the measurement of the absorption lines, which is insensitive to the specific value of the photo-electric absorption and the power law index (the two are strongly correlated). Therefore, in subsequent analysis we fix the absorption column density to , which is the best fit to the combined spectrum. We also fix the intrinsic widths (the Gaussian dispersion ) of the absorption lines at keV as they are not resolved within the X-ray spectra.
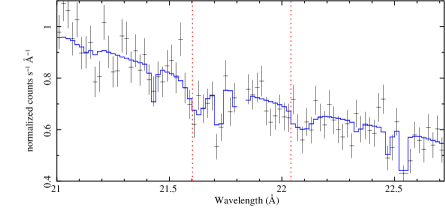
A few spectral channels show substantially large deviations from the best-fit model. These individual channels span wavelength intervals that are much smaller than the characteristic width of the line response function (LRF); therefore, the deviations must be instrumental, which indeed tend to appear at edges of flagged bad columns or CCD gaps, where the effective area of the instrument is not well calibrated. To systematically identify such channels, we compare the spectrum from each observation with the same best-fit model, except for the power law normalization, which is refitted. We flag channels with more than 3 deviations from the fit to be bad. This exclusion of the channels provides an acceptable balance between removing affected data and keeping good ones. The resultant spectra are merged again to form the final combined spectrum, which is then fitted with the same model. This fit is presented in Fig. 1, while the interested model parameters are included in Table LABEL:t:xmm.
A slightly different processing procedure is also tried, following the referee’s suggestion. While our data processing uses a default keepcool=yes setting of the SAS tool rgsproc, this setting does not let rgsproc detect bad pixels. To test whether or not a different setting would make a significant difference, we perform a comparison of centroids and equivalent widths (EWs) for both the O VII and O VI K lines, obtained using either keepcool=yes or =no. The comparison shows the consistency within the statistical errors (see the next section). In fact, the model fits with the keepcool=no spectra tend to be slightly worse than the keepcool=yes spectra (as obtained with the above described extra-cleaning).
Table LABEL:t:xmm also includes the orbital phases of individual observations. For each observation, the phase is calculated for the middle time of the exposure duration with the ephemeris provided by Casares et al. (2009): an inferior conjunction reference time and an orbital period of days. The error in the period can cause an uncertainty in the phase estimate up to (i.e., for the latest observation), which is deemed insignificant for our analysis.
3 XMM-NEWTON DATA ANALYSIS AND RESULTS
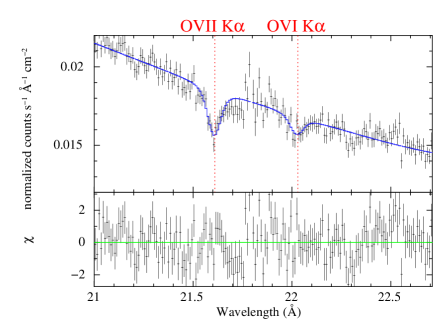
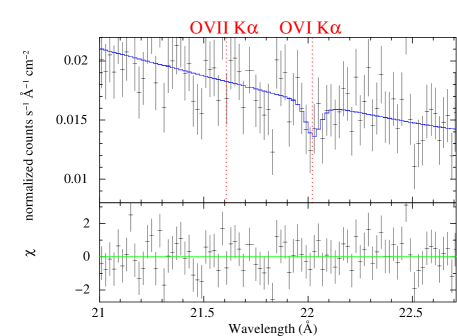
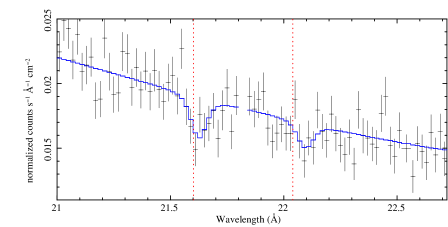
The presence of the O VII K and O VI K lines in the combined spectrum is apparent (Fig. 1; last row in Table LABEL:t:xmm). The shapes of these lines are consistent with the instrument LRF. Although the indicates that the fit is reasonable (which cannot be rejected at a confidence ; Table LABEL:t:xmm), the combined spectrum shows apparently residual systematic peaks and valleys. None of these marginal deviations can be attributed to any known atomic transition, and most of them are in the vicinities of the bad columns (as indicated by narrow dips of the model profile in the top panel of Fig. 1). In individual spectra, the features appear less obvious. The O VII and O VI K absorption lines are also detected in the bulk of the individual observations at various significance levels (Table LABEL:t:xmm), but are clearly missing in the observations N4 (for O VII; upper panel in Fig. 2) and N6 (O VI; lower panel). In addition, the O VI K line detection in N3 is also very marginal (at ). For these three spectra, the EWs and their errors were measured with the centroid wavelengths of the respective lines fixed to the corresponding best-fit values of the combined spectrum (Table LABEL:t:xmm).
We calculate the least mean of the EWs and test the null hypothesis of a constant EW for each line. The least mean of the EWs (i.e., averaged with weights , where refer to the measurement errors from individual observations) is mÅ for O VII and mÅ for O VI for all the observations. These mean values are well consistent with the EWs from the direct fit to the combined N1-10 spectrum. With the mean values, the null hypothesis with and (for the O VII and O VI K lines) can be ruled out at confidence for both lines. Excluding N3 (with no detection of O VII) or N4 and N6 (no significant O VI), the least mean of the EW becomes mÅ for O VII K or mÅ for O VI K, and the null hypothesis with and cannot be ruled out at any reasonable confidence. These different mean values, as well as the individual EWs, are shown in Fig. 3. The EW of the O VII or O VI K lines in N4 or N6 deviates from the respective mean at the or level. N3, N4 and N6 represent the shortest original exposures (Table LABEL:t:xmm), but after cleaning N7 and N9 are shorter (Table LABEL:t:xmm); see our later discussion of potential exposure effects.
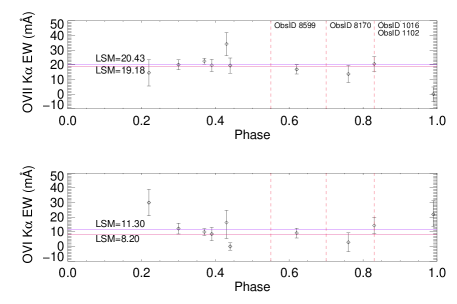
A casual look of Fig. 3 may indicate a possible anti-correlation between the O VII and O VI K line EWs. At , the EWs of the O VII line tend to be larger, while those of the O VI line tend to be smaller than at 0 or 1. This anti-correlation may be a bit more apparent in Fig. 4, where the two EW measurements of the two lines are directly compared. However, the scatter among the data points is large, in addition to the large error bars of individual measurements. With a bootstrapping re-sampling, accounting for both the scatter and the errors of individual measurements, the Spearman’s Rank coefficient is , indicating that the anti-correlation is not significant.

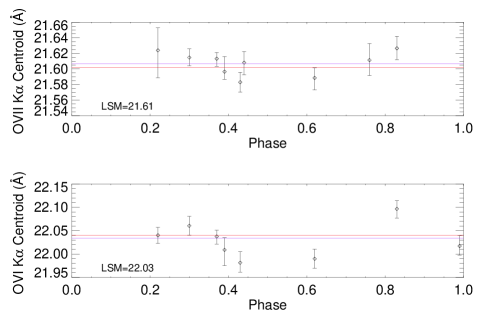
Similarly, we check the variability of the absorption centroids of the two absorption lines and the potential dependence on the orbital phase (Fig. 5). From the measured centroid wavelengths in Table LABEL:t:xmm, we obtain their mean value as and Å for the O VII and O VI K lines, indicating no systemic velocity shifts from the rest-frame wavelengths ( and ). The root mean square (RMS) deviation of the measurements are 0.012 mÅ and 0.020 mÅ for the two lines, corresponding to velocity dispersions of 163 and 272 . It should be noted, however, the sampling of the orbit by the observations is probably too small to avoid a bias in the estimates of both the systematic velocities and the RMS deviations. Furthermore, while the centroids of the stronger O VII line appear to be consistent with a constant (with the null hypothesis ), the O VI line centroid shows significant variation (; at a confidence of 99.925%).
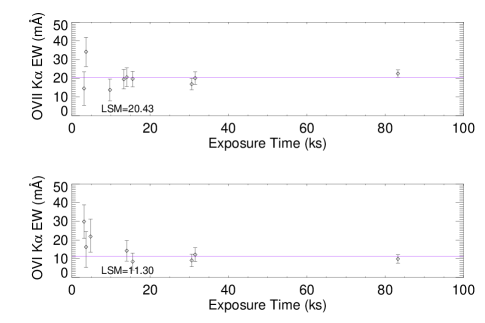
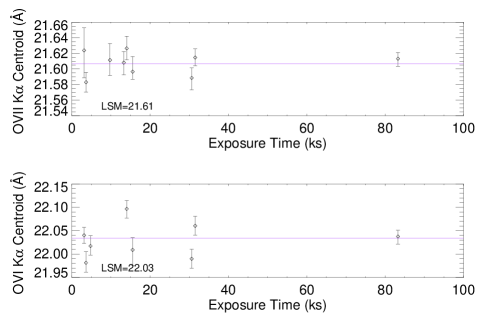
One may be concerned that the measurements of the absorption lines may be affected by the exposure of an observation. Indeed, the observation (N4) with zero O VII K EW has a relatively short exposure, although it is not the shortest (among the cleaned exposures). But the observation (N6) with zero O VI K EW actually has a quite long cleaned exposure (13 ks). Fig. 6 shows no significant dependence of the EWs or the centroids on the exposures. We label the three data points obtained from the shortest exposures ( ks) in Fig. 4. The remaining points, though with smaller error bars, still do not show any clear trend.
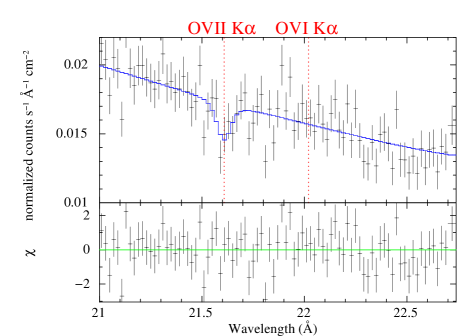
Much of the apparent centroid variation of the O VI line (and possibly the O VII line as well) appears to be related to some bias caused by the presence of instrumental features in the spectra. Most of the spectra have such features in the immediate vicinities of the fitting line. Although the features are supposedly accounted for by the effective area correction, their presence could still affect a fit (e.g., via an uneven counting statistics weighting), leading to an apparent shift of the line centroid. This effect seems to be important for line fitting with poor counting statistics (e.g., to the O VI K line) and is realized in various simulations with the XSPEC fakeit routine. The effect is sometimes apparent in the fits to the real spectra. Fig. 7 illustrates an extreme case of such centroid shifts: the apparent redshift of the O VII line centroid (from the rest-frame wavelength) seems to be due to the presence of an instrumental feature on the long wavelength side, whereas the origin of the large redshift of the O VI line centroid is much less clear, although an instrumental feature is apparent at the rest-frame wavelength of the line. Because of such uncertainties, the XMM-Newton centroid measurements for individual spectra are not used in the rest of this paper.
4 COMPARISONS WITH OTHER OBSERVATIONS
The XMM-Newton detection of the O VII absorption line and the variation of both O VII and O VI line EWs prompt us to re-examine the Chandra observations of Cyg X-2 and to extract relevant information on both line and continuum emissions of the source from observations made with HST and RXTE. The results are then compared with those obtained from XMM-Newton observations.
4.1 Re-examination of the Chandra data
We re-examine the validity of the existing Chandra results, based on a careful checking of various potential instrumental effects in our concerned wavelength range. We check whether or not the absence of the O VII K line in the Chandra data could be due to instrumental artifacts and quantify the inconsistency of the data with our XMM-Newton measurement. As shown in Fig. 8, the effective areas of the RGS1 is about a factor of 40 greater than that of the MEG at the O VII K wavelength (Fig. 8). But the spectral resolution of the MEG is significantly better than that of the RGS1. In terms of the figure of merit for detecting the O VII K line, the RSG1 is still about a factor of 5 more effective than the MEG.
Following Yao et al. (2009), our re-examination is based primarily on a co-added spectrum of four High Energy Transmission Grating (HETG) observations (Table 2). We use only the Medium Energy Grating parts for their relatively high sensitivity. The four observations were taken with a SIM-Y offset of 1.167 arc-minutes. With such a configuration, the gap between the front-illuminated (FI) CCDs (S4 and S5) is at Å in positive order spectrum111http://cxc.harvard.edu/cgi-gen/LETG/alp.cgi, while the back-illuminated (BI) CCD (S1) covers the wavelength range of 12.5-24.0 Å in the negative order MEG spectrum (Fig. 8). At Å, the significant drop of the effective area of the negative order MEG is consistent with this configuration. However there is also a remarkable drop around 21.4 Å with a width of 0.8 Å, which could be due to numerous bad columns and pixels that have been excised in the continuous-clocking observation mode along with the dithering effect. Unfortunately, our line of interest, O VII K, landed in this region. Nevertheless, at wavelengths around 21.6 Å, the BI CCD has more than twice the effective area than the FI CCD, and dominates the contribution to the spectral counts. Therefore, we examine the O VII K absorption line in the spectra extracted from the negative order alone.
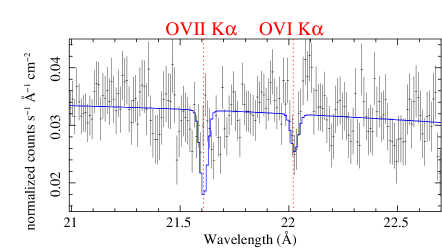
To check the consistency of the mean O VII K absorption line measurements, we simulate 1000 MEG spectra using the best-fit model of the line in the RGS combined spectrum, while the continuum is taken as measured in the real co-added MEG spectrum, which gives the 95% upper limit of the EW as 6.3 mÅ (Yao et al. 2009). Fig. 9 upper panel shows an overlay of the adopted model on the spectrum. Each simulated spectrum is fitted to obtain the line strength. We find that the smallest strength value is about 10 mÅ. Therefore, the consistency of the MEG upper limit with the RGS measurement can be ruled out statistically at a greater than 99.9% confidence.

We further conclude that this non-detection of the line in the MEG spectrum cannot be attributed to any known instrumental effects. The shape of the effective area used seems to be quite reasonable; the spectra near the line can be well fitted with a simple power-law model, as would be expected (Fig. 4 in Yao et al. 2009). We also find no clear dependence of such missing absorption lines on the orbital phase of the source, based on analysis of the MEG spectra from individual observations. As shown in Fig. 3, one of the Chandra observations coincides in phase (though not observing date) with an XMM-Newton observation which has a clear detection of the O VII line. It thus remains puzzling as to why the absorption line was absent in all of the four Chandra observations taken on different dates and/or in different orbital phases (Table 2), while the line disappears only occasionally in XMM-Newton observations. Admittedly, we cannot completely rule out the consistency when a pair of observations are compared with each, especially when the counting statistics is poor (e.g., due to relatively short exposure) and hence error bars are large. Such a comparison will thus not be particularly useful. What we can firmly conclude is that the absorption line strength is not a constant.
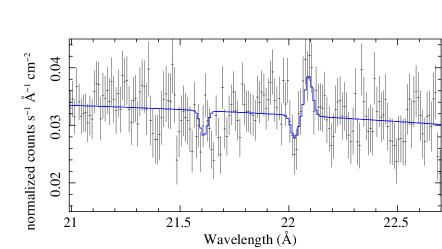
The O VI K absorption line as detected in the MEG spectrum has an EW of 10.8 ( mÅ) (Table 4 of Yao et al.), statistically consistent with the mean EW of 11.3 mÅ obtained with RGS spectra, excluding the non-detection observation N6. Interestingly, the close-up of the spectral range as shown in Fig. 9 indicates the presence of an emission line at Å, just on the longer wavelength side of the O VI absorption line. To assess its significance, we fit the line with an additive Gaussian (Fig. 9). The fitted dispersion and EW are keV and mÅ, which are all comparable to that of the absorption line. Therefore, this emission line may be responsible for the occasional disappearance of the absorption line, when the two are blurred together.
We also check the consistency of other absorption lines detected by Yao et al. (2009). Unfortunately, the spectral regions around all these lines are in general severely affected by various instrumental features in the RGS spectra. We find it difficult to obtain conclusive results. In particular, the O VII K line centroid measured in the MEG spectrum is significantly blue-shifted relative to the rest-frame wavelength (18.654 Å) calculated by Ming F. Gu, but is consistent with the value (18.628 Å) given in the catalogs of NIST and Verner et al. (Table 1 of Yao et al.). A similar offset (though smaller) is also present for Ne IX K line. It seems that Gu’s calculation may be systematically biased for the K transitions of He-like ions. The detection of these lines appears to be rather secure in the MEG spectrum (with high detection significance and no obvious instrumental effect). With the caveats of multiple instrumental features (which may not be adequately corrected) in the spectral region of the RGS data and assuming the wavelength of 18.628 Å, we obtain a measurement of the line with an EW of about mÅ (1 errors), which is consistent with the MEG measurement of (Table 4 in Yao et al. 2009).
| Obs# | ObsID | Exposure (ks) | Start Time | ||
|---|---|---|---|---|---|
| C1 | 1102 | 29 | 1999-09-23@21:12 | 0.83 | 20.78 |
| C2 | 1016 | 15 | 2001-08-12@03:42 | 0.83 | 45.87 |
| C3 | 8599 | 71 | 2007-08-23@05:01 | 0.55 | 29.07 |
| C4 | 8170 | 79 | 2007-08-23@17:44 | 0.70 | 44.94 |
| Obs# | Exp. (s) | Start Time | Flux | |
|---|---|---|---|---|
| H1 | 7044.8 | 2010-09-21 14:11 | 0.81 | 3.3 |
| H2 | 7111.7 | 2010-09-24 10:53 | 0.11 | 3.3 |
| H3 | 7114.7 | 2010-09-26 09:13 | 0.32 | 3.3 |
Note: The flux is in units of .
4.2 Emission lines as observed by HST/COS
HST visited Cyg X-2 three times with the COS (Table 3). These observations were taken with the FP_POS position shifting from 1 to 4 during each visit. We calibrated the observations with the pipeline CALCOS (version 2.11f). Flat-fielding and alignment of the processed exposures were carried out using IDL routines developed by the COS science team222See http://casa.colorado.edu/danforth/costools.html for the co-adding and flat-fielding algorithm and additional discussion.. The extracted spectra from individual exposures of each observation were cross-correlated and combined to form an exposure-weighted co-added spectrum.
Here we focus on the N V doublet region of the COS spectra (Fig. 10). Compared to the rest-frame wavelengths of 1238.82 Å and 1242.81 Å, the line centroids are blue-shifted, consistent with similar velocities as seen in the GHRS spectra (Vrtilek et al. 2003). The profile of each line apparently consists of two major components: one (with higher peak fluxes) seems to be considerably narrower than the other. While a quantitative decomposition and modeling of these components are beyond the scope of the present work, a few trends are readily noticeable. Both the centroid and flux of these two components change systematically with the phase. The positive centroid velocity shift of the narrow component, as seen from the left to the right panels, is qualitatively consistent with its association with the companion, as tentatively suggested by Vrtilek et al. (2003). The component appears substantially narrower than inferred from the GHRS spectrum (FWHMs and ) and is again more consistent with the companion origin than with the accretion disk. The velocity shift of the broad component with the phase appears to be in the opposite direction of the narrow one. Therefore, the broad component can be attributed naturally to the accretion disk. Both components appear to be the brightest in the plot. This trend for the broad component may be consistent with the saddle shaped disk model, in which less obscuration is expected at or 0.75. For the narrow component, some obscuration may be expected from the companion itself, particularly at . With an inclination of 62.5∘ for the binary system (Casares et al. 2009), the line emission may originate in an outflow from the heated surface of the companion.

4.3 Correlation with broad-band X-ray fluxes
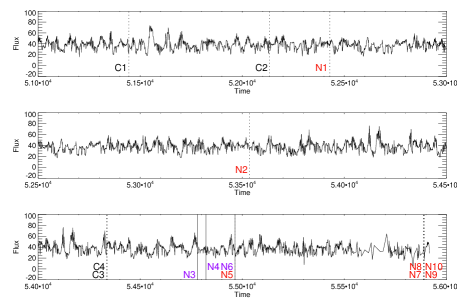
We further explore the potential connection of the line absorption with the broad-band X-ray fluxes of Cyg X-2. In Fig. 11, for example, we have marked all the grating observations on the light curve obtained with the RXTE /ASM. However, we find no apparent correlation of the absorption line EWs seen in the RGS or HETG observations with the ASM or RGS broad-band fluxes (Tables LABEL:t:xmm and 2).
5 DISCUSSION
What is the origin of the O VII and O VI K absorption lines? Along the line of sight toward Cyg X-2 (Galactic coordinates ), a typical ISM absorber is expected to have a systemic velocity in the range of to , as seen in 21 cm neutral hydrogen surveys. In contrast, the systematic velocity of Cyg X-2 is known to be (Casares et al. 2009), which means that its emission at the systemic velocity would be 15 mÅ off from the absorption line centroid; the line-of-sight orbital velocity of the companion, , alone can hardly make a difference. The measured centroid of the O VII K line, Å, appears to be slightly redshifted, compared to the expected rest-frame wavelength of 21.602 Å. But the measured line centroid of the O VI K line, Å, compared to the expected 22.040 Å, shows an opposite shift. One also needs to consider the systematic absolute wavelength uncertainty of 7 mÅ (1), as is expected for an RGS observation. We add the statistical and systematic uncertainties in quadrature and find that the centroids of both lines are consistent with an ISM origin (within ) and that the O VII line is significantly redshifted from the systemic velocity of Cyg X-2 at a confidence level of .
If the absorption lines arise from the hot ISM, then the observed variation in the EWs must be related to the changing intensity of the emission lines associated with Cyg X-2. Because of the limited spectral resolution of the RGS (FWHM 60 mÅ), the emission and absorption lines should be blended. But a velocity offset between the line emission and absorption could also be large enough to affect the centroid measurement of the absorption line. However, as mentioned in § 3, the current measurements are not sufficiently reliable to constrain the emission properties of the source.
Another interesting issue that needs an explanation is the fact that the O VII K absorption line was detected, while the O VII K line was missing in the same Chandra/HETG spectrum (Yao et al. 2009). This may be understood in our emission filling scenario because the emissivity of the K transition is substantially higher than that of the K transition for a plasma of K. In addition, the effectiveness of the emission filling can be affected by the substantial difference in the absorption saturations of the two lines. The optical depth is at the center of the K line and for the K line for an absorbing plasma of a column density, log[N(O VII)] , and a velocity dispersion, (Yao et al. 2009). In contrast, there is no saturation for the corresponding emission lines. Thus it is easier to fill a highly saturated O VII K line than a weakly saturated O VII K line.
What is the origin of the emission lines? Possible sites are the accretion disk, the impact bulge of the accretion stream, and the surface or even outflow of the stellar companion. Emission lines from the first two sites should generally be broad (as observed in those short wavelength lines; Schulz et al. 2009), due primarily to the fast rotation around the neutron star, depending on the exact location of the emission site. In comparison, the emission from the companion should be relatively narrow. Therefore, the O VII and O VI K lines, as well as the narrow component of the N V doublet seen in the COS spectra, are likely to be associated with the companion or its wind. Also the relative strengths of these emission lines are sensitive to the temperature of X-ray-emitting plasma. Therefore, the lines may not arise from the same locations. So a correlation between the line emissions is not necessary, which may explain the lack of the coincidence of the missing O VII and O VI absorption lines (§ 3). Indeed, the redshift of the emission line centroid wavelength corresponds to a velocity shift of , relative to the rest-frame wavelength (22.0403 Å) and larger to the blue-shifted Cyg X-2. This large velocity shift, if real, indicates an association of the emission line with the accretion flow. However, this scenario can hardly explain the narrowness of the line. The emission and absorption lines together resembles a P-Cygni profile, which could originate in a thick wind. However, the Cyg X-2 has a low-mass companion, which is not expected to have a strong wind. Also for a wind-generated P-Cygni profile, the absorption is expected to be strong blue-shifted, while the emission should peak at the rest-frame wavelength, which is opposite to what is observed for Cyg X-2. So the origin of the emission line remains largely unknown.
The Chandra or XMM-Newton grating observations were taken in various different orbital cycles, in which Cyg X-2 may be in very different states. Therefore, the observations probably sampled quite different accretion, heating, and radiation processes; hence different X-ray line emissions, even if the binary had similar orbital phases and/or continuum X-ray fluxes (Bałucińska-Church et al. 2011; Vrtilek et al. 2003). Therefore, it is highly desirable to have a set of dedicated X-ray spectroscopic observations in a single orbital cycle. As illustrated in § 3, potential instrumental effects on the measurements of the absorption lines should also not be neglected. In addition to the discussed effect on the centroid measurement, the presence of instrumental features, which may not be corrected accurately, could, in principle, affect the quantitative measurements of the EW of a line as well. The pointing direction of the observations should thus be set carefully to minimize the presence of the instrumental features in the immediate vicinities of the key absorption lines.
6 SUMMARY
Motivated by solving the mystery of the missing O VII K absorption in a previous Chandra/HETG study, we have systematically analyzed 10 XMM-Newton/RGS observations of Cyg X-2 in the wavelength range covering both the O VII and O VI K lines. This analysis is complemented by both a re-examination of the Chandra/HETG data and an analysis of the N V 1238.82 Å and 1242.81 Å doublet in three HST/COS spectra. The main results and conclusions that we have obtained are as follows:
-
•
We have clearly detected the O VII K absorption line in the bulk of the RGS observations. The mean EW of the line is mÅ. But in one of the observations, the lack of the line (or an inconsistency with the mean EW at the level) is also detected, similar to the absence of the line in the Chandra/HETG spectra, which is confirmed in our re-analysis. Similar EW variation is also detected for the O VI K line. But this variation is not correlated with that of the O VII K line.
-
•
The mean centroids of the two absorption lines are consistent with their origin in the ISM. The EW variations in the lines are thus likely caused by changing contamination of the corresponding narrow line emission within the LRF of the RGS.
-
•
A re-examination of the MEG spectrum shows an apparent narrow emission line right on the longer wavelength edge of the O VI K absorption line. Their EWs are also comparable. Therefore, such an emission, when observed with a lower spectral resolution and/or shifted to a shorter wavelength, could be responsible for the occasional disappearance of the O VI K absorption in the RGS spectra.
-
•
A narrow component of the N V emission doublet is also seen in the HST/COS spectra of Cyg X-2. This component, likely associated with the X-ray heated binary companion, varies in the line strengths and centroids.
-
•
The exact origin of the putative O VII and O VI K line emission is yet to be understood. A dedicated monitoring study of the X-ray line absorption over a single orbital period could be particularly useful to constraining the site of the line emission and hence understanding its nature.
Acknowledgments
We are grateful to the referee for valuable comments that lead to improvements of the paper. This research made use of XMM-Newton archival data. XMM-Newton is an ESA science mission with instruments and contributions directly funded by ESA Member States and the USA (NASA). We thank Dr. Herman Marshall for comments on various HETG calibration issues and gratefully acknowledge the support by NASA via the summer research fellowships from the Massachusetts Space Grant Consortium and the grants NNX10AE85G and AR1-12018X. Y.Y. acknowledges the funding support from Chandra archival program AR1-12002A.
References
- (1) Bałucińska-Church, M., et al. 2011, A&A, 530, 102
- (2) Casares, J., Hernández, J. I. G., Israelian, G. & Rebolo, R., 2009, MNRAS, 401, 2517
- (3) Costantini, E., et al. 2012, A&A, 539, 32
- (4) Juett, A.M., Schulz, N.S., Chakrabarty, D. & Gorczyca, T.W. 2006, ApJ, 648, 1066
- (5) Putman, M. E., Peek, J. E. G., & Joung, M. R. 2012, ARA&A, 50, 491
- (6) Schulz, N. S., et al. 2009, ApJ, 692, L80
- (7) Song, L., et al. 2010, ApJ, 140, 794
- (8) Vrtilek, S. D., et al. 2003, PASP, 115, 1124
- (9) Wang, Q. D. 2010, PNAS, 107, 7168
- (10) Wang, Q. D., et al. 2005, ApJ, 635, 386
- (11) Williams, R. J., et al. 2005, ApJ, 631, 856
- (12) Yao Y., Schulz N.S., Gu M.F., Nowak M.A., & Canizares C.R., 2009, ApJ, 696, 1418
- (13) Yao, Y., & Wang, Q. D. 2005, ApJ, 624, 751
- (14)