Classical and quantum ordering of protons in cold solid hydrogen under megabar pressures
Abstract
A combination of state-of-the-art theoretical methods has been used to obtain an atomic-level picture of classical and quantum ordering of protons in cold high-pressure solid hydrogen. We focus mostly on phases II and III of hydrogen, exploring the effects of quantum nuclear motion on certain features of these phases (through a number of ab initio path integral molecular dynamics (PIMD) simulations at particular points on the phase diagram). We also examine the importance of van der Waals forces in this system by performing calculations using the optB88-vdW density functional, which accounts for non-local correlations. Our calculations reveal that the transition between phases I and II is strongly quantum in nature, resulting from a competition between anisotropic inter-molecular interactions that restrict molecular rotation and thermal plus quantum fluctuations of the nuclear positions that facilitate it. The transition from phase II to III is more classical because quantum nuclear motion plays only a secondary role and the transition is determined primarily by the underlying potential energy surface. A structure of symmetry with 24 atoms in the primitive unit cell is found to be stable when anharmonic quantum nuclear vibrational motion is included at finite temperatures using the PIMD method. This structure gives a good account of the infra-red (IR) and Raman vibron frequencies of phase II. We find additional support for a structure as a strong candidate for phase III, since it remains transparent up to 300 GPa, even when quantum nuclear effects are included. Finally, we find that accounting for van der Waals forces improves the agreement between experiment and theory for the parts of the phase diagram considered, when compared to previous work which employed the widely-used Perdew-Burke-Ernzerhof (PBE) exchange-correlation functional.
I Introduction
Hydrogen (H) is the most abundant of the elements and, having one electron, it can form only a single strong covalent bond. As a result, pure H is expected to remain molecular to very high pressures. Several solid phases of H have been observed; phase I is a quantum crystal of rotating H2 molecules on a hexagonal close packed (hcp) lattice but, despite decades of study, the arrangements of the molecules in phases II and III are unknown. Mao_1994 ; Ceperley_2012 Evidence has recently been found for a room-temperature phase IV of solid hydrogen, Eremets_2011 ; Howie_2012 ; Pickard_hydrogen_2012 ; Pickard_hydrogen_2012_Erratum although here we study only low temperatures of K.
Determining the atomic structures of the different phases presents a formidable challenge to experiment. Direct experimental structure determinations for solid hydrogen are hampered by the weak scattering of X-rays by H and the difficulties of combining high-pressure static diamond anvil cell techniques with such measurements. To date only a single X-ray study covering the three low-temperature phases has been reported. Akahama_2010 Although this study provides constraints on the experimental structures and phase transitions, the strongest experimental evidence comes from IR, Raman, and optical measurements which provide valuable but indirect structural information. Mao_1994 A key experimental observation is that the boundary between phases I and II depends strongly on the isotope. Mao_1994 ; Mazin_1997 ; Cui_1994 At low temperatures, the I/II transition occurs at 28 to 40 GPa (0.28 to 0.4 megabar) in D2, Cui_1994 ; Silvera_1981 50 to 69 GPa in HD, Moshary_1993 and 90 to 110 GPa in H2. Mazin_1997 ; Lorenzana_1990 In contrast, the boundary between phases II and III, which occurs at 160 GPa, Goncharov_2011 is only weakly dependent on the isotope. Likewise, the transition from phase I to II is strongly temperature dependent, whereas the II/III transition is essentially independent of temperature. Upon passing from phase I to II the vibrational roton modes undergo substantial changes, indicating that the molecules change from a rotationally free state to a rotationally restricted one. The IR activity increases dramatically at the II/III transition and the IR and Raman vibron frequencies soften by about 80 cm-1. Akahama_2010 ; Loubeyre_2002 Phase III remains transparent up to 300 GPa but becomes dark by about 320 GPa. Loubeyre_2002
The theoretical characterisation of high pressure solid hydrogen is also a major challenge. The development of a successful model must start with an extensive exploration of structural phase space in order to identify candidate structures for the different phases. Pickard_2007 ; Tse_2008 In addition, the energetics of the structures must be accurately accounted for, and the optical properties must be well-described, particularly at the high pressures at which metallisation may occur. Given the low mass of hydrogen, quantum nuclear effects including zero-point (ZP) motion should also be accounted for. Kohanoff_1997 ; Biermann_1998a ; Biermann_1998b ; Kitamura_2000 No current theoretical method is capable of giving a satisfactory account of all of these, and none of the excellent theoretical papers on this system have addressed all of these issues simultaneously. In this work we have addressed these points using a combination of state-of-the-art methods. We have used the results from extensive density-functional-theory (DFT) based searches of the potential energy surface (PES) Pickard_2007 ; Pickard_2009 , so that our simulations start from the most stable structures identified to date. We have used the ab initio path-integral molecular dynamics (PIMD) method Marx_1994 ; Marx_1996 ; Tuckerman_1996 to account for quantum nuclear motion at finite temperatures. The equilibrated structures obtained from the PIMD calculations are used to calculate optical properties using the many-body perturbation theory approach, and a hybrid exchange-correlation density functional. Johnson_2000 In the PIMD simulations we use a 144-atom supercell together with the constant-pressure, constant-temperature (NPT) ensemble. Martyna_1999 This ensemble allows relaxation of the cell shape and size, and reduces the bias towards particular structures which arises from using small fixed cells. The use of large variable cells and lower-enthalpy static-lattice structures as the starting points of our simulations are important advances over previous PIMD studies of solid H, where either “quantum localisation” or metallic structures at too low pressures were predicted. Biermann_1998a ; Biermann_1998b ; Kitamura_2000 As we show below, the broad range of methods employed here provides an atomic-level picture of the classical and quantum ordering of protons in low-temperature solid hydrogen that is consistent with the key experimental results.
II Computational details
The quantum behaviour of the nuclei is described within the PIMD method by a “ring polymer” consisting of beads connected by springs. Marx_1994 ; Marx_1996 ; Tuckerman_1996 Nuclear exchange effects are neglected in our calculations and we assume an adiabatic decoupling of the electron and nuclear motions. PIMD is a finite temperature method and the number of beads required to give an accurate sampling of the imaginary time path decreases with increasing temperature. We have used 64 beads per nucleus for the simulations at 50 and 100 K, and 16 beads at 150 K. We have performed NPT PIMD simulations at 80 and 200 GPa. The simulations at 80 GPa were run for 9,000 steps using a time step of 0.25 fs, and the final 8,000 steps were included in the data analysis. Those at 200 GPa were run for 20,000 steps with a time step of 0.125 fs, and data from the final 15,000 steps were included in the analysis. Convergence tests were performed on the number of beads used, the simulation length, and the sampling intervals, and we also tested the validity of neglecting the nuclear exchange in the PIMD calculations, as reported in the supporting information. The DFT-based classical molecular dynamics (MD) and PIMD simulations were of the Born-Oppenheimer type, i.e., the electronic density was optimised self-consistently to the ground state at each time step. The electronic states were sampled on a k-point grid of spacing in all of the calculations. The MD and PIMD simulations were carried out using the CASTEP code CASTEP with ultra-soft pseudopotentials USP and a 350 eV plane-wave cut-off. The IR and Raman spectra were calculated within density-functional perturbation theory DFPT , using the CASTEP code, norm-conserving pseudopotentials Norm1 ; Norm2 and a plane-wave cut-off energy of 800 eV. All of the CASTEP calculations were performed with the Perdew-Burke-Ernzerhof (PBE) exchange-correlation functional PBE-GGA . The vdW-DF (optB88-vdW) Klimes_2010 , , and hybrid functional calculations were carried out using the VASP VASP3 ; Klimes_2011 code with PAW potentials PAWPP1 ; PAWPP2 and a 600 eV plane-wave cut-off. The X-ray diffraction simulations were performed using the Powder Cell program. POWDERCELL
III Results and Discussions
III.1 Accuracy of PBE
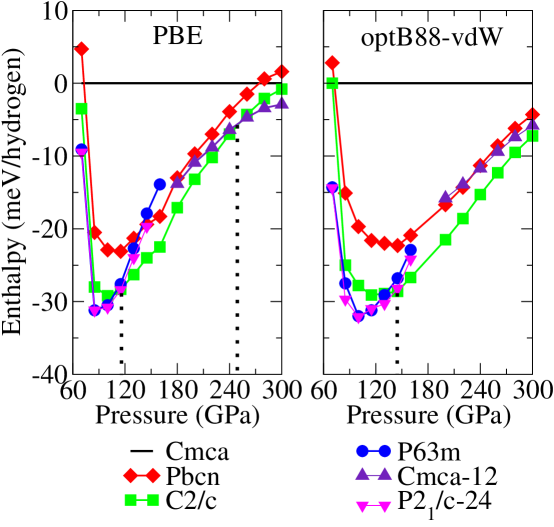
Pickard and Needs performed extensive explorations of the structural phase space of hydrogen, and a number of low-enthalpy structures were identified at pressures of about 100 GPa where phase II is stable. Pickard_2007 ; Pickard_2009 These structures correspond to minima in the static lattice enthalpy, and they do not include any effects from vibrations. The molecular centres in these structures lie very close to a hcp lattice, as is generally thought to occur in phase II. In this study we have used the -24 structure Pickard_2009 as a model for phase II. The -24 structure has 24 atoms in the primitive unit cell Pickard_2009 , and it is a little more stable than the structure of the same symmetry reported in Ref. Johnson_2000, , which has an 8-atom primitive unit cell. At higher pressures these hcp-based structures become unstable with respect to a layered structure of symmetry with 24 atoms in the primitive cell. A related and slightly less stable structure, with the same space group but a smaller unit cell, was found by Tse et al. Tse_2008 . DFT calculations using the PBE exchange-correlation functional show that has the lowest static-lattice enthalpy among the plausible candidates for phase III in most of the pressure range in which it has been observed, see Fig. 1 and Refs. Pickard_2007, and Pickard_2009, . Although PBE has been successfully applied in many high pressure studies, it does not account for van der Waals (vdW) interactions, which are often important in binding molecular crystals. We have therefore tested the effects of including vdW forces on the relative enthalpies and phase boundaries using the optB88-vdW functional Klimes_2010 within the vdW-DF scheme. Dion_2004 Fig. 1 shows that the relative stabilities of the structures are generally not altered substantially. However, the transition pressure between phases II and III (taking the -24 structure as our model for phase II and for phase III) is increased from 120 GPa with PBE to 150 GPa with optB88-vdW, in better agreement with experiment. Goncharov_2011 As can be seen in Fig. 1, static lattice PBE calculations indicate that Johnson_2000 is less favourable than over the pressure range in which phase III is observed. However, including harmonic ZP motion changes the picture significantly Pickard_hydrogen_2012 ; Pickard_hydrogen_2012_Erratum , and the softer structure becomes the most energetically favourable above about 225 GPa. The structure is, however, metallic and its vibronic frequencies are considerably lower than those of phase III, and therefore is not a plausible model for phase III. As can be seen from Fig. 1, using the optB88-vdW functional Klimes_2010 instead of PBE leads to an increase in the enthalpies with respect to of about 6 meV per proton for the weakly molecular structure and about 3 meV per proton for the strongly molecular -12 structure. When harmonic ZP motion corrections are added to the static lattice data of Fig. 1 we find that remains the most stable phase up to about 300 GPa. Using the optB88-vdW functional therefore removes a major conflict with experiment in the PBE phase diagram reported in Refs. Pickard_hydrogen_2012, ; Pickard_hydrogen_2012_Erratum, and, overall, gives significantly better agreement with the experimental phase diagram than the PBE functional.
III.2 Phases I and II
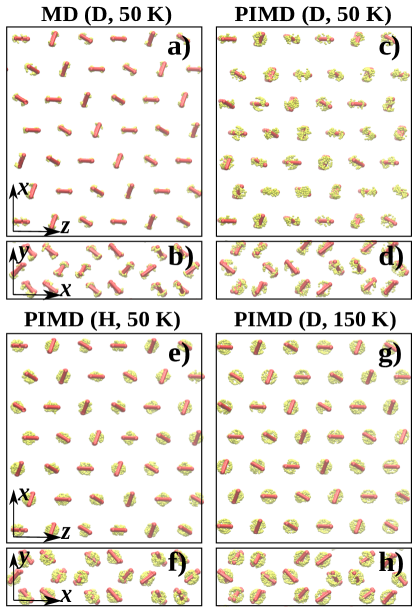
In order to explore phases I and II in more detail, we have carried out an extensive series of ab initio PIMD simulations. The first set of calculations was performed at 80 GPa, a pressure safely within the experimental region of stability of phase II in solid D2 and the region in which static DFT calculations predict phase II-like structures to be stable. PIMD simulations were performed on both the and -24 structures since they are the two lowest-enthalpy static-lattice structures at 80 GPa. A 144-atom supercell was used which is commensurate with the cells of both the Pickard_2007 and -24 structures. Pickard_2009 Using D at a temperature of 50 K and starting from the structure, MD and PIMD simulations quickly showed a transformation from the original structure to a new rotationally restricted state. The centres of the molecules still form a hcp lattice but the molecular orientations differ from the starting state and it is difficult to identify a corresponding static structure. This indicates that although corresponds to a minimum in the PES (with positive harmonic vibrational frequencies), it is so shallow that thermal or quantum effects are sufficient to disrupt it. Therefore is not a plausible structure for phase II when anharmonic nuclear motion is taken into account.
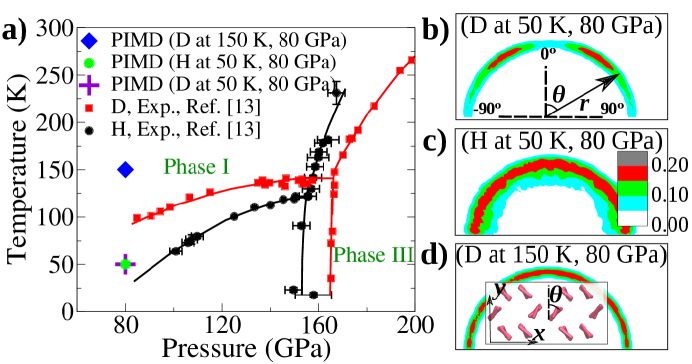
Starting from the -24 structure, we performed a classical MD simulation at 50 K, PIMD runs for D and H at 50 K, and a PIMD run for D at 150 K. Some of the key results from these simulations are reported in Fig. 2, where representative configurations of the centroid trajectories are plotted. We find that the orientational ordering of the starting structure is maintained in the classical MD simulation (Fig. 2(a) and (b)). Similarly, the initial orientational ordering is rather well preserved in the PIMD simulation with D (Fig. 2 (c) and (d)). Under the same conditions, but switching to the lighter H atom, we find that the orientational ordering is almost completely lost, as reflected by the spherical distributions seen in Fig. 2(e) and (f). Returning to the heavier D atom but increasing the temperature to 150 K, we again find a spherical trajectory distribution on a hcp lattice. These qualitative interpretations are supported by a detailed analysis of the probability distributions associated with the rotational freedom of the molecules. We calculate the angle between the projection of the molecules on the plane and the axis (inset of Fig. 3 (d)), and plot probability distributions of and the molecular bond length () for each simulation. The geometry-optimised -24 structure has molecules aligned between 30∘ and 50∘ and between 30∘ and 50∘. Two rather broad peaks are seen in the PIMD simulations for D at 50 K at about 40∘ (Fig. 3 (b)), which are consistent with restricted molecular rotation. On the other hand, either replacing D by H or raising the temperature to 150 K destroys the peak structure and leads to a probability distribution characteristic of a freely rotating molecular state (Fig. 3 (c) and (d)). These results show that the degree of orientational order is governed by a competition between the corrugation of the underlying PES, which favours rotational restriction, and the thermal and quantum nuclear fluctuations, which oppose it. We find no evidence for the “quantum localisation” reported in previous PIMD simulations. Kitamura_2000
Our results explain in a simple manner the positive slope () of the I/II coexistence line as well as the isotope-dependence of the transition pressure. The corrugation of the underlying PES increases with pressure and, as the pressure increases, higher temperatures are required to overcome the corrugation. The I/II transition for hydrogen occurs at a higher pressure than in deuterium for a similar reason; quantum effects are greater for hydrogen and so the corrugation of the underlying PES is more easily overcome by hydrogen than by deuterium. These results are consistent with the traditional understanding of the quantum nature of phase I. Mao_1994 ; Mazin_1997
III.3 Phase III
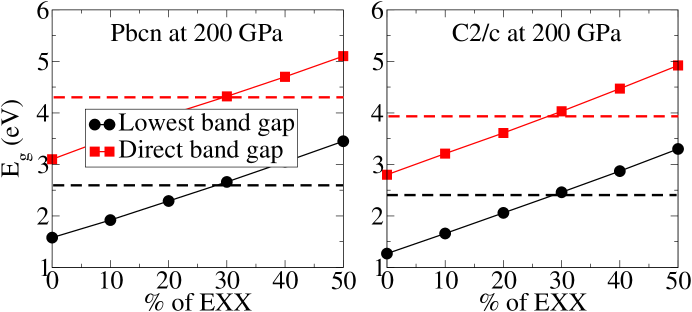
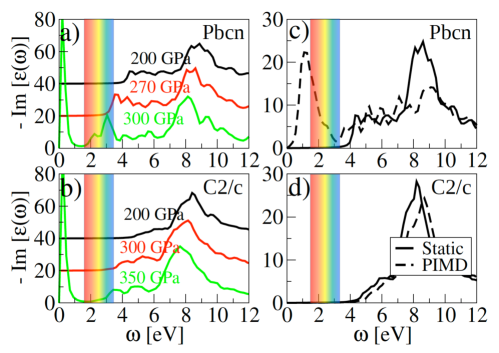
DFT structure searches Pickard_airss_2011 have so far provided a single best candidate for phase III: a layered structure with significant deviations from close packing within the layers. Pickard_2007 Other competitive structures were found, including an intriguing structure of symmetry which consists of alternate layers of strongly bonded and more weakly bonded molecules (see Fig. 3 of the supplementary information for Ref. Pickard_2007, ). has a lower ZP enthalpy than structures consisting entirely of strongly bonded molecules, and it might be favoured when ZP motion is taken into account. We therefore performed a number of simulations for both and . In particular, we focused on understanding whether either of these structures is consistent with the experimental observation that phase III is transparent up to 300 GPa, but becomes opaque by 320 GPa. Loubeyre_2002 To this end we calculated the band gap energies of the and structures using a many-body perturbation theory approach and the approximation to the self energy, and PBE0-like density functionals with different percentages of “exact-exchange” (EXX). PBE0 We found that using a hybrid density functional including 30% EXX reproduced the direct and lowest band gaps of the and structures obtained within theory (Fig. 4). This hybrid density functional was subsequently used to calculate the optical absorption spectra of the static lattice and structures at pressures between 200 and 350 GPa, see Fig. 5(a) and (b). The peaks in the absorption spectra correspond to strong inter-band transitions, and a non-zero imaginary part of the macroscopic dielectric function in the visible light range indicates that the material is to some extent opaque. The evolution of the absorption spectra shows that becomes opaque between 270 and 300 GPa (Fig. 5a), while turns opaque between 300 and 350 GPa (Fig. 5b). Considering the limited accuracy of the static pressure, the static-lattice absorption spectra of both and are in qualitative agreement with the experimental observations.
We now consider the changes in the absorption spectra induced by introducing thermal and quantum nuclear fluctuations. To this end we have performed PIMD simulations for H using 48-atom cells, starting from the and structures, at 100 K and 200 GPa, a pressure well within the stability range of phase III. These reveal that the structure maintains its original symmetry but the weak molecular layers evolve to atomic-like layers in which the nearest neighbour distances are approximately equal. When using the new PIMD structure to calculate the absorption spectra we find that is already opaque at 200 GPa (note the absorption peak within the visible light region in Fig. 5(c)). This is inconsistent with experiments on phase III which find that it remains transparent up to 300 GPa. However, in the PIMD simulations for the phase, the structure and consequently the absorption spectrum are only slightly altered compared with the original geometry-optimised structure (Fig. 5(d)). Therefore, unlike , remains transparent up to pressures as high as 300 GPa when thermal and quantum fluctuations are taken into account. Zha et al. zha recently reported synchrotron IR measurements for dense hydrogen, finding that the IR vibron of phase III persists up to at least 360 GPa. This behaviour is also reasonably consistent with the structure.
III.4 Discussion and Conclusions
From the previous discussion it is clear that our most promising candidate structure for phase II is -24, but we have insufficient evidence to identify it as the correct structure. The -24 structure is monoclinic, while experiments have suggested that phase II is hexagonal. Goncharenko_2005 Experiments on D2 have suggested that phase II is incommensurate Goncharenko_2005 , and in a theoretical study Biermann_1998a it was speculated that phase II of H2 might be “diffuse”, meaning that it does not correspond to a single classical structure. We assign space group symmetries to the static lattice structures, not to the structures found in the PIMD simulations which include nuclear motion. It is possible that the nuclear motion might reduce lattice distortions, similar to the way in which heating can lead to more symmetric structures, although such an effect was not apparent in our PIMD simulations. The differences between the results obtained with the PBE and optB88-vdW functionals indicate some sensitivity to the functional used, which must temper our confidence in the accuracy of DFT results for this system. In addition, our simulations do not account for nuclear exchange effects such as those that occur in ortho and para molecules, which are known to be important in a quantitative description of phase I and its transition to phase II igarashi ; goncharov ; freiman1 ; freiman2 . Notwithstanding these limitations, it is clear that quantum nuclear effects and molecular rotations play a very important role in the transition between phases I and II and the transition is strongly quantum in nature even when nuclear exchange is neglected.
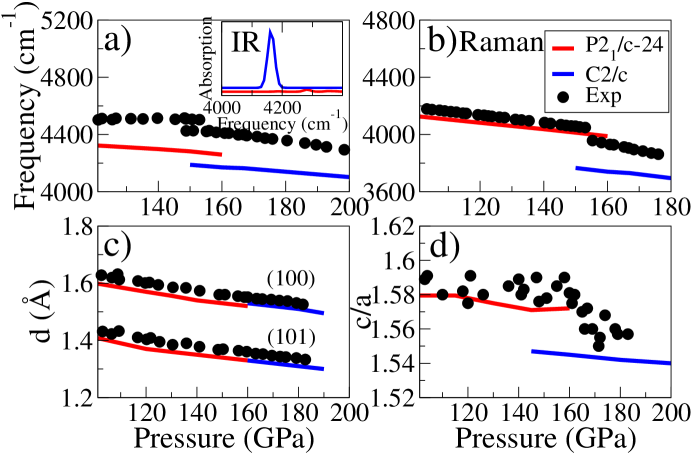
As the pressure increases the molecules rearrange with a significant distortion from close packing, so that the molecules can avoid one another. The difference in the thermal plus quantum motion of the two phases plays only a secondary role and the II/III transition is therefore only weakly dependent on the isotope and temperature. Based on the observation of persistent (100) and (101) X-ray diffraction peaks up to 180 GPa, Akahama et al. have concluded that any distortion from hcp packing in phase III is small. Akahama_2010 This appears to rule out the structure. However, we have calculated X-ray diffraction data assuming -24 for phase II and for phase III, finding the positions of the (100) and (101) peaks in the hcp lattice to be in very good agreement with experiment over a wide pressure range, Akahama_2010 see Fig. 6(c). We have also found the variation with pressure of the ratios of -24 and to be in good agreement with experiment, including the discontinuous drop at the II/III transition (Fig. 6(d)). Akahama_2010 The variations with pressure of the IR and Raman frequencies are well accounted for by the -24 and structures, see Fig. 6(a) and (b). The two ends of a molecule in the structure have different environments, so the molecules have dipole moments and the structure shows intense IR vibron activity (Fig. 6(a) inset), as found in experiments on phase III.
In conclusion, we have studied solid hydrogen at megabar pressures using a variety of ab initio techniques. The transition from phase I to II is governed by a competition between the corrugation of the underlying PES, which restricts molecular rotation, and the thermal and quantum nuclear fluctuations, which facilitate it. At very low pressures and temperatures the ZP motion washes out the corrugation of the PES and leads to the freely-rotating phase I for both isotopes. Including ZP motion destabilises the structure, which is therefore not a plausible candidate for phase II. Our simulations favour the proposal that phase II is a hcp-based rotationally restricted molecular phase with a large cell. Goncharenko_2005 The IR and Raman active vibron frequencies of the -24 structure are in good agreement with the experimental data for phase II. hanfland_1993 We also find that the (100) and (101) X-ray diffraction peak positions of -24 and , and their ratios, are in good agreement with experiment. Akahama_2010 The optB88-vdW Klimes_2010 density functional gives a II/III transition pressure in much closer agreement with experiment than PBE, and it moves the and -12 phases to higher enthalpies, so that the structure becomes the most stable phase up to about 300 GPa. Using the optB88-vdW functional therefore removes a major discrepancy between the theoretical and experimental phase diagrams. We have found that remains transparent up to 300 GPa, which provides further support for it as a model for phase III. Overall, our study provides evidence from a range of state-of-the-art theoretical methods which supports the picture of orientational ordering proposed by Mazin et al. Mazin_1997 and others. We have provided an atomic-level picture of the evolution of solid hydrogen under megabar pressures which satisfactorily explains some of the experimental results, and can be tested by further experimental and theoretical studies.
Acknowledgements.
This work was supported by the European Research Council and the EPSRC. XZL thanks Felix Fernandez-Alonso for helpful discussions on X-ray scattering. We are grateful for computational resources supplied by the London Centre for Nanotechnology, UCL Research Computing, and the UK’s national high performance computing service HECToR (for which access was obtained via the UKCP consortium, EP/F036884/1).References
- (1) H. K. Mao and R. J. Hemley, Rev. Mod. Phys. 66, 671 (1994)
- (2) J. M. McMahon, M. A. Morales, C. Pierleoni, and D. M. Ceperley, Rev. Mod. Phys. 84, 1607 (2012)
- (3) M. I. Eremets and I. A. Troyan, Nature Mater. 10, 927 (2011)
- (4) R. T. Howie, C. L. Guillaume, T. Scheler, A. F. Goncharov, and E. Gregoryanz, Phys. Rev. Lett. 108, 125501 (2012)
- (5) C. J. Pickard, M. Martinez-Canales, and R. J. Needs, Phys. Rev. B 85, 214114 (2012)
- (6) C. J. Pickard, M. Martinez-Canales, and R. J. Needs, Phys. Rev. B 86, 059902(E) (2012)
- (7) Y. Akahama, M. Nishimura, H. Kawamura, N. Hirao, Y. Ohishi, and K. Takemura, Phys. Rev. B 82, 060101 (2010)
- (8) I. I. Mazin, R. J. Hemley, A. F. Goncharov, M. Hanfland, and H. K. Mao, Phys. Rev. Lett. 78, 1066 (1997)
- (9) L. J. Cui, N. H. Chen, S. J. Jeon, and I. F. Silvera, Phys. Rev. Lett. 72, 3048 (1994)
- (10) I. F. Silvera and R. J. Wijngaarden, Phys. Rev. Lett. 47, 39 (1981)
- (11) F. Moshary, N. H. Chen, and I. F. Silvera, Phys. Rev. Lett. 71, 3814 (1993)
- (12) H. E. Lorenzana, I. F. Silvera, and K. A. Goettel, Phys. Rev. Lett. 64, 1939 (1990)
- (13) A. F. Goncharov, R. J. Hemley, and H. K. Mao, J. Chem. Phys. 134, 174501 (2011)
- (14) P. Loubeyre, F. Occelli, and R. LeToullec, Nature 416, 613 (2002)
- (15) C. J. Pickard and R. J. Needs, Nature Phys. 3, 473 (2007)
- (16) J. S. Tse, D. D. Klug, Y. Yao, Y. L. Page, and J. R. Rodgers, Solid State Commun. 145, 5 (2008)
- (17) J. Kohanoff, S. Scandolo, G. L. Chiarotti, and E. Tosatti, Phys. Rev. Lett. 78, 2783 (1997)
- (18) S. Biermann, D. Hohl, and D. Marx, J. Low Temp. 110, 97 (1998)
- (19) S. Biermann, D. Hohl, and D. Marx, Solid State Commun. 108, 337 (1998)
- (20) H. Kitamura, S. Tsuneyuki, T. Ogitsu, and T. Miyake, Nature 404, 259 (2000)
- (21) C. J. Pickard and R. J. Needs, Phys. Status Solidi (b) 246, 536 (2009)
- (22) D. Marx and M. Parrinello, Z. Phys. B (Rapid Note) 95, 143 (1994)
- (23) D. Marx and M. Parrinello, J. Chem. Phys. 104, 4077 (1996)
- (24) M. E. Tuckerman, D. Marx, M. L. Klein, and M. Parrinello, J. Chem. Phys. 104, 5579 (1996)
- (25) K. A. Johnson and N. W. Ashcroft, Nature 403, 632 (2000)
- (26) G. J. Martyna, A. Hughes, and M. E. Tuckerman, J. Chem. Phys. 110, 3275 (1999)
- (27) S. J. Clark, M. D. Segall, C. J. Pickard, P. J. Hasnip, M. J. Probert, K. Refson, and M. C. Payne, Z. Kristallographie 220, 567 (2005)
- (28) D. Vanderbilt, Phys. Rev. B 41, 7892 (1990)
- (29) S. Baroni, S. de Gironcoli, A. D. Corso, and P. Giannozzi, Rev. Mod. Phys. 73, 515 (2001)
- (30) D. R. Hamann, Phys. Rev. B 40, 2980 (1989)
- (31) N. Troullier and J. L. Martins, Phys. Rev. B 43, 1993 (1991)
- (32) J. P. Perdew, K. Burke, and M. Ernzerhof, Phys. Rev. Lett. 77, 3865 (1996)
- (33) J. Klimeš, D. R. Bowler, and A. Michaelides, J. Phys.: Condens. Matter 22, 022201 (2010)
- (34) G. Kresse and J. Furthmüller, Comput. Mat. Sci. 6, 15 (1996)
- (35) J. Klimeš, D. R. Bowler, and A. Michaelides, Phys. Rev. B 83, 195131 (2011)
- (36) P. E. Blöchl, Phys. Rev. B 50, 17953 (1994)
- (37) G. Kresse and D. Joubert, Phys. Rev. B 59, 1758 (1999)
- (38) W. Kraus and G. Nolze, Journal of Applied Crystallography 29, 301 (1996)
- (39) M. Dion, H. Rydberg, E. Schroder, D. C. Langreth, and B. I. Lundqvist, Phys. Rev. Lett. 92, 246401 (2004)
- (40) C. J. Pickard and R. J. Needs, J. Phys.: Condens. Matter 23, 053201 (2011)
- (41) C. Adamo and V. Barone, J. Chem. Phys. 110, 6158 (1999)
- (42) C. S. Zha, Z. X. Liu, and R. J. Hemley, Phys. Rev. Lett. 108, 146402 (2012)
- (43) I. Goncharenko and P. Loubeyre, Nature 435, 1206 (2005)
- (44) J. Igarashi, J. Phys. Soc. Jap. 59, 2811 (1990)
- (45) A. F. Goncharov, M. A. Strzhemechny, H. K. Mao, and R. J. Hemley, Phys. Rev. B 63, 064304 (2001)
- (46) Y. A. Freiman, S. Tretyak, A. Jezowski, and R. J. Hemley, J. Low Temp. Phys. 122, 537 (2001)
- (47) Y. A. Freiman, S. Tretyak, A. F. Goncharov, H. K. Mao, and R. J. Hemley, Low Temp. Phys. 37, 1038 (2011)
- (48) M. Hanfland, R. J. Hemley, and H. K. Mao, Phys. Rev. Lett. 70, 3760 (1993)