Cr-K Emission Line as a Constraint on the Progenitor Properties of Supernova Remnants
Abstract
We perform a survey of the Cr, Mn and Fe-K emission lines in young supernova remnants (SNRs) with the Japanese X-ray astronomy satellite Suzaku. The Cr and/or Mn emission lines are detected in 3C 397 and 0519-69.0 for the first time. We also confirm the detection of these lines in Kepler, W49B, N103B and Cas A. We derive the line parameters (i.e., the line centroid energy, flux and equivalent width [EW]) for these six sources and perform a correlation analysis for the line center energies of Cr, Mn and Fe. Also included in the correlation analysis are Tycho and G344.7-0.1 for which the Cr, Mn and Fe-K line parameters were available in the literature through Suzaku observations. We find that the line center energies of Cr correlates very well with that of Fe and that of Mn. This confirms our previous findings that the Cr, Mn and Fe are spatially co-located, share a similar ionization state, and have a common origin in the supernova nucleo-synthesis. We find that the ratio of the EW of the Cr emission line to that of Fe () provides useful constraints on the SNR progenitors and on the SN explosion mechanisms: for SNRs with , a type Ia origin is favored (e.g., N103B, G344.7-0.1, 3C 397 and 0519-69.0); for SNRs with , they could be of either core-collpase origin or carbon-deflagration Ia origin.
1 Introduction
The ejecta in young supernova remnants (SNRs) are usually metal-rich, and thus their X-ray spectra often show abundant emission lines of heavy elements (e.g., O, Ne, Mg, Si, S, Ar, Ca and Fe; see Vink 2012). The detection of the Cr and Mn K lines in the X-ray spectra of SNRs has opened a new window to study their progenitors and the explosion machanism of supernovae (SNe) (Badenes et al. 2008a; Yang et al. 2009). Badenes et al. (2008a) proposed that the metallicity of the progenitors of Type Ia SNe can be measured from the Mn and Cr lines in the X-ray spectra of young SNRs. Based on this method, Badenes et al. (2008a,b) obtained the metallicity of the progenitor of Tycho and probably that of W49B as well.
Previously, we performed a Cr-K emission line survey in young SNRs with the Chandra archival data (Yang et al. 2009, hereafter Y09). We reported the discovery of the Cr emission lines in W49B, Cas A, Tycho and Kepler. We found a good positive correlation between the line center energy of Cr and that of Fe which suggests a common origin of Cr and Fe in the SN nucleosynthesis. We also proposed that the ratio of the equivalent width (EW) of the Cr emission line to that of Fe () could be used as a valid criterion for SN classification. However, the sample (of four SNRs) is small in size and is based on a single mission (i.e. Chandra). A larger sample and measurements from other missions would be helpful for confirming our previous findings.
Due to the high sensitivity and low background above 4 keV of the X-ray Imaging Spectrometor (XIS) onboard Suzaku (Koyama et al. 2007; Mitsuda et al. 2007), it is an ideal instrument to study the X-ray spectra of these so-called secondary Fe-peak elements (i.e., Cr, Mn and Fe) of SNRs. In fact, Suzaku has detected the weak Cr and/or Mn lines in Cas A (Maeda et al. 2009), Tycho (Tamagawa et al. 2009), Kepler (Park et al. 2012), W49B (Ozawa et al. 2009), N103B (Yamaguchi & Koyama 2010), and marginally in G344.7-0.1 (Yamaguchi et al. 2012). In this work, by using the Suzaku/XIS data, we study the Cr and Mn emission properties of the above six SNRs and other two SNRs 3C 397 and 0519-69.0. The new results are used to test our previous discoveries.
In §2 we present the spectral analyses and results. We discuss the spatial and ionization-state correlations between Cr and Fe and those between Cr and Mn in §3. In §4 we discuss the explosion mechanism and the progenitor properties of Tycho, 0519-69.0, N103B, G344.7-0.1, Kepler, 3C 397, Cas A and W49B based on the equivalent width ratio of Cr to Fe (). A summary is given in §5. All through this paper, the uncertainties are given at 90% confidence level.
2 Data Analysis and Results
2.1 Data Description and Reduction
To study these secondary Fe-peak elements, we have attempted to search for an as complete as possible set of Suzaku/XIS data on SNRs. To this end, we have selected six SNRs, including Kepler, W49B, N103B and Cas A (in which the Cr and/or Mn-K lines have already been reported), and 3C 397 and 0519-69.0 (in which these lines have not previously been detected). We summarize in Table 1 the Suzaku data employed in this paper. The spectral analysis was not performed for Tycho since Tamagawa et al. (2009) already carried out a detailed analysis and reported the parameters of the Cr, Mn and Fe K lines. We also note that Yamaguchi et al. (2012) reported a marginal detection of the Cr and Mn lines in G344.7-0.1. These two SNRs will be included in our analysis. Therefore, our sample consists of eight SNRs.
| Target | ObsID | Obs-date | |
| Kepler | KP∗ | 450 | 2010/092011/08 |
| W49B | 503084010 | 50 | 2009/03 |
| 504035010 | 53 | 2009/0304 | |
| N103B | 100013010 | 27 | 2005/08 |
| 804039010 | 210 | 2009/122010/01 | |
| Cas A | 100043020 | 14 | 2006/02 |
| 3C 397 | 505008010 | 61 | 2010/10 |
| 0519-69.0 | 806026010 | 276 | 2011/08 |
Key Project, Observation IDs include 505092010, 505092020, 505092030, 505092040, 505092050, 505092060, 505092070.
The archival data are processed with HEASOFT version 6.6 and calibration database released on 2010 January 23, following the standard criteria.111http://heasarc.nasa.gov/docs/suzaku/processing/criteria_xis.html.
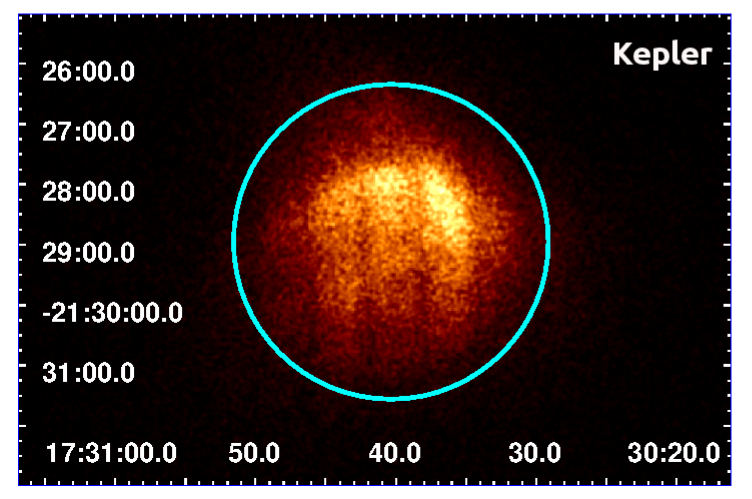
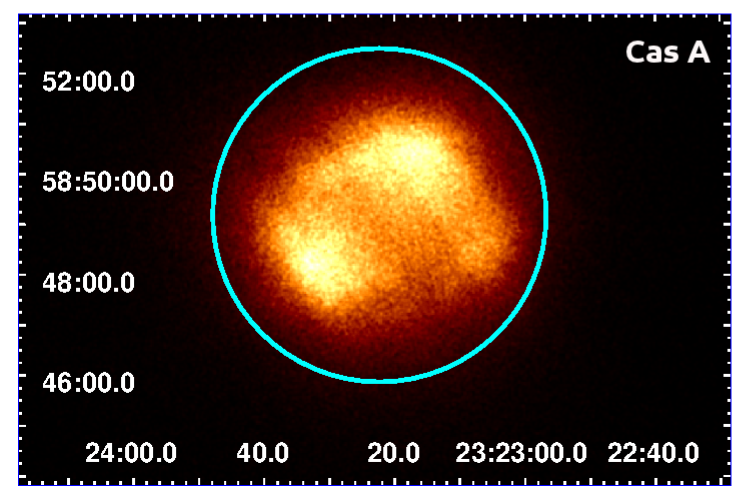
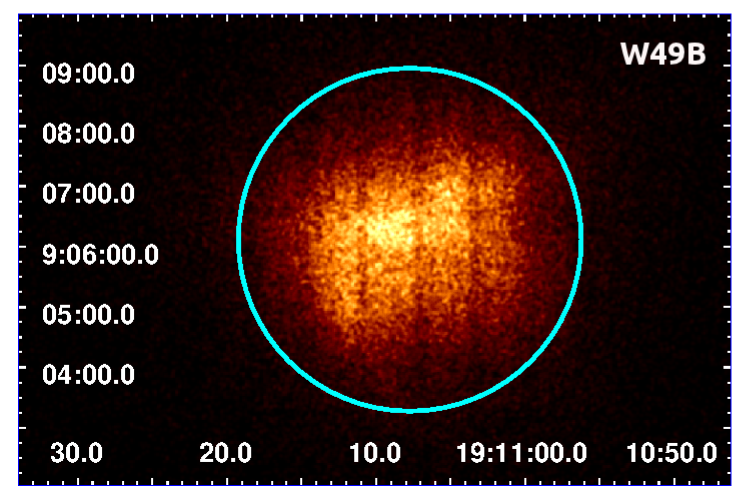
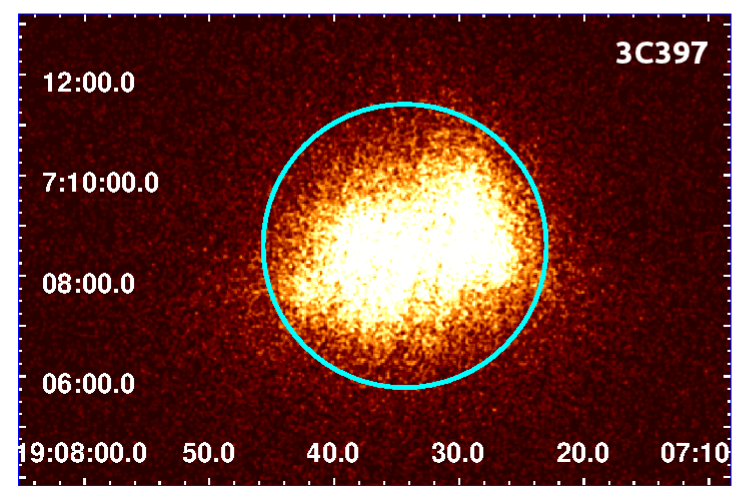
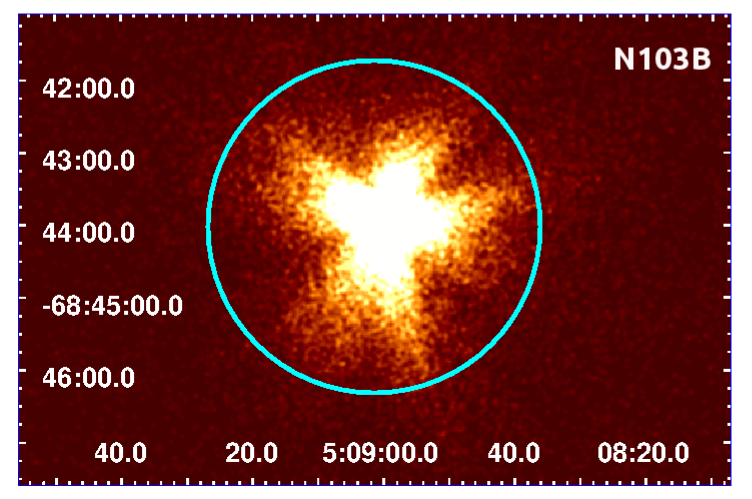
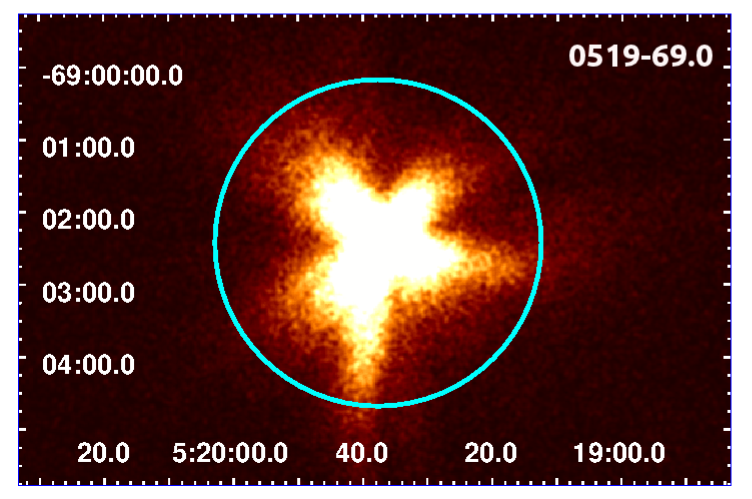
Figure 1 shows the XIS-0 images of these six SNRs. The X-ray spectra are extracted from almost the entire remnant, as illustrated in Figure 1. The background spectra are extracted from the off-source annulus regions with an area comparable to that of the corresponding source. For those SNRs with several observations, we first generate the source and background spectra as well as the corresponding response matrix (RMFs and ARFs) for each XIS sensor and each observation, and then combine them with addascaspec. Since we aim at the weak emission lines, the spectra of the front-illuminated sensors and that of the back-illuminated sensors222We note that other than XIS-0, XIS-1 and XIS-3, XIS-2 data is only available for obs-ID 100013010 and 100043020. are added together in order to obtain the best statistics. The spectra fitting is done with XSPEC version 11.3.2 (Arnaud 1996).
2.2 Spectral Analysis and Results
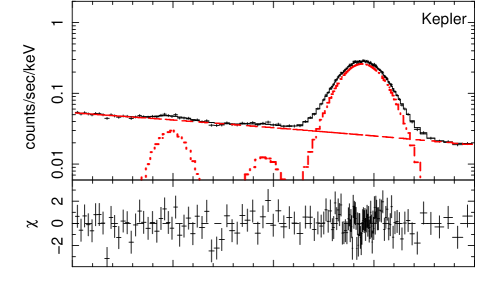
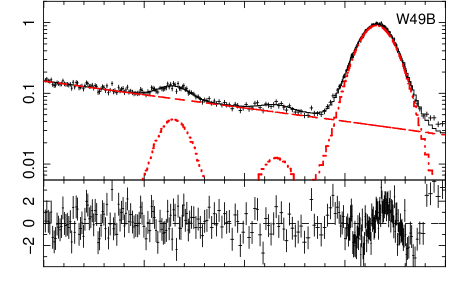
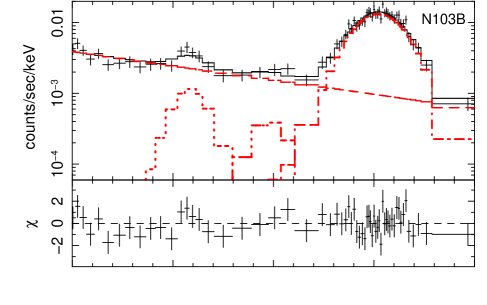
The overall spectra of these six SNRs are shown in Figure 2. Similar to Y09 in which the Chandra data were analyzed, we focus on the 5.0–7.0 spectra for detailed analysis of the Cr, Mn and Fe K-lines. All the spectra are fitted with a power law plus multi-Gaussian components to account for the continuum and line emissions, respectively.


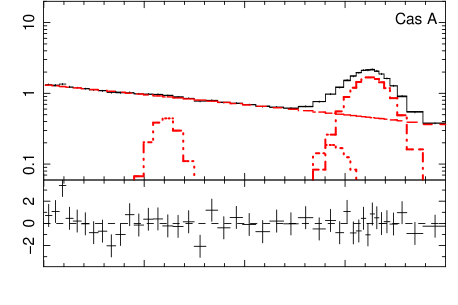
The Suzaku and/or Chandra observations have already detected the Cr and/or Mn emission lines above 5 in Kepler (Park et al. 2012), W49B (Ozawa et al. 2009), N103B (Yamaguchi & Koyama 2010) and Cas A (Maeda et al. 2009). For Kepler, W49 B and N103B, a power law and three Gaussian components are introduced to account for the continuum, and the Cr, Mn and Fe line emission, respectively. The situation for Cas A is different. We previously found that two Gaussian components were needed to describe the Chandra Fe-K emission of Cas A, which might be due to the Doppler shift variation across the remnant (Y09). This is also true for the Suzaku spectrum of Cas A: if we approximate the Fe-K emission line by only one Gaussian component, the reduced is 92.7/37, whereas the reduced becomes 35.4/34 if we take two Gaussian components. Therefore we take two Gaussian lines to account for the Fe-K emission of Cas A. For these two Gaussian components, the fitted centroid energies are and , with their widths being and respectively.
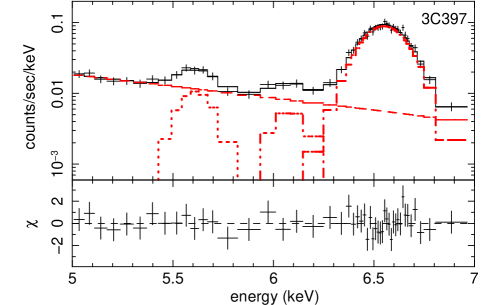
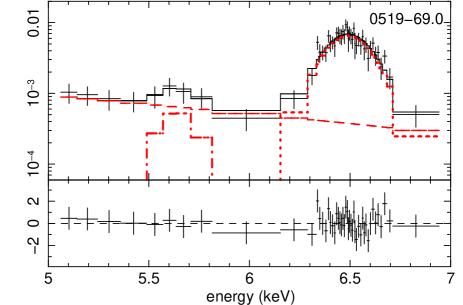
For 3C 397 and 0519-69.0, the 5.0–7.0 spectra are first fitted with a power law (for the continuum emission) plus one gaussian component (for the Fe-K line). From the residual map, we see one bump around 5.6 in 0519-69.0 and two line-like structures around 5.6 and 6.1 in 3C 397. For 3C 397, the inclusion of a Gaussian component near 5.6 leads to a decrease of the reduced , from 132.6/44 to 58.1/41. The addition of another Gaussian component near 6.1 leads to a further decrease of the reduced to 30.4/38. Similarly, for 0519-69.0 the reduced decreases from 35.0/43 to 28.9/40 if a Gaussian component near 5.6 is added. Therefore, the 5.0–7.0 spectrum of 3C 397 (0519-69.0) is fitted with a power law plus three (two) Gaussian components. The structure near 5.6 is due to the Cr-K line, while the one near 6.1 arises from the Mn-K line (see Y09).
Figure 3 shows the 5.0–7.0 spectra along with the model fits (as well as the residuals) of Kepler, W49B, N103B, Cas A, 3C 397 and 0519-69.0. The best fit parameters of the Cr, Mn and Fe-K emission lines are listed in Table 2. For Cas A in which the Fe-K line is fitted in terms of two Gaussian components, the centroid energy is the emission-weighted mean value, while the flux and EW are the sums of the two Gaussian lines. For Tycho and G 344.7-0.1, the parameters are taken from Tamagawa et al. (2009) and Yamaguchi et al. (2012).
| Kepler | W49B | N103B | Cas A | 3C 397 | 0519-69.0 | Tycho† | G344.7-0.1‡ | ||
| Type | Ia (?) | C-Cd (?) | Ia (?) | C-C | Ia (?) | Ia | Ia | Ia (?) | |
| Cr | centroida | 5490 | 5655 | 5586 | 5610 | 5613 | 5644 | 5480 | 5526 |
| fluxb | 0.50 | 4.5 | 0.16 | 3.4 | 1.46 | 0.08 | 2.45 | 0.36 | |
| EWc | 22.7 | 96.3 | 116 | 8.6 | 198 | 206 | 23.8 | ||
| Mn | centroida | 5960 | 6161 | 6020 | 6084 | 5950 | 6085 | ||
| fluxb | 0.27 | 1.5 | 0.10 | 0.88 | 0.24 | 1.1 | |||
| EWc | 15.0 | 44.7 | 84.5 | 158 | 13.7 | ||||
| Fe | centroida | 6448 | 6662 | 6528 | 6613 | 6556 | 6496 | 6445 | 6447 |
| fluxb | 39.9 | 127 | 3.3 | 247 | 18.8 | 1.3 | 69.1 | 2.8 | |
| EWc | 2680 | 5378 | 4370 | 871 | 4490 | 4930 | 1040 | ||
| Suzaku | 0.85% | 1.8% | 2.7% | 0.99% | 4.4% | 4.2% | 2.3% | % | |
| Chandrae | 0.63% | 1.6% | 0.85% | 3.6% | |||||
a Line center in unit eV
b Flux in unit:
c Eqivalent Width in unit eV
d C-C stands for core-collapse
† Tamagawa et al. 2009
‡ Yamaguchi et al. 2012.
The EWs are from private communications
with H. Yamaguchi
e The Chandra values are taken from Y09
3 Spatial and Ionization State Correlations between Cr, Mn and Fe
The Cr, Mn and Fe-K line parameters derived here from Suzaku for Kepler, W49B, N103B and Cas A (Table 3) are generally consistent with those from Chandra (see Table 2 in Y09) and/or previous studies from Suzaku (Tamagawa et al. 2009; Ozawa et al. 2009; Yamaguchi & Koyama 2010; Park et al. 2012;). We suggest that the different line center energies of the Cr-K lines in these SNRs reflect the different ionization states of Cr (Y09). The Cr line center energies in N 103B and G 344.7-0.1 reveal their ionization states to be Be- and B-like, respectively (Hata & Grant 1984; also see Table 4 in Y09). The Cr line centroids of 3C 397 and 0519-69.0 are higher than those of N 103B or G 344.7-0.1, implying higher ionization states (i.e., Li- and He-like).
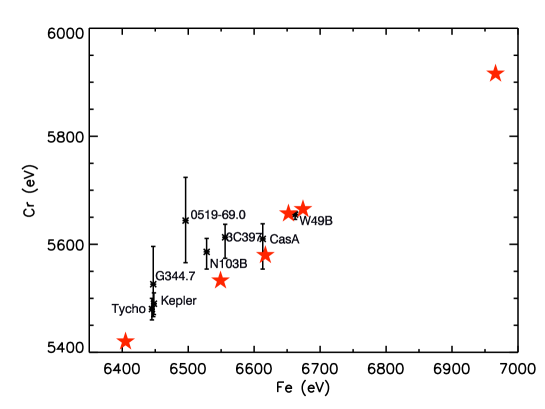
In Figure 4, we plot the line center energies of Fe-K against those of Cr-K in all eight SNRs listed in Table 2. It is seen that these two sets of line center energies closely correlate, with a correlation coefficient of . This further confirms that Cr and Fe are basically in similar ionization states in these SNRs. We note that such a close correlation was already seen in Y09, but for a smaller sample (of 4 SNRs).
Thanks to the high sensitivity of Suzaku/XIS, the Cr and Mn-K lines are for the first time simultaneously detected in several SNRs of this sample, including Tycho, Kepler, W49B, N 103B, G 344.7-0.1 and 3C 397. In Figure 5 we plot the line center energy of Cr against that of Mn for these SNRs. It is apparent that there exists a positive correlation between the centroid energies of these two lines, with a correlation coefficient of . Since the line center energy is closely related to the ionization age of the emitting plasma, such a positive correlation implies that Cr and Mn also share a similar ionization age, just as Cr and Fe in the SNRs.
Based on the nucleosynthesis models (Nomoto et al. 1984; Woosley & Weaver 1994; Woosley et al. 1995), the most abundant isotope of chromium (i.e. 52Cr) is the product of 52,53Fe decay during explosive silicon burning, whereas the single isotope of manganese, 55Mn, is produced mostly in explosive silicon burning and nuclear statistical equilibrium as 55Co. The most abundant Fe, 56Fe, is decayed from 56Ni, which is also produced mainly from explosive silicon burning. Since Cr, Mn and Fe are all made in the same nucleosynthesis process, it is natural that they located near each other and thus in a similar ionization state.

4 Can SN Explosion Be Classified According to ?
Theoretically, the production of Cr and Fe varies with the nature of the SN progenitors and the explosion mechanisms. Generally speaking, core-collapse SNe cannot produce as much Cr as type Ia SNe, and the theoretical Cr-to-Fe mass ratio is often less than 2% for core-collapse SNe (Woosley et al. 1995, Thielemann et al. 1996, Maeda et al. 2003). Theoretical calculations also suggest that the more massive a progenitor is, the more Cr it will produce (Nakamura et al. 1999). We note that these calculations have not taken neutrino process into account. This could affect the yields of the Fe group nuclei. With the neutrino process taken into account, Fröhlich et al. (2006) found that the abundances of heavy elements, especially Co, Ni, Cu, Zn, with respect to Fe, are appreciably different from those calculated by Thielemann et al. (1996). However, the relative abundances of Cr and Mn to Fe are generally in agreement (see Figure 8 of Fröhlich et al. 2006).
The Cr-to-Fe mass ratio of Type Ia SNe differs significantly among SNe of different explosion mechanisms: small for carbon deflagration explosion and large for delayed-detonation explosion (Nomoto et al. 1997, Iwamoto et al. 1999). For the delayed-detonation model, decreases as the transition density increases. We note that the synthesized masses of Cr and Fe predicted from the two-dimensional simulations on delayed-detonation models as well as the two- and three-dimensional simulations on pure deflagration models (Travaglio et al. 2004, Maeda et al. 2010) could differ by a factor of 2 from those predicted from the one-dimensional simulations (Nomoto et al. 1997, Iwamoto et al. 1999). However the mass ratio () is generally consistent with each other, i.e, M(Cr)/M(Fe) 1% for pure deflagration models and 1.5% for delayed-detonation models.
Based on Chandra data, we propose that one could use of SNRs to constrain the the corresponding SN explosion mechanisms. As discussed in Y09 and earlier in this paper, Cr and Fe are spatially co-located, and thus share the same ionization state, temperature and ambient electron density. Therefore, , the ratio of the EW of the Cr emission line to that of Fe should reflect the corresponding mass ratio ().
From Table 2 we can see that the available ratios from Chandra are generally consistent with the corresponding Suzaku values within the confidence range. In the following we will further explore this, based on Suzaku data.
As a single-degenerate Type Ia SNR (Lu et al. 2011), Tycho is considered to originate from a delayed detonation explosion with a relatively small transition density, based on the EW ratio of Cr to Fe (Y09). The Suzaku value of derived here is generally consistent with that of Chandra within uncertainty, supporting the delayed-detonation explosion scenario for the explosion mechanism of Tycho’s progenitor, with the transition density (Nomoto et al. 1997; Iwamoto et al. 1999).
SNR 0519-69.0 is confidently known to originate from SN Ia based on its light echoes (Rest et al. 2005, 2008) and X-ray spectra (Hughes et al. 1995). Recent studies show that it may originate either from a supersoft source of single-degenerate scenario or from a double-degenerate system (Edwards et al. 2012), with the latter (to our knowledge) not well studied in current theoretical calculations. Its large Cr-to-Fe EW ratio favors the delayed-detonation scenario with transition density of .
N103B tends to be classified as a remnant of SN Ia (Badenes et al. 2007 and reference therein), although a core-collapse origin cannot be ruled out (van der Heyden et al. 2002). However, ASCA observations show that it has strong K lines from Si, S, Ar, Ca, and the calculated nucleosynthesis yields are qualitatively inconsistent with the core-collapse scenario (Hughes et al. 1995). Based on Chandra ACIS data, Lewis et al. (2003) found that the distribution of the ejecta and the yields of the intermediate-mass species are consistent with the model predictions for Type Ia events. Such a (Type Ia) classification is further supported by the emission morphology of the X-ray lines (Lopez et al. 2009).333Nevertheless, the XMM-Newton and Chandra spectra show a high elemental abundance of O and Ne and low abundance of Fe, which implies that N103B might originate from a type II SN rather than type Ia (van der Heyden et al. 2002). The EW ratio of Cr-to-Fe of N103B, , is similar to (but somewhat slightly larger than) that of Tycho. Since theoretical models predict the mass ratio of Cr-to-Fe often to be for core-collapse SNe (Woosley et al. 1995, Thielemann et al. 1996, Maeda et al. 2003), we favor the SN Ia origin for N103B. If this is indeed the case, such a ratio would imply that a delayed-detonation model would be required during its explosion, and the transition denstity would be similar to (but slightly smaller than) that of Tycho, since the theoretical calculations suggests that the ratio decreases as the transition density increases (Nomoto et al. 1997, Iwamoto et al. 1999, Travaglio et al. 2004, 2005).
G344.7-0.1 is suggested to be a core-collapse SNR from many observational results. There appears to be a point-like source at its geometrical center, although it might be a foreground object (Combi et al. 2010). The SNR is also associated with a nearby molecular cloud or a wind-blown bubble (Combi et al. 2010; Giacani et al. 2011). Furthermore, its highly asymmetric X-ray line emission morphology is similar to other core-collapse SNRs (Lopez et al. 2011). However, Yamaguchi et al. (2012) presented an X-ray spectroscopic study of this SNR using Suzaku, which favors a type Ia origin. They found that its abundance pattern is highly consistent with that expected for a somewhat-evolved type Ia SNR. They further indicated that G344.7-0.1 is the first possible type Ia SNR categorized as a member of the so-called “mixed-morphology” class. Its large also supports an Ia origin (Woosley et al. 1994). Nevertheless, we note here that the detection of the Cr-K line in G344.7-0.1 is marginal and the line paramters are with large uncertainties (Yamaguchi et al. 2012). Deeper observation of this SNR would lead to better-constrained line parameters and thus a clarification of its origin.
For Kepler, the O/Fe ratio observed in the X-ray spectrum (Reynolds et al. 2007) and the X-ray line emission morphology (Lopez et al. 2011) favors a Type Ia origin. More recently, Patnaude et al. (2012) performed hydrodynamical and spectral modeling to constrain the origin of the Kepler SNR. They found that the delayed-detonation model interacting with a wind provides a good match both spectrally and dynamically. If we assume a Type Ia origin for Kepler, its small EW ratio of Cr-to-Fe () would imply a carbon deflagration model without detonation.
The classification of 3C 397 is not conclusive. Chen et al. (1999) argued that the cloudlet environment around this SNR favors a type Ia origin. They also suggested that the bipolar bubble structure seen in its X-ray image might be formed through mass accumulation, which would be the case for a SN Ia progenitor of mass-losing binary system. Meanwhile, a compact object is not detected, either in X-ray or in radio (Safi-Harb et al. 2005). The large EW ratio of Cr-to-Fe of derived here also favors a type Ia classification, as core-collapse SNe often yield relatively small mass ratio of Cr-to-Fe (). As discussed above, the large ratio of 3C 397 requires detonation. With its ratio being similar to SNR 0519-69.0, 3C 397 may also have a transition density similar to SNR 0519-69.0 ( ). Based on multiwavelength imaging and spectral studies, Safi-Harb et al. (2005) argued that 3C 397 will evolve into a mix-morphology SNR. If so, 3C 397 would be another type Ia in the “mixed-morphology” SNR category, just like G344.7-0.1.
For the core-collapse SNR Cas A, its ratio supports a progenitor mass of 15–25 and an asymmetric explosion scenario.
W49B tends to be classified as a core-collapse SNR (Miceli et al. 2006; Keohane et al. 2007). This is supported by Y09 from its EW ratio and by Lopez et al. (2009) from its X-ray line emission morphology. Ozawa et al. (2009) detected the over-ionized plasma in W49B with Suzaku. They argued that a massive progenitor that had blown a stellar wind would be favored, if the origin of the plasma is via the cooling caused when the blast wave breaks out of some ambient matter into the rarefied interstellar medium. Nevertheless, Hwang et al. (2000) suggested a type Ia origin based on the relative abundance of Mg, S, Ar, Ca, Fe and Ni to S. Badenes et al. (2008b) suggested that if one assumes a Type Ia explosion mechanism for W49B, its Mn/Cr ratio could imply a metalicity of for its progenitor.
Its ratio of 1.8% derived here suggests either a core-collapse origin or a SN Ia of delayed-detonation explosion. Woosley et al. (1995) found that the more massive a progenitor is, the more amount of Cr will be produced. Assuming W49B to be of core-collapse origin, we would expect a much larger progenitor mass for W49B compared to that of Cas A, as the EW of the Cr emission line (often considered as a valid representation of the Cr abundance) of W49B is ten times that of Cas A. If one assumes a SN Ia origin, its ratio (of 1.8%) implies a relatively large deflagration-detonation transition density, .
Finally, we note that the above discussions are based on the overall mass ratio of Cr to Fe in SNRs. The X-ray emission from young SNRs is however prominent only above the reverse shock, [e.g., in Tycho, Warren et al. (2005) assumed that the Fe-K emission originates from the inner most position of the shocked ejecta and located the reverse shock at its inner edge; in Cas A, Gotthelf et al. (2001) and Helder & Vink (2008) placed the reverse shock at the location where a sharp rise in X-ray emissivity with increasing radius occurs]. As discussed in §3 and §4.1 of Y09, Cr and Fe are in similar ionization states and well mixed, so the observed ratio should be a good indicator of the overall mass ratio of Cr to Fe for the remnant as a whole. Therefore, our conclusion should be reliable no matter where the reverse shock is and how much ejecta have been overtaken.
5 Summary
We perform a Suzaku X-ray spectroscopic analysis of the Cr, Mn and Fe-K emission lines in young SNRs. The principal results of this work are the following:
-
1.
The detection of the Cr and/or Mn lines are reported, for the first time, in 3C 397 and 0519-69.0, and confirmed in Kepler, W49B, N103B and Cas A.
-
2.
The line parameters (i.e., the centroid energy, flux and equivalent width) are derived for these six sources.
-
3.
We perform a correlation analysis between the line center energies of Cr, Mn and Fe-K for these six sources together with Tycho and G344.7-0.1 of which the Cr, Mn and Fe-K line parameters are available in the literature. We find a positive correlation between the Cr and Fe-K line center energies, as found previously in Y09 based on Chandra data of four SNRs. Such a positive correlation is also found between the Cr and Mn-K line centroids. This supports the common origin of Cr, Mn and Fe in the SN nucleosynthesis, and suggests that they are spatially co-located.
-
4.
The EW ratio of Cr-to-Fe (), a good representation of the Cr-to-Fe mass ratio () of the SNR, provides useful constraints on its progenitor and the SN explosion mechanism. For Tycho (Type Ia), 0519-69.0 (Type Ia) and Cas A (core-collapse), the derived EW ratios are consistent with their classification. The large ratios derived for N103B, G344.7-0.1 and 3C397 suggest a Type Ia SN explosion as their origins. For the putative type Ia SNRs Kepler, its small ratio suggests either a carbon deflagration explosion or a core-collapse origin (which needs to be further explored). For W49B, its ratio suggests that either it is of core-collpase origin with a very massive progenitor, or it is of Type Ia origin with a relatively large detonation-deflagration transition density.
References
- Arnaud (1990) Arnaud, K. A. 1996, ASPC, 101, 17
- Badenes et al. (2008a) Badenes, C., Bravo, E., & Hughes, J. P. 2008a, ApJ, 680, L33
- Badenes et al. (2008b) Badenes, C., Bravo, E., & Hughes, J. P. 2008b, ApJ, 680, 1149
- Badenes et al. (2008c) Badenes, C., Hughes, J. P., Bravo, E., & Langer, N. 2007, ApJ, 662, 472
- Combi et al. (2010) Combi, J. A., Albacete Colombo, J. F., López-Santiago, J., Romero, G. E., Sánchez-Ayaso, E., Martí, J., Luque-Escamilla, P. L., Pérez-Gonzalez, P. G., Muñoz-Arjonilla, A. J., & Sánchez-Sutil, J. R. 2010, A&A, 522, 50
- chen et al. (1999) Chen, Y., Sun, M., Wang, Z. R., & Yin, Q. F. 1999, ApJ, 520, 737
- Edwards et al. (2012) Edwards, Z. I., Pagnotta, A., & Schaefer, B. E. 2012, ApJ, 747, L19
- Frohlich et al. (2006) Fröhlich, C., Hauser, P., Liebendörfer, M., Martínez-Pinedo, G., Thielemann, F.-K. et al. 2006, ApJ, 637, 415
- Giacani et al. (2011) Giacani, E., Smith, M. J. S., Dubner, G., & Loiseau, N. 2011, A&A, 531, 138
- Gotthelf et al. (2001) Gotthelf, E. V., Koralesky, B., Rudnick, L., Jones, T. W., Hwang, U., & Petre, R. 2001, ApJ, 552, L39
- Heta et al. (1984) Hata, J., & Grant, I. P. 1984, MNRAS, 211, 549
- Helder et al. (2008) Helder, E. A., & Vink, J. 2008, ApJ, 686, 1094
- Hughes et al. (1995) Hughes, J. P., Hayashi, I., Helfand, D., Hwang, U., Itoh, M., Kirshner, R., Koyama, K., Markert, T., Tsunemi, H., & Woo, J. 1995, ApJ, 444, L81
- Hwang et al. (2000) Hwang, U., Petre, R., Hughes, J. P. 2000, ApJ, 532, 970
- Iwamoto et al. (1999) Iwamoto, K., Brachwitz, F., Nomoto, K., Kishimoto, N., Umeda, H., Hix, W. R., & Thielemann, F-K 1999, ApJS, 125, 439
- Koyama et al. (2007) Koyama, K., Tsunemi, H., Dotani, T., Bautz, M. W., Hayashida, K. et al. 2007, PASJ, 59, S23
- Lewis et al. (2003) Lewis, K. T., Burrows, D. N., Hughes, J. P., Slane, P. O., Garmire, G. P., & Nousek, J. A. 2003, ApJ, 582, L770
- Lopez et al. (2009) Lopez, L. A., Ramirez-Ruiz, E., Badenes, C., Huppenkothen, D., Jeltema, T. E., & Pooley, D. A. 2009, ApJ, 706, L106
- Lu et al. (2011) Lu, F. J., Wang, Q. D., Ge, M. Y., Qu, J. L., Yang, X. J., Zheng, S. J., & Chen, Y 2011, ApJ, 732, L11
- Maeda et al. (2003) Maeda, K., & Nomoto, K. 2003, ApJ, 598, 1163
- Maeda_a et al. (2009) Maeda, Y., Uchiyama, Y., Bamba, A., Kosugi, H., Tsunemi, H. et al, 2009, PASJ, 61, 1217
- Maeda_b et al. (2010) Maeda, K., Röpke, F. K., Fink, M., Hillebrandt, W., Travaglio, C., & Thielemann, F.-K., 2010, ApJ, 712, 624
- Mitsuda et al. (2007) Mitsuda, K., Bautz, M., Inoue, H., Kelley, R. L., Koyama, K. et al. 2007, PASJ, 595, S1
- Nakumara et al. (1999) Nakamura, T., Umeda, H., Nomoto, K., Thielemann, F., & Burrows, A. 1999, ApJ, 51, 193
- Nomoto et al. (1984) Nomoto, K., Thielemann, F.K., & Yokoi, K. 1984, ApJ, 286, 644
- Nomoto_a et al. (1997) Nomoto, K., Iwamoto, K., Nakasato, N., Thielemann, F.-K., Brachwitz, F., Tsujimoto, T., Kubo, Y., & Kishimoto, N. 1997, NuPhA, 621, 467
- Ozawa et al. (2009) Ozawa, M., Koyama, K., Yamaguchi, H., Masai, K., & Tamagawa, T. 2009, ApJ, 706, L71
- Park et al. (2012) Park, S., Badenes, C., Hughes, J. P., Slane, P. O., Mori, K., Kaida, R., Burrows, D. N., Lee, Jae-Joon 2012, AIPC, 1427, 87
- Patnaude et al. (2012) Patnaude, D. J., Badenes, C., Park, S., & Laming, J. M. 2012, ApJ, 756, 6
- Rest et al. (2005) Rest, A., Suntzeff, N. B., Olsen, K., Prieto, J. L., & Smith, R. C. 2005, Nature, 438, 1132
- Rest_a et al. (2008) Rest, A., Matheson, T., Blondin, S., Bergmann, M., Welch, D. L. et al. 2008, ApJ, 680, 1137
- Reynolds et al. (2007) Reynolds, S. P., Borkowski, K. J., Hwang, U., Hughes, J. P., Badenes, C., Laming, J. M., & Blondin, J. M. 2007, ApJ, 668, L135
- Safi et al. (2005) Safi-Harb, S., Dubner, G., Petre, R., Holt, S. S., & Durouchoux, P. 2005, ApJ, 618, 321
- Tamagawa et al. (2009) Tamagawa, T., Hayato, A., Nakamura, S., Terada, Y., Bamba, A. et al. 2009, PASJ, 61, S167
- Thielemann et al. (1996) Thielemann, F.-K, Nomoto, K., & Hashimoto, M. 1996, ApJ, 460, 408
- Travaglio et al. (2004) Travaglio, C., Hillebrandt, W., Reinecke, M., & Thielemann, F.-K. 2004, A&A, 425, 1029
- Travaglio_a et al. (2005) Travaglio, C., Hillebrandt, W., & Reinecke, M. 2005, A&A, 443, 1007
- Heyden et al. (2002) van der Heyden, K. J., Behar, E., Vink, J., Rasmussen, A. P., Kaastra, J. S., Bleeker, J. A. M., Kahn, S. M., & Mewe, R. 2002, A&A, 392, 955
- Vink (2012) Vink, J. 2012, A&ARv, 20, 49
- Warren et al. (2005) Warren, J. S., Hughes, J. P., Badenes, C., Ghavamian, P., McKee, C. F. et al. 2005, ApJ, 634, 376
- Woosley et al. (1994) Woosley, S. E., & Weaver, T. A. 1994, ApJ, 423, 371
- Woosley_a et al. (1995) Woosley, S. E., Langer, N., & Weaver, T. A. 1995, ApJ, 448, 315
- Woosley_b et al. (1995) Woosley, S. E., & Weaver, T. A. 1995, ApJS, 101, 181
- Yamaguchi et al. (2010) Yamaguchi, H., & Koyama, K. 2010, MmSAI, 81, 382
- Yamaguchi_a et al. (2012) Yamaguchi, H., Tanaka, M., Maeda, K., Slane, P. O., Foster, A., Smith, R. K., Katsuda, S., Yoshii, R. 2012, ApJ, 749, 137
- Yang et al. (2009) Yang, X. J., Tsunemi, H., Lu, F. J., & Chen, L. 2009, ApJ, 692, 894