Precise high-cadence time series observations of five variable young stars in Auriga with MOST***Based on data from the MOST satellite, a Canadian Space Agency mission, jointly operated by Systems Canada Inc. (MSCI), formerly part of Dynacon, Inc., the University of Toronto Institute for Aerospace Studies, and the University of British Columbia with the assistance of the University of Vienna.
Abstract
To explore young star variability on a large range of timescales, we have used the MOST satellite to obtain 24 days of continuous, sub-minute cadence, high-precision optical photometry on a field of classical and weak-lined T Tauri stars (TTS) in the Taurus-Auriga star formation complex. Observations of AB Aurigae, SU Aurigae, V396 Aurigae, V397 Aurigae, and HD 31305 reveal brightness fluctuations at the 1–10% level on timescales of hours to weeks. We have further assessed the variability properties with Fourier, wavelet, and autocorrelation techniques, identifying one significant period per star. We present spot models in an attempt to fit the periodicities, but find that we cannot fully account for the observed variability. Rather, all stars exhibit a mixture of periodic and aperiodic behavior, with the latter dominating stochastically on timescales less than several days. After removal of the main periodicity, periodograms for each light curve display power law trends consistent with those seen for other young accreting stars. Several of our targets exhibited unusual variability patterns not anticipated by prior studies, and we propose that this behavior originates with the circumstellar disks. The MOST observations underscore the need for investigation of TTS light variations on a wide range of timescales in order to elucidate the physical processes responsible; we provide guidelines for future time series observations.
Subject headings:
circumstellar matter—open clusters and associations: individual (Taurus-Auriga)—stars:pre-main sequence—stars: variables: T Tauri, Herbig Ae/Be1. Introduction
The widespread photometric activity seen in almost all young stellar objects is a defining characteristic of the class (Joy 1945, Herbig 1962). In particular, classical T Tauri stars (CTTS) display brightness variations from the millimagnitude (Cody & Hillenbrand 2010, 2011) to magnitude level (Herbst et al. 2002, Carpenter et al. 2001, 2002), on timescales from days to years. While some CTTS light curves appear to contain regular sinusoidal patterns, the dominant form of the variations is aperiodic, with at times abrupt and unpredictable changes. The photometric variation of weak-lined T Tauri stars (WTTS; so called because their signatures of accretion are weak), on the other hand, appears to be dominated by spot rotation signatures, often with additional low level stochastic fluctuations. These diverse properties have been variously attributed to rotational modulation of cool magnetic spots, enhanced chromospheric activity, hot spots from columns of magnetically channeled shocked inflowing gas, unsteady mass accretion, and occultation or shadowing by material in a surrounding circumstellar disk. Combinations of photometric, spectroscopic and polarimetric techniques have illuminated some of these possibilities, but a rigorous explanation of the erratic, often non-periodic nature of brightness fluctuations awaits.
Central to the problem of understanding photometric activity in T Tauri stars is the need for continuous monitoring on many different timescales. Photometry from ground-based facilities is limited in both precision and time coverage, consequently making efforts to model the light curves difficult, if not impossible. Routine gaps in observation are acceptable for the detection of periodic brightness variations, since these signals generally can be isolated in the frequency domain. But the flickering portions of T Tauri lightcurves are not amenable to Fourier and similar analysis methods.
To date only a few studies have monitored young stars at high precision and cadence over long, continuous time baselines. Among these, Alencar et al. (2010) presented uninterrupted 23-day lightcurves of NGC 2264 members with 0.5–5 mmag precision from the CoRoT mission. They specifically identified objects with light curves resembling that of AA Tau, a CTTS with variability attributed to the repeated passage of warped disk material in front of the stellar photosphere every few days. The CoRoT dataset illustrated that AA Tau-like fading events are common in young stars with infrared excess and include not only dramatic brightness decreases but also erratic lower amplitude fluctuations indicative of additional dynamics in the inner disk. The full complexity of this behavior was previously impossible to capture with ground-based time series.
Rucinski et al. (2010) used the Microvariability and Oscillations of STars telescope (hereafter MOST; Walker et al. 2003, Matthews et al. 2004) to observe the Herbig Ae star HD 37806 for 21 days at 3 mmag precision, combining this dataset with nine seasons of observations by the All Sky Automated Survey (ASAS). They characterized the light curve as weakly periodic on a timescale of 1.5 days, and otherwise stochastic, with flares or accretion instabilities comprising amplitudes from 0.03% to 5% on timescales of minutes to years. Another Herbig Ae star, HD 142666, was shown by Zwintz et al. (2009) to exhibit both Scuti pulsations and irregular UX Ori type variations attributed to the circumstellar disk.
Additional high cadence investigation of young star photometric behavior spanning multiple week timescales was presented by Rucinski et al. (2008) and Siwak et al. (2011a, b). They acquired photometry at the 1–7 mmag precision level on TW Hya (nearly continuous observations of 40 and 46 days) and five other T Tauri stars in the Taurus-Auriga and Lupus star forming regions (run durations of 12 or 21 days) from MOST. For the WTTS of their sample, most of the observed variability is well modeled by a collection of differentially rotating surface spots. The CTTS light curves present variability that is more challenging to interpret. In the case of RY Tau, there are two pronounced brightness dips of 0.2 mag depth as well as lower amplitude, transient oscillatory behavior superimposed on a longer timescale trend. For TW Hya, on the other hand, flicker noise behavior (power proportional to inverse frequency) dominates (Rucinski et al. 2008), although semi-periodic features were also observed to form and drift to shorter timescales over the course of a 40-day run (Siwak et al. 2011b). Siwak et al. (2011b) attribute this type of variability to the magnetospheric accretion process, and in particular instabilities driving the flow of plasma from the inner disk.
This small collection of space-based time series data has highlighted the complexity of young star variability and underscored the need for further datasets to determine the nature of the irregular and low-amplitude flux variations in these objects. The extent to which they are representative of young star light curves in general remains unclear. Currently the YSOVAR project (Morales-Calderón et al. 2011, Rebull 2011) is exploring the yield from multiwavelength precision photometry in several young clusters including the Orion Nebula Cluster and NGC 2264.
We have taken advantage of the unique capabilities of the MOST mission to acquire a further high-precision, high-cadence, nearly continuous data stream over a 24-day observing period. Our aim was to monitor a handful of erratically varying young stars to determine their short-timescale photometric patterns, decipher the mix of periodic and aperiodic phenomena in operation, and to quantify mathematically the aperiodic behavior. Presented here is MOST data and analysis of the light curves of four T Tauri and Herbig Ae stars (SU Auriga, AB Auriga, V396 Aur, and V397 Aur), and one new candidate early type Taurus member (HD 31305).
The MOST observations are presented in Section 2 and the variability characterized in section 3. Section 4 contains discussion of the individual objects, and Section 5 a general discussion of the implications of the photometric timescales and amplitudes seen in our MOST 24-day observing sequence.
| Star | Other identifiers | V | SpT | Noise RMS | Empirical RMS | |
|---|---|---|---|---|---|---|
| AB Aur | HD 31293, HBC 78, 2MASS J04554582+3033043 | 7.1 | 7.1 | A0/B9 | 0.0017 | 0.030 |
| HD 31305 | 2MASS J04554822+3020165 | 7.7 | 7.6 | A0 | 0.00092 | 0.009 |
| SU Aur | HD 282624, HBC 79, 2MASS J04555938+3034015 | 10.2 | 9.4 | G2 | 0.0025 | 0.110 |
| V396 Aur | LkCa 19, HBC 426, TAP 56, 2MASS J04553695+3017553 | 12.3 | 11.2 | K0 | 0.019 | 0.050 |
| V397 Aur | HBC 427, TAP 57NW, 2MASS J04560201+3021037 | 12.9 | 11.6 | K71 | 0.024 | 0.058 |
Note. — Basic data on the target stars, as reported by the SIMBAD database and measured from our time series data. Spectral types are from SIMBAD, except for HD 31305 (Arzner et al. 2007). Magnitudes are not simultaneous with our MOST time series observations. Noise RMS refers to the standard deviations of our MOST light curves after subtraction of smoothed median trends, whereas the empirical RMS is the standard deviation inclusive of intrinsic variability. 1V397 Aur is a single-lined spectroscopic binary system (Walter et al. 1988); the spectral type corresponds to the primary. A direct imaging study determined =0.87 for this system (Kraus et al. 2011).
2. Observations
In operation since 2003, the 15 cm MOST telescope produces ultra-high precision differential photometry by virtue of its location 820 km above Earth and specially designed imaging modes (Rowe et al. 2006, Kuschnig 2009). Since the satellite executes a polar orbit with period 101.413 minutes, it enables continuous viewing of targets for up to eight weeks in a zone (the “CVZ”) from -18 to +36 declination. We selected a target field in the 3 Myr Taurus-Auriga star-forming complex based on its location within the CVZ as well as the proximity of five suitably bright young targets: SU Auriga, AB Auriga, V396 Aur, V397 Auriga, and HD 31305 (see Table 1). The former four are known young stars in the Taurus-Auriga association, while the latter is a newly suggested member based on this work.
Observations took place over 24 days from 2009 December 14 to 2010 January 07. All MOST images are acquired through a broadband filter with wavelength range 350–750 nm. Our three brightest targets (SU Aur, AB Aur, and HD 31305) were monitored in the direct imaging mode (Rowe et al. 2006), which involves defocusing stars to a FWHM of 2–2.5 pixels. It can be applied to up to 10 stars in the magnitude range =6–11, and in our case produced photometry with point-to-point precision of 0.001–0.002 mag. For the two fainter targets (V396 and V397 Aur), guide star imaging (Walker et al. 2005) offered the best performance, with precisions of 0.01–0.02 mag. A third mode, Fabry imaging (Reegen et al. 2006), produces photometry at the mag level but can handle only one target at a time and requires stars brighter than those in our sample.
To mitigate pointing effects, MOST acquires and stacks many “subexposures” from 0.3–3 seconds. Total exposure times for the combined images was approximately 30–40 seconds, with little dead time between; the resulting cadence was 43 seconds. Lightcurves were generated by the MOST photometric pipeline (Rowe et al. 2006, Hareter et al. 2008), which rejects cosmic rays and other artifacts, aligns the point spread functions (PSFs) for image stacking, and decorrelates background trends from target pixel fluxes. The latter stage was complicated by the high-amplitude variability present in most of our targets and hence required manual removal of clear outliers identified by eye.
Following these reductions, there remained a residual flux contribution from scattered Earthshine (e.g., Reegen et al. 2006, Rowe et al. 2006) which introduced high levels of noise over a portion (60%) of each satellite orbit. The data from these sections was unusable and hence not included in the final light curves. The remaining flux points were modulated by a small (0.5%), non-sinusoidal stray light contribution at the 14.2 cycles/day (165 microHz) orbital frequency. In addition to the once-per-orbit data gaps, there are also 15 larger gaps caused by observations of a source unrelated to our program. The resulting duty cycle is 35%.
Since our MOST data are not amenable to absolute calibration, all photometry presented herein is relative. The resulting differential light curves all exhibit variability, such that the RMS values are not reflective of the underlying white noise. We have estimated the point-to-point photometric precisions by subtracting out smoothed median trends and fitting Gaussian profiles to the remaining noise distributions. The estimated precisions, along with the actual RMS values (before subtraction of the median trend), are listed in Table 1.
3. Variability Characterization and Features
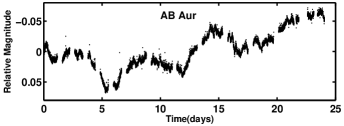
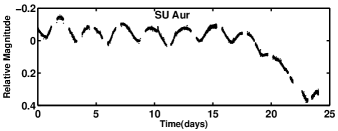
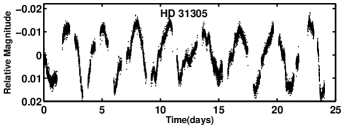
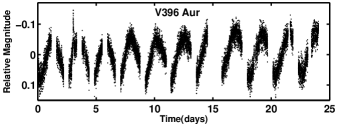
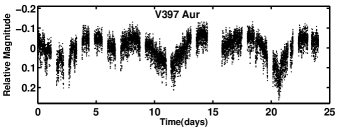
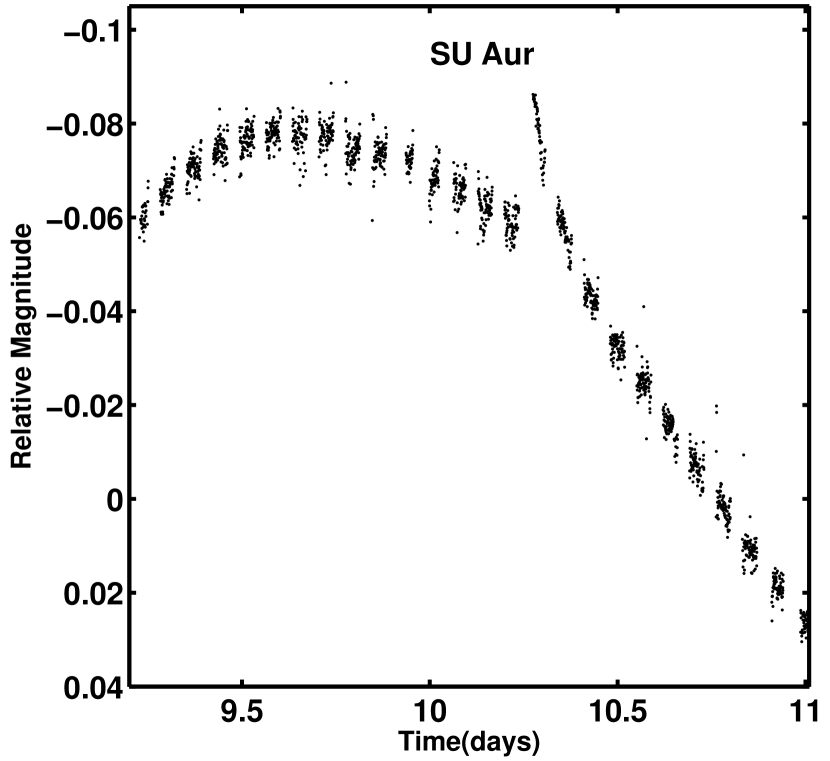
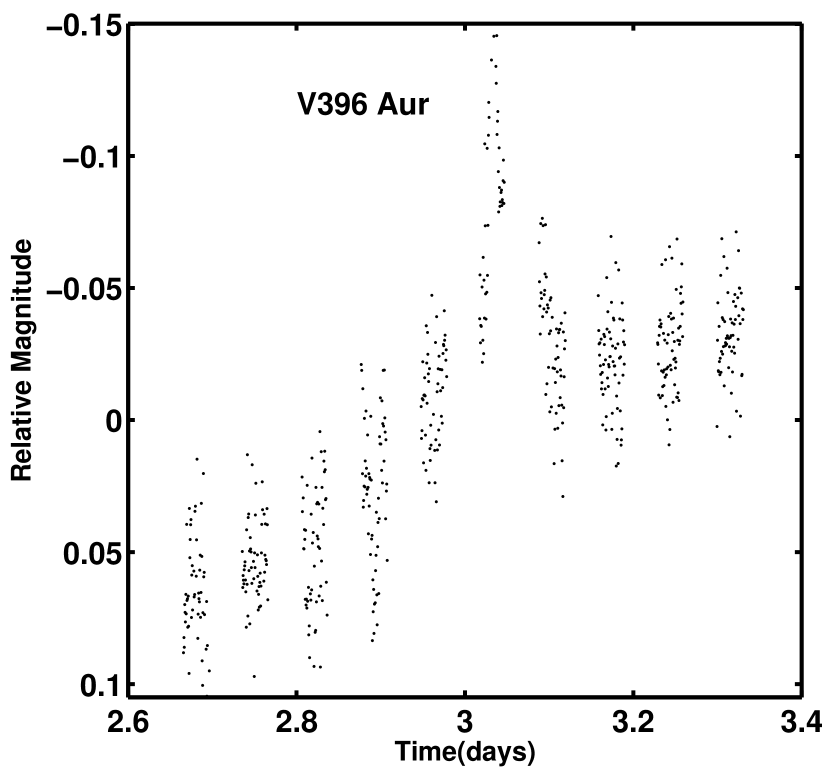
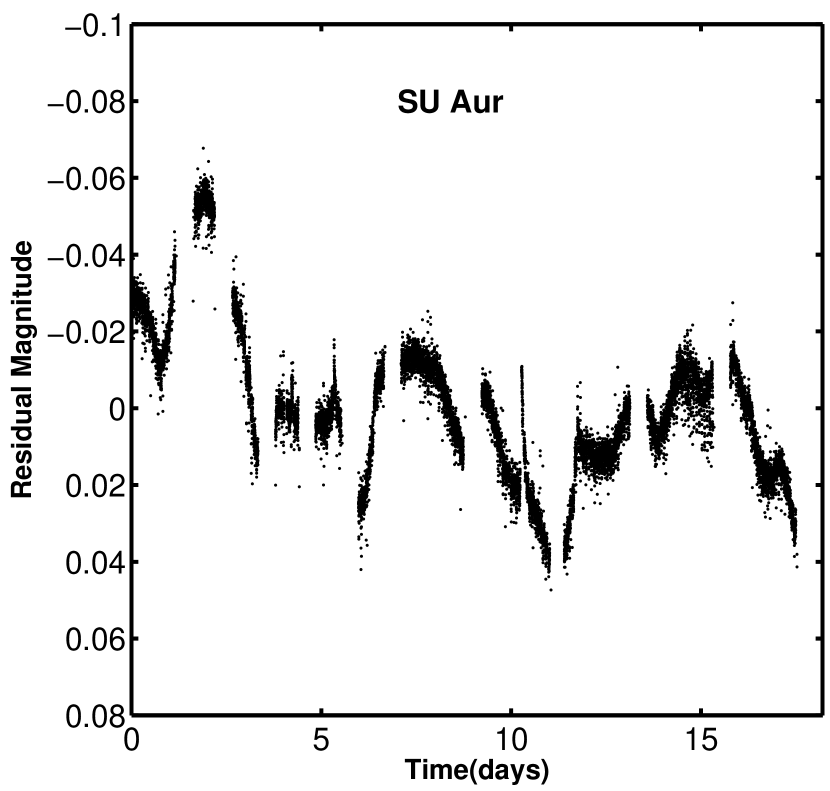
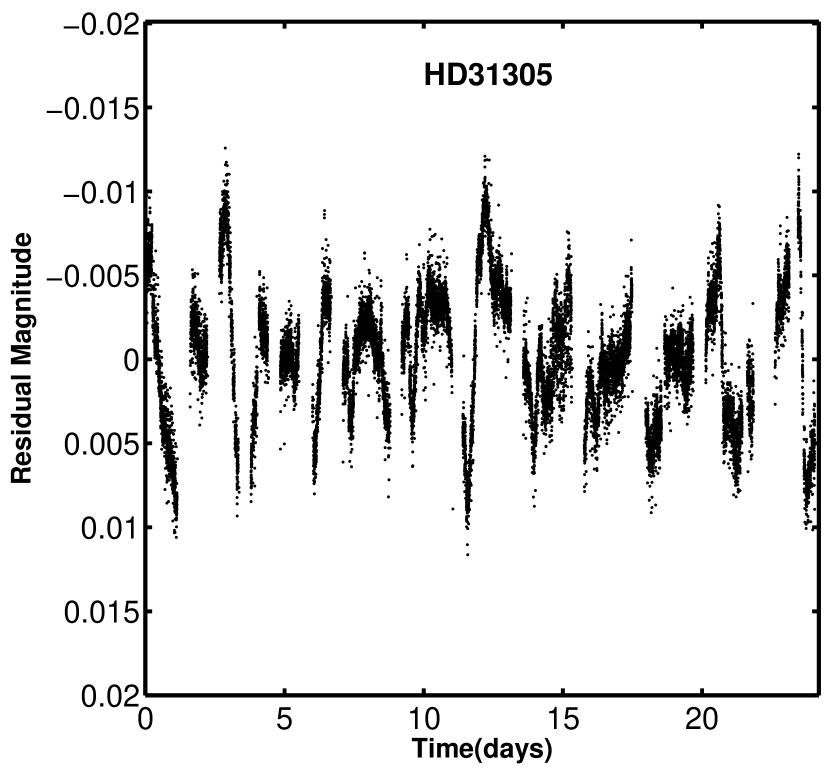
The final MOST light curves are presented in Fig. 1. Each of the five targets displayed variability well above the photometric noise level of a few mmag (Table 1). Brightness levels fluctuated by at least 0.03 mag (HD 31305) and up to 0.5 mag (SU Aur) over the course of the 24-day observations (see Table 1). In addition to the range of amplitudes, flux variation is present on a range of timescales. Periodic behavior predominates with characteristic timescales of a few days. Each star in our sample showed semi-periodic fluctuations. Further, a mixture of periodic and aperiodic components is evident in the light curves, in some cases with behavior that is not constant over the entirety of the light curve. For example, the last six days of the SU Aur light curve show a deep fading event; similar episodes have been reported in past literature (e.g., DeWarf et al. 2003). Several objects display transient events, such as flaring. Fig. 2 illustrates this in two cases for the light curves of SU Aur and V396 Aur.
In Section 3.1 we assess the periodic behavior using Fourier analysis. We then examine the evidence for correlated aperiodic behavior using wavelet analysis (Section 3.2) and autocorrelation analysis (Section 3.3), which also affirms for the periodic objects the results of the Fourier analysis.
3.1. Fourier analysis
| Star | Periodogram | Periodogram | Wavelet | Autocorrelation | Previous values |
|---|---|---|---|---|---|
| period (d) | amplitude (mag) | period (d) | period (d) | (d) | |
| AB Aur | 6.5510.015 | 0.01670.0003 | 5.97–7.55 | 5.50 | 0.541, 1.382, 1.832, 1.763, 1.334 |
| HD31305 | 2.93790.0009 | 0.010560.00004 | 2.81–3.04 | 2.88 | |
| SU Aur | 2.6610.001 | 0.04560.0002 | 2.39–2.64 | 2.640.11 | 165, 36, 1.77,1.558,2.738,2.79,0.4610 |
| V396 Aur | 2.23930.0005 | 0.06520.0003 | 2.21–2.29 | 2.24 | 2.2311, 2.2412 |
| V397 Aur | 9.540.02 | 0.043120.0004 | 9.36–9.50 | 9.36 | 9.3213,9.3914,10.115 |
| 4.60220.0002 | 0.04770.0005 | 4.60–4.96 | 4.44 | 4.716 |
Note. — Periods, derived by identifying the largest periodogram peak and its 1- uncertainties from Monte Carlo simulations (column 3), by identifying peaks in the wavelet function (column 4; range denotes the extent of the peak), and by selecting the first peak in the autocorrelation function and the timescales for which it drops by 1% from the peak value (column 5). The two rows under V397 Aur correspond to its individual binary components. We list previously reported rotation periods for comparison. References are as follows: 1Corder et al. (2005), 2Catala et al. (1999), 3Telleschi et al. (2007), 4Praderie et al. (1986), 5Percy et al. (2006), 6Johns & Basri (1995), 7DeWarf et al. (2003), 8Herbst et al. (1987), 9Unruh et al. (2004), 10Franciosini et al. (2007), 11Grankin et al. (2007), 12Bouvier et al. (1993b), 13Zakirov et al. (1993),14Norton et al. (2007), 15Bouvier et al. (1995),16Bouvier et al. (1993a)
Because the light curve variations appeared to contain periodic components, we used Fourier analysis to identify frequencies and assess their significance. Among the unique features of this data were the long baseline and high cadence at which it was taken. The nearly uninterrupted sequence of MOST observations provides an opportunity to search for signals in the periodogram without interference from aliasing in the 1–10 day range typical of young star rotation and associated spot modulation variability (Irwin & Bouvier 2009). Over the 24-day duration, data points were generally spaced less than one minute apart. Additionally, the instrumental error on the brightness values was on the order of one millimagnitude for the data on AB Aurigae, SU Aurigae and HD 31305 and slightly higher for V396 and V397 Aur. The high quality of data allow us to search for periodic variations ranging from multi-day rotation signatures down to minute-timescale brightness fluctuations, several mechanisms for which were proposed recently (Koldoba et al. 2008, Orlando et al. 2010).
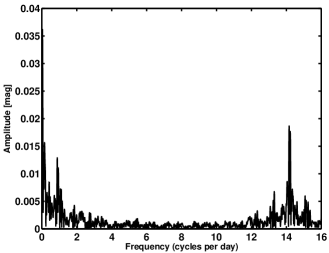
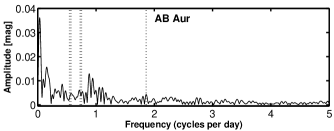
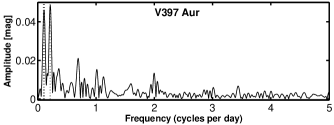
Our selected tool for the analysis of periodic variability is the discrete Fourier transform (Deeming 1975) periodogram. The MOST data sampling pattern includes a built-in periodicity as a result of the regular gap in observation (due to high levels of stray light; see Section 2) during the second half of each 101-minute orbit. Therefore, the periodogram of any non-constant brightness object contains an alias at the associated 14.2 cycles per day (d-1) frequency. We display an example of this phenomenon in Fig. 3, where a strong peak at =14.2 is visible in the periodogram of AB Aur. Because this peak repeats at 28.4 and other multiples of 14.2, we restrict our initial period analysis to the frequency range from 0 to 10 d-1 (i.e., periods greater than 2.4 hours). The Nyquist limit, or maximum independent frequency, is 1000 d-1 (86 second period).
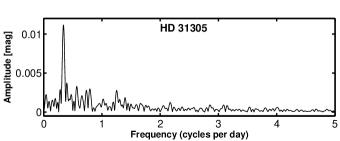
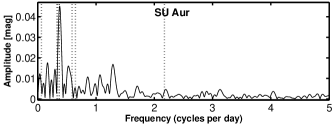
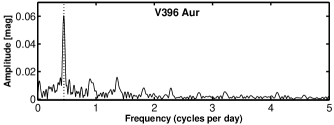
We used Period04 (Lenz & Breger 2005) to produce periodograms for each light curve. This program handles data with non-uniform time sampling and performs a multiperiodic least-squares fit for frequency, amplitude, and phase of a series of peaks selected in the periodogram. We used Period04 in an iterative fashion: first searching for a single, most significant peak, then subtracting the corresponding best-fit sinusoid from the data, recomputing the periodogram, and searching for further peaks. We evaluated the significance of the identified signals by requiring that their amplitude be at least a factor of 4.0 higher than the surrounding noise level in the periodogram for 99.9% confidence, as suggested by Breger et al. (1993). In addition, a Monte Carlo simulation tool was used to add Gaussian noise to the best-fit combination of sinusoids, according to the noise level in the original light curve, and at the same time sampling. The periodogram was then regenerated, and the parameters of the highest peaks recorded. We performed 500 realizations of this process to determine the uncertainties on the periods and amplitudes quoted in Table 2. The full set of periodograms is displayed in Fig. 4.
Using Period04, we discovered a single statistically significant period for each star (or two in the case of the V397 Aur system, which is a spectroscopic binary that was recently resolved; Mathieu et al. 1989, Kraus et al. 2011), each of which is listed in Table 2. For V396 Aur, V397 Aur, HD 31305, the periodic pattern is relatively consistent over the 24-day duration of observations, and the light curves encompass up to 10 cycles. We therefore ascribe the variability to stable hot or cool spots on these objects and tentatively associate the detected periodicities with their rotation rates. SU Aur also maintained stable periodic behavior consistent with spots, but only for the first 18 days before a dramatic fading event set it. The case of AB Aur is even more complex, since its light curve displays systematic trends on top of the suspected periodicity. The light curve of this star is too erratic to conclude that its brightness fluctuations are reflective of its rotation period.
We list the values of all detected periodicities in Table 2. In several cases, they are consistent with one or more previously noted periods, suggesting that one or more spots are frequently present on the stellar surfaces and that the basic spot pattern is long-lived even if particular spots come and go over years. Nevertheless, the overall range of periods reported in the literature underlines how difficult it can be to infer accurate rotation rates from more sparsely sampled ground-based data.
To assess even shorter timescales of variability, we examined the full independent range of periodogram frequencies from 0 to 1000 d-1 (or periods down to 1.5 minutes). We performed this analysis on residual data after the sinusoidal signals detected with Period04 were subtracted out from the light curves in order to exclude power from the dominant periodicities. In addition, we masked out the MOST orbital aliasing features at multiples of 14.2 d-1.
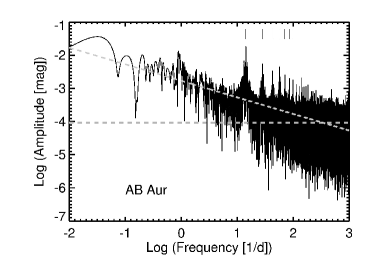
To model the frequency domain behavior, we fit a median trend to each periodogram and took its level at 800–1000 d-1 to represent the underlying white noise. These values ranged from 1.6 mag (HD 31305) to 3.5 mag (V397 Aur) and, for our dataset, are 2–5% of the photometric white noise in the time domain (i.e., the RMS light curve values listed in Table 1). We then fit a “” curve (i.e., power proportional to inverse frequency, or amplitude proportional to ) to the low-frequency end of the periodogram from 2–10 d-1 and noted the point at which this exponential drop-off in variability amplitude with frequency reached the white noise limit. For AB Aur, SU Aur, and HD 31305, our targets with mmag-precision photometry, this occurred at 175–350 d-1. We detect no substantial deviations from flickering behavior (apart from the aliasing power excess) on timescales down to several minutes. In addition, we can rule out high-frequency periodic signals with periods down to 1 minute and amplitudes down to four times the periodogram noise limit: 0.4 mmag for AB and SU Aur, and 0.06 mmag for HD 31305. The results of our Fourier analysis suggest that in general, observations detect flicker noise in CTTS down to the white noise limit. Considering that ground-based photometry achieves a typical precision 5–10 times worse than our MOST uncertainties, future observations would need to sample light curves roughly once per hour to capture the essence of variability in these stars.
For the two lower precision datasets on V396 and V397 Aur, amplitude levels in the periodogram followed a much shallower trend () after removal of the main periodicities. We suspect that the light curves of these stars are fully explained by one or more spots along with low-level noise that is systematic but not characterized by flickering. We also fail to detect any significant high-frequency signals with amplitudes down to 1 mmag in any of our targets. We concur from analysis of this sample with Günther et al. (2010), who found no evidence for short-timescale periodicities due to oscillations of an accretion shock.
In summary, after removing the dominant periods due to rotation and repeating the Fourier analysis, the resulting periodograms of the CTTS were all relatively featureless and consistent with: a “” flicker noise profile at low frequencies (10 d-1), a white noise baseline at high frequencies, and a slight power excess due to aliasing at intermediate frequencies. Thus it appears that there are no characteristic timescales underlying the variability in these objects, other than the rotation period. A representative example of the residual periodogram for AB Aur is shown in Fig. 5.
3.2. Wavelet analysis
While each of our target stars displayed a prominent signal in the periodogram, we found that most of the lightcurves are better described as a mixture of periodic and aperiodic phenomena. To determine whether some of the stochastic behavior could be attributed to the appearance of coherent yet transient periodicities, we performed a wavelet transform using the WinWWZ package available through the American Association of Variable Star Observers111WinWWZ was produced by G. Klingenberg and L. Henkel; it can be downloaded from http://www.aavso.org/winwwz. This program applies a weighted wavelet Z-transform (Foster 1996) to achieve resolution in both frequency and time for unevenly spaced data. The wavelet employed is a simple sinusoid plus constant term, applied by sliding a window of predetermined width across the data. Datapoints close to the center of the window have the highest weight, whereas those near the edges are downweighted. WinWWZ is a useful tool for not only understanding how many periodic signals are present in the data at a given time, but also how their frequencies and amplitudes evolve.
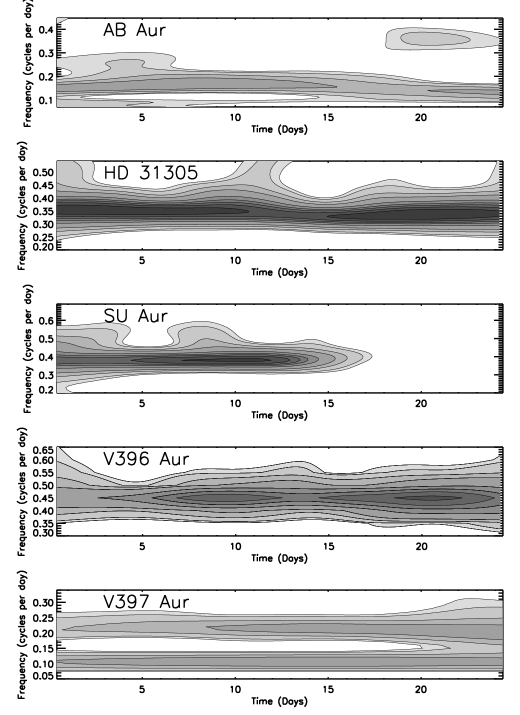
The basic output of the wavelet transform consists of signal power as a function of time and frequency. We illustrate this for our target stars with a series of contour plots, shown in Fig. 6. WinWWZ also provides one-dimensional plots of frequency versus time for the strongest signal. We detected one dominant period for each star (or two, in the case of binary system V397 Aur), affirming the results of Fourier analysis in Section 3.1. The derived values are presented in Table 2, with ranges indicating the minimum and maximum period values attained for this strongest signal over the course of the time series.
The wavelet analysis suggests that there may be changes in period over the course of the MOST observations. The abrupt disappearance of the periodic signal in the light curve and wavelet transform of SU Aur around day 18 is the most obvious instance of a change in periodic behavior. Since we do not know a priori the shape of the subsequent brightness dip, it is difficult to ascertain whether the periodicity vanishes completely or is simply washed out by the strongly systematic light curve trend. If the former, then the disappearance of the signal indicates that the stellar photosphere becomes obscured by material in the line of sight. Other more subtle variations in period include a 1.5 day evolution in the strongest period of AB Aur, and a change of over 0.2 days in the period in the HD 31305. These effects may reflect actual changes in the variability timescale, or instead be attributed to non-sinusoidal components in the variability.
As the target with the most stable frequency behavior, V397 Aur shows two strong and sustained periodic signals in the wavelet analysis, consistent with its identification as a binary system. For the other objects, the ranges in period measured for the dominant signal are of order 100 times larger than the 1- uncertainties returned by the periodograms. Since the periodogram represents the average behavior of periodicities over the 24-day run, the wavelet result again suggests that there is subtle evolution in the timescales of periodic variability during our observations, or that aperiodic variability is interfering with out ability to measure a stable period.
3.3. Autocorrelation analysis
Fourier analysis and wavelet analysis provided an indication of the periodic variations present in the data. Autocorrelation (Box & Jenkins 1976) is a further technique that enables confirmation of these results as well as additional searches for variability that is not strictly periodic, not sinusoidally shaped, or not present for the entirety of the data set. It provides an assessment of how consistent variability patterns are on different timescales. Perfect correlation results in an autocorrelation value of 1, while completely uncorrelated data returns a value of 0, and anticorrelated data corresponds to negative values. This technique is particularly useful in that it can reveal periodic variations even if they are not persistent throughout the entirety of the data set. It serves as a check on the results obtained by Fourier analysis and wavelet analysis. Since the MOST data were not evenly spaced throughout the observation period, we first resampled the light curves using linear interpolation. We then applied the unbiased autocorrelation formula:
where is the total number of data points, the timeshift, the light curve values, and .
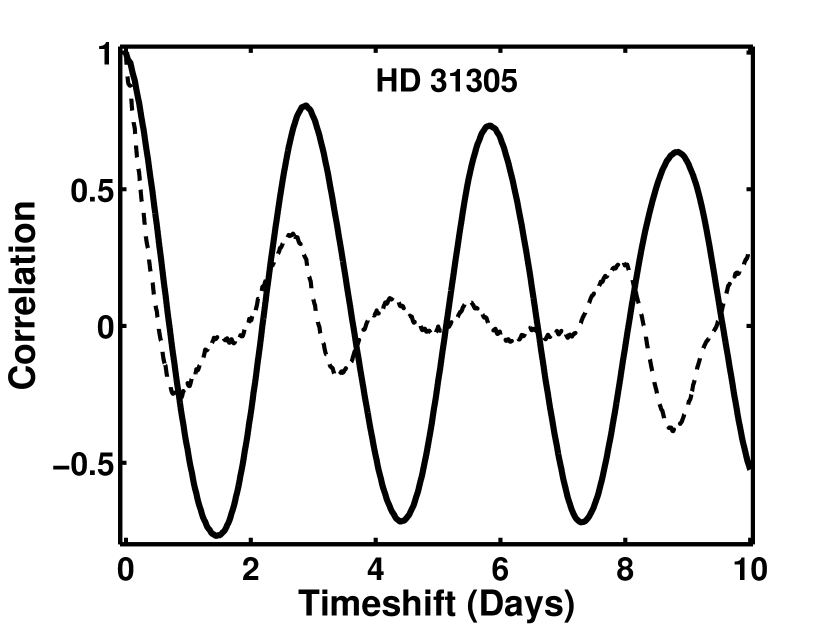
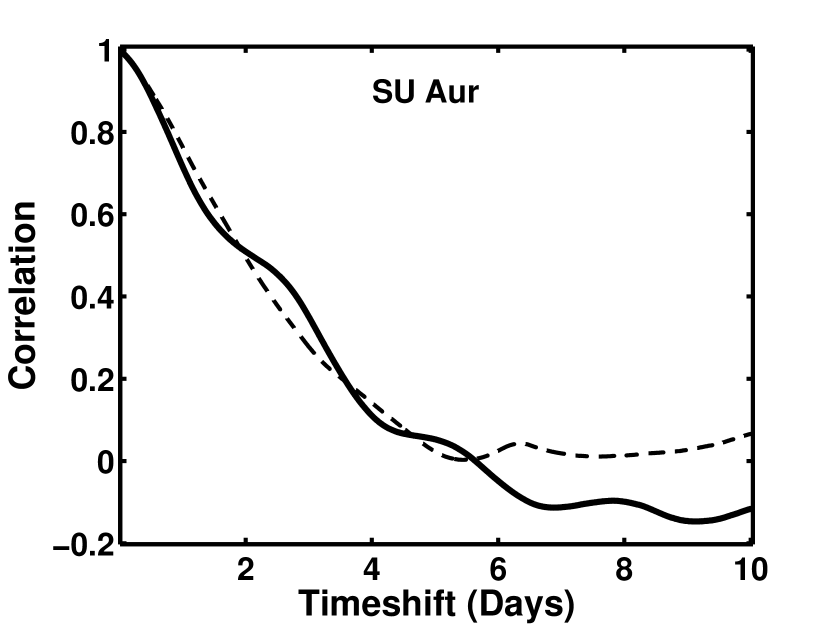
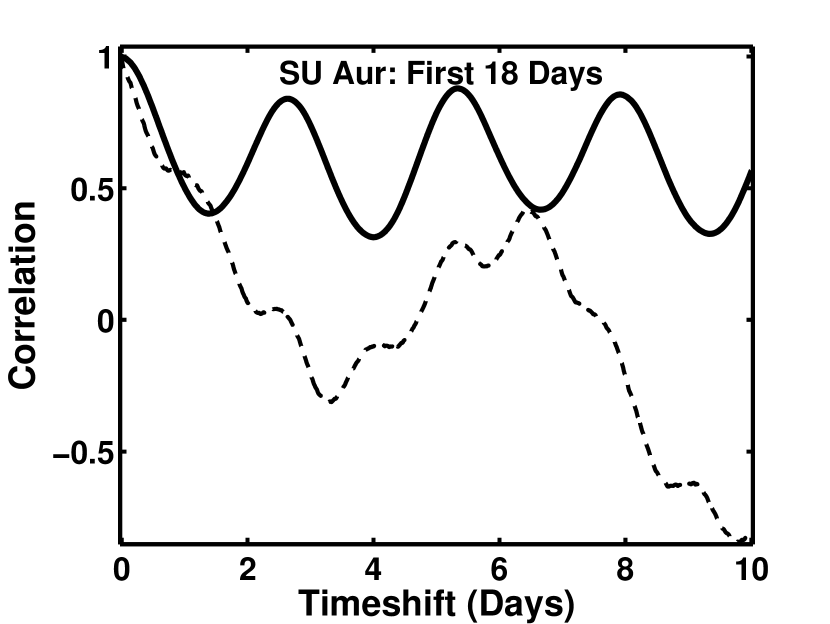
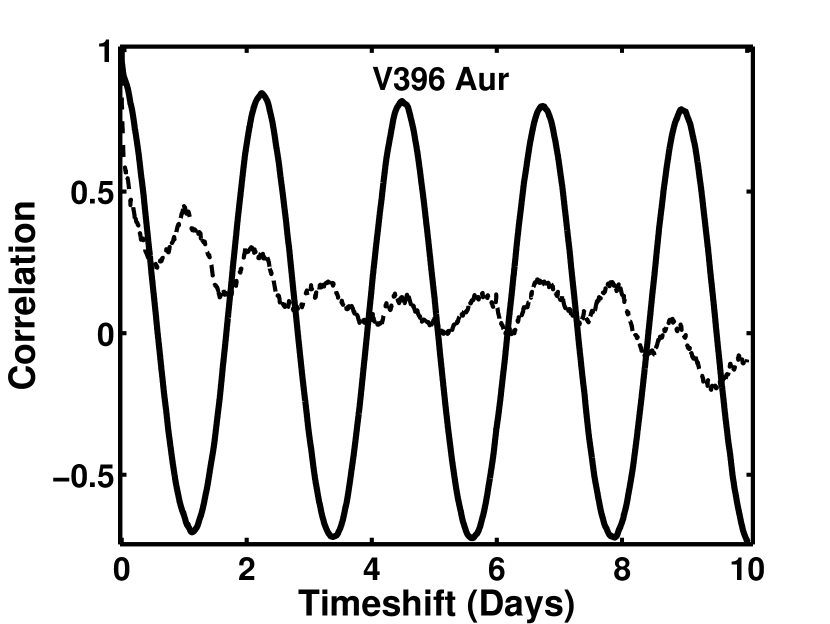
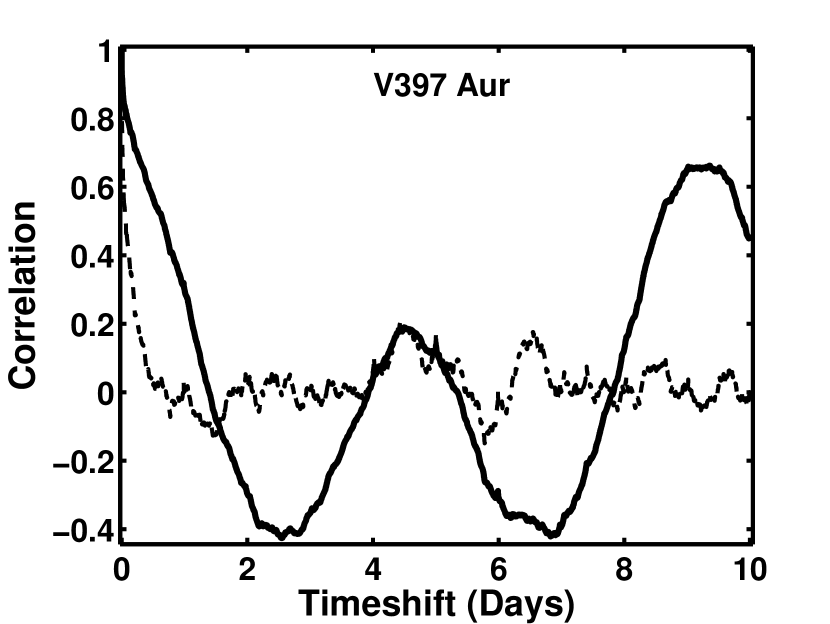
We noted a single prominent autocorrelation peak for each star, consistent with the periods derived from Fourier analysis. We have derived periods by measuring the timeshift of the first maximum and noting the surrounding values for which the autocorrelation function drops by 1%; these ranges are listed in Table 2. Since the light curve of SU Aur ceases to display oscillations during the last 6 days of observation, we have computed two versions of the autocorrelation function for this star. The first is performed on the entire dataset, while the second includes only the first 18 days.
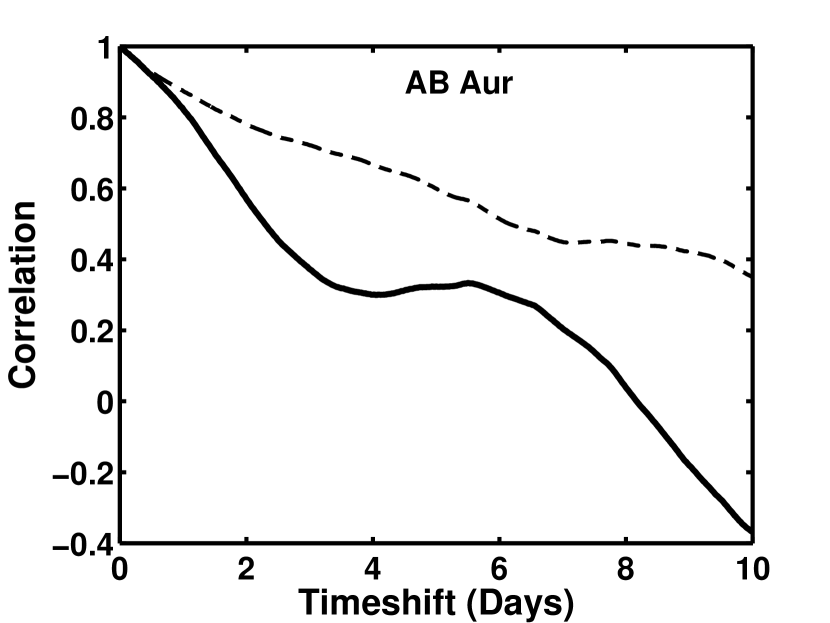
In addition to providing confirmation of the previously measured periods, autocorrelation analysis enables investigation of any further underlying variability. To accomplish this, we first used Period04 to subtract out variability at the dominant period. We then recomputed the autocorrelation function on this residual. Both versions of the autocorrelation are shown in Fig. 7. The residuals contain low-level undulating features, but further subtraction of periodogram-detected signals from the light curve did not result in their disappearance.
While no significant new variability signals were evident in the residual autocorrelations, the analysis does provide an indication of the characteristic timescales for aperiodic physical processes in our target stars. We associate an autocorrelation timescale by noting the value for which the autocorrelation drops to 0.5. The flux variations of HD 31305 are correlated on timescales of 0.2 day once the periodic signals are removed, while SU Aurigae is correlated on timescales of 1.1 days. In contrast, AB Aurigae displays coherence in its variations out to 6.2 days. Long timescale correlation after the periodic signal has been removed implies that for these three sources there are additional physical processes other than periodic spot modulation that contribute to the variability. The residual light curves of the two weak-lined T Tauri stars V396 and V397 Aur are correlated on much shorter timescales of 0.1 days. We suspect that spots explain most of the variability in these systems.
4. Starspot modeling
The periodogram, wavelet, and autocorrelation analysis methods yielded one significant periodicity per star. In most cases, the derived timescale was very close to a rotation period previously reported in the literature. The long-term stability of these periodicities, as well as the deviations in light curve shape on shorter time scales, suggests that the underlying mechanism is flux modulation by cool or hot starspots, as opposed to stellar pulsation or an eclipsing companion.
Representation of a light curve with spots requires a number of parameters and often admits degenerate solutions. A non-parametric model involving only total spot coverage and temperature contrast relative to the photosphere is one way to avoid these challenges (e.g., Grankin et al. 2008). However, the dense sampling and long duration of our time series observations enables more detailed exploration of the presumed spot properties than is typically possible with ground-based data. We exploit the high quality of our dataset by applying StarSpotz (Croll et al. 2006, Walker et al. 2007), an analytic starspot modeling program designed specifically for the analysis of MOST data.
To reduce the number of free parameters required for the spot modeling process, we fixed the stellar inclination, , as well as the rotation period. We set the latter according to our results from Fourier analysis (Section 3.1). The value of was taken from the literature where available. In addition, we fixed the limb darkening coefficient via the -band prescription of Claret & Bloemen (2011), but tested several alternate values to determine the sensitivity of our results to this parameter.
We provided starting guesses for all other free parameters, including unspotted stellar brightness, spot darkness (ratio of flux compared to that of the surrounding photosphere), spot latitude and longitude, as well as spot angular size. To avoid unphysical values of spot darkness, we produced models for discrete steps between 0.0 (completely black spot) and 1.0 (same brightness as photosphere). The total number of spots, as well as the presence of differential rotation, were specified in advance, and the free parameters were then varied separately for each spot to create a suite of analytical models following the prescriptions of Budding (1977) and Dorren (1987). Starspotz evaluates the goodness of model fits to the light curve via a non-linear least squares algorithm, returning a local minimum value.
We assessed the improvement in fit brought about by increasing the number of spots, as well as whether an assumption of differential rotation produced a better fit. In general, neither of these additions resulted in significant improvement and there remained deviations in the light curves that could not be explained by spots. Since these additional features are lower in amplitude than the periodic variability, we argue that spot models can help nevertheless to inform our picture of stellar surface properties. In the following sections, we detail the the best-fit spot configurations and evaluate their consistency with the light curves of V396 Aur, SU Aur, HD 31305, and AB Aur. We did not produce a spot model for V397 Aur since it is a binary system and both members appear to contribute to flux variations in the light curve.
4.1. V396 Aurigae
Several rotation periods for the star V396 Aur were previously reported in the literature. The 2.228 days by Grankin et al. (2008) and 2.24 days by Bouvier et al. (1993b) agree well with our values derived from Fourier, wavelet, and autocorrelation analysis. The former study, known as the Maidanak survey, characterized variability in this object as having a correlation between the magnitudes of maximum and minimum light during different observing seasons. An explanation for this behavior could be long term evolution of the total spot area, which they represent by a collection of cool spots on the stellar surface. Despite the history of observation, the typical distribution of the starspots causing variability in V396 Aur remains ill determined. In contrast to Grankin et al. (2008)’s conclusions, Huerta et al. (2008) proposed a single large spot near the star’s pole, based on 2.18-day periodic radial velocity variations of 1 km s-1 amplitude.
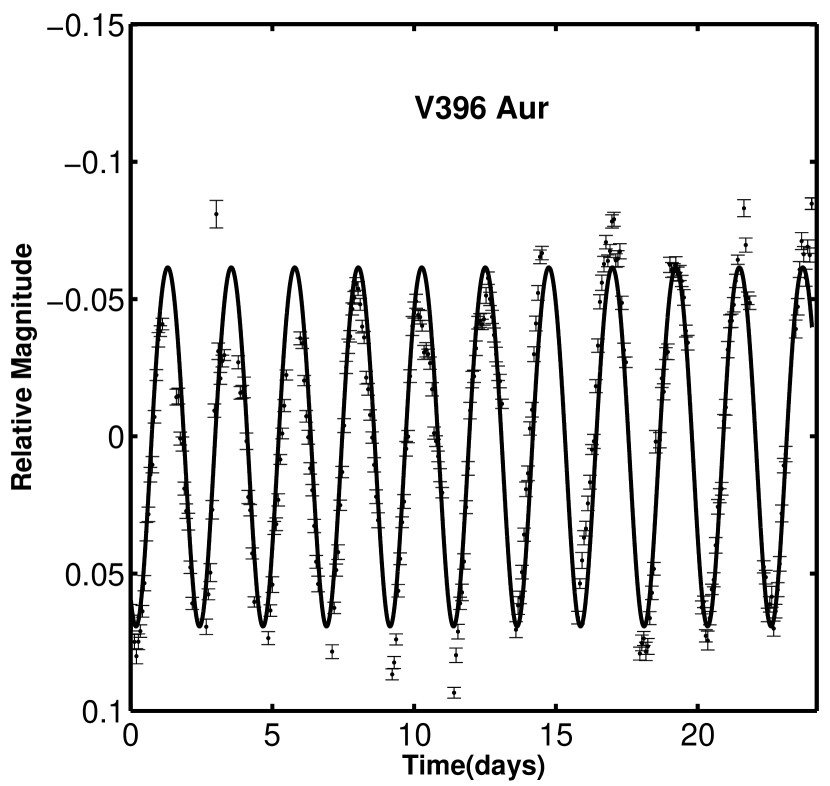
We set out to model the starspot configuration of V396 Aur during our MOST observations by fixing known stellar parameters and generating a series of one to three dark spots. The sin value of V396 Aur is 18.61.9 km s-1 (Hartmann et al. 1987), yielding stellar inclinations from 25–35° for the range of range of radii expected for a young K0 star (1.5 ; Bouvier et al. 1995). To generate Starspotz models, we adopted the two most extreme values reported in the literature: =33° (Bouvier et al. 1995) and =25° (Huerta et al. 2008), along with a limb darkening coefficient appropriate for the K0 spectral type of V396 Aur (5250 K) from Claret & Bloemen (2011). Combined with the adopted sin and stellar radius, our observed photometric period of 2.24 d is consistent with values of in the range 33°4.
We find that the MOST observations of V396 Aurigae are best modeled by a single large spot at 60–80° latitude, with the lower latitudes favored for the stellar inclination =25°. The best fitting solution is dependent on the spot darkness parameter, with darker spots corresponding to smaller covering fractions. We found a minimum spot diameter of 23°, or 4% of the stellar surface area). We find acceptable values for the spot darkness between 0.0 and 0.5; spots with lower contrast would occupy an unphysically large portion (30%) of the visible photosphere. The solution is also degenerate with the unspotted stellar brightness, again leading to very large spots for unspotted brightnesses much greater than the observed flux level. Incorporation of two or more spots to the model did not result in a significantly better fit to the light curve. Adjustments to the limb darkening coefficient also failed to bring about improvement.
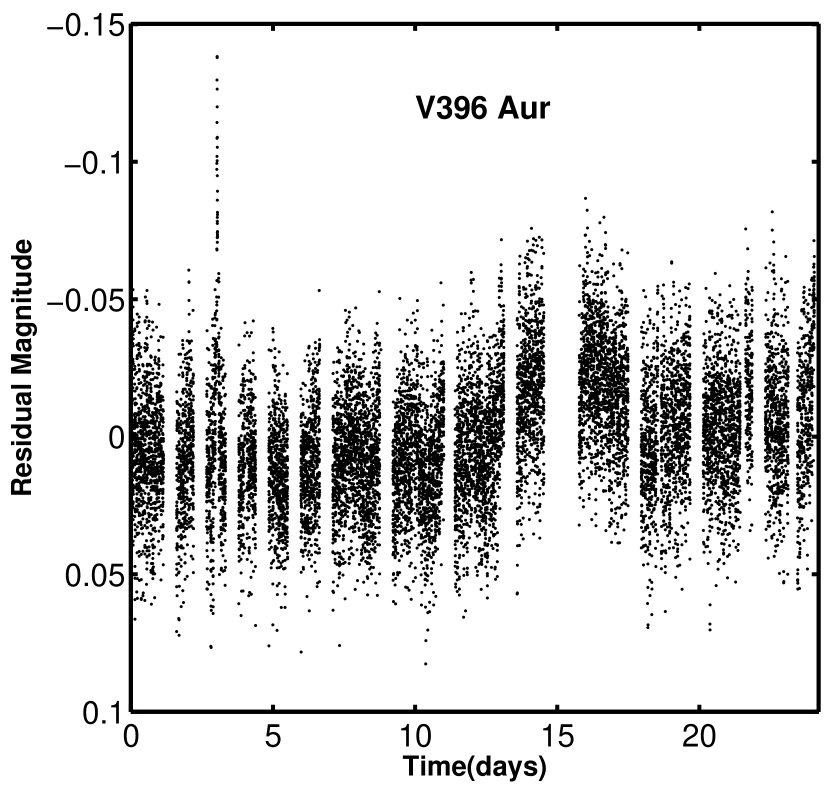
In Fig. 8 we overplot one of the best fitting models on the light curve of V396 Aur, with data binned on the 101-minute MOST satellite orbital timescale, alongside the residuals of the unbinned light curve after model subtraction. There are a number of outliers from the model, one of which occurs at =3 days into the run. Closer inspection of the full cadence light curve reveals that this is a flare event (see Fig. 2). The rise and decay times are 0.5 and 1.2 hours, respectively, and the amplitude is 0.1–0.15 mag. Other outliers lie mainly at the peaks and troughs of the light curve, suggesting that spot evolution is taking place, or that there is an additional source of low-level variability that is most apparent at these phases. Nevertheless, there do not appear to be any systematic trends or periodicities in the residuals. The minimum reduced value was 36.1, confirming that a spot model does not provide a full explanation for the variability in V396 Aur.
4.2. SU Aurigae
Previous observation of the G2 star SU Aurigae has indicated periodic variability on a variety of derived time scales (Table 1). A number of observers have also noted its erratic dimming by 0.5 mag in the optical over timeframes of 3–5 days (Unruh et al. 2004). This has led to its classification as a UX Orionis star (“UXOR”), although the change in magnitude is not as large as that of prototypical UXORs (1 mag in V; Herbst & Schevchenko 1999) or slightly lower mass “Type III” T Tauri stars (1 mag; Herbst et al 1994).
Our observations of SU Aurigae also indicate a picture of variability involving a mixture of behavior. We observe both a periodic component during the first 20 days of observation and an 0.4 mag dimming event that begins around =19 d and persists through the end of the time series. In addition, a flare occurs at d, with rise time 1 hour, decay time 2.4 hours, amplitude 0.03–0.04 mag (see Fig. 2). At d, a portion of the light curve appears offset and brighter by 0.04 mag. As far as we can tell, this is not an instrumental error, and the star was inexplicably brighter during this particular peak of its oscillatory pattern.
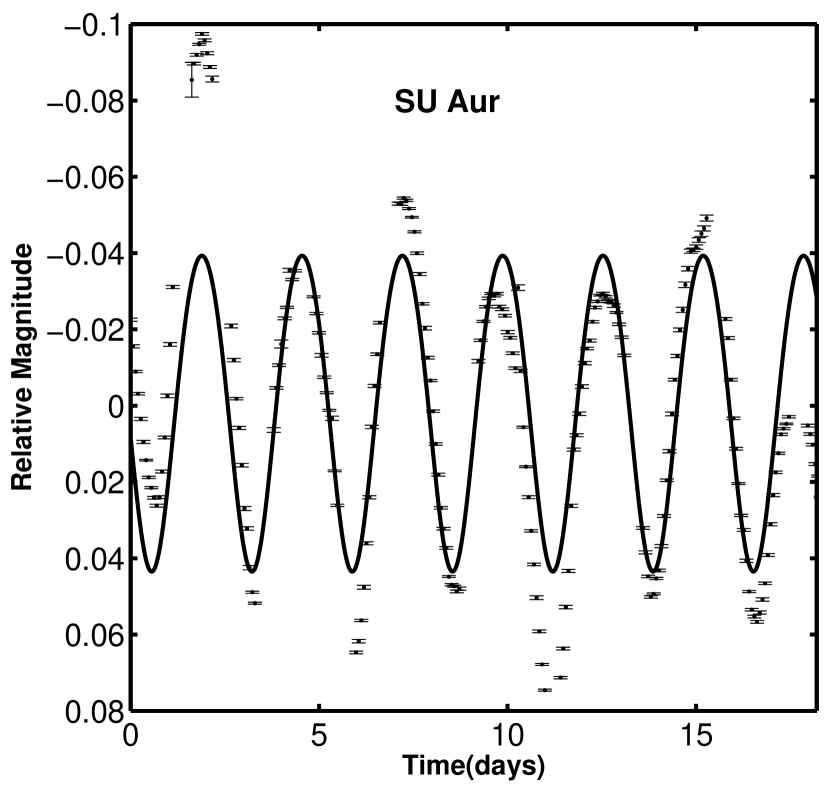
To model the periodic variation in SU Aur, we have considered only the first 20 days of the time series, since the last five days are dominated by systematic fading. Our chosen limb darkening coefficient is based on Claret & Bloemen (2011), and appropriate for a young G2 star ( K; DeWarf et al. 2003). We chose a stellar inclination by assuming that it is equal to the inclination measured interferometrically for the disk: ° (Akeson et al. 2002). The spectroscopic rotation velocity has been consistently measured at 66 km s-1 (Bouvier et al. 1986, Hartmann & Stauffer 1989, Głȩbocki & Gnaciński 2005). We adopt the value of sin=66.24.6 km s-1 reported by Hartmann et al. (1986). Combining these measurements with values of the stellar radius reported in the literature ( from DeWarf et al. (2003) and 3.6 from Petrov et al. (1996)), we find a range of expected rotation periods from 1.9–2.4 days. Including propagation of uncertainties in inclination and rotational velocity, this range expands to 1.7–2.6 days. The inferred periods are marginally inconsistent with the 2.66d timescale that we have measured photometrically.
Assuming that the variability is caused by features on the stellar surface, we find that the periodic component of the light curve could be accounted for by either a dark or bright spot at high latitude (80–85°). For the dark spot, we determine plausible ratios of spot to photospheric flux between 0.0 and 0.3, and a spot size of 28–40° (6–12% of the total stellar surface area). A bright spot, on the other hand, could be a factor of 2.0 or more brighter than the surrounding photosphere and up to 30–40° in size (7–12%).
As with V396 Aur, neither the addition of more spots nor adjustments in the limb darkening parameter offers substantial improvements in the model fit. We note that with the single band MOST observations, we are unable to distinguish a hot spot generated by an accretion shock from a cool spot generated by the stellar magnetic field. However, the unstable amplitude of variability from one cycle to the next in our light curve suggests that accretion may be a better explanation. Since the model light curves appear nearly identical, we overplot only the dark spot model on the orbit-binned light curve in Fig. 9, alongside the residuals after model subtraction. The full light curve of SU Aur shown in Fig. 1 displays inconsistent amplitudes from one cycle to the next. Examination of the residuals in Fig. 9 reveals that there are both positive and negative deviations, with no systematic trend. The minimum reduced value is over 4000 for all models, indicating a poor fit. We therefore suspect that there is an additional source of variability present, or that the periodic mechanism involves dynamic evolution on 1 day timescales. In Section 5.3 we propose that orbiting material at the inner disk edge of SU Aur offers an additional explanation for the observed periodicity.
4.3. HD 31305
HD 31305 is not a known member of the Taurus-Auriga star-forming region, but we include it in our presentation since it is also a bright star in our MOST field, and it exhibited surprising periodic variability. Full interpretation of the variability observed with MOST hinges on the status of this A0 target as a potential young star, a question which we defer to Section 5.2. A series of pronounced cyclic flux changes suggest that either an inhomogeneous stellar surface or orbiting circumstellar disk features play a role in the variability. Stellar pulsation is another periodic phenomenon present in early-type stars, but obvious inter-cycle changes in the light curve do not support this alternative explanation. With a period near 2.8 days and amplitude of 0.01 mag, the variability pattern displays significant deviation from sinusoidal behavior at the 0.5% level, none of which corresponds to significant periodicities in the periodogram.
We have attempted to model the overall behavior of the light curve with a series of dark or bright starspots. These could represent either regions of cooler surface temperature, patchy photospheric chemical composition such as observed in some peculiar type A stars (e.g., Shulyak et al. 2010, Kochukhov 2011), or hot spots related to low-level accretion. The inclination of HD 31305 is unknown, so we estimate it by considering the stellar parameters in concert with the sin value of 5025 km s-1 measured by Mooley et al. (2013, in preparation). Of note, this sin puts HD 31305 at the low end of the distribution of rotation rates for A stars (see Zorec & Royer 2012, , Fig. 7). Using , , , , , and magnitudes from the Simbad database along with a spectral type of A0, we derived a bolometric luminosity based on SED fitting. Using only the optical magnitudes, we derive a luminosity of log()=1.38. Since there is an infrared excess associated with this object, non-photopheric emission likely contaminates the SED at band and beyond; incorporating the magnitudes here results in a larger luminosity of log()=1.5. This range of luminosities, along with an A0 effective temperature of 9850 K results in a stellar radius of 1.850.09 . If the observed periodic variability is due to surface starspots, then the combination of the 2.97 d period and estimated radius require a sin of at most 31 km s-1. For a minimum sin of 20 km s-1, we derive =39°. To perform the spot modeling, we therefore adopted representative values of 40° and 70°.
From the configurations generated with Starspotz, we find that the light curve can be explained by either a single high-latitude (70–90°) spot subtending 1–20% of the stellar surface or two spots at a large range of latitudes, with diameters from 3–20° (up to 3% of the area). The best fitting two-spot solutions depend highly on the adopted unspotted stellar brightness, as well as the spot darkness, and do not favor any particular latitude. We attempted to add three spots, but this did not improve the fit.
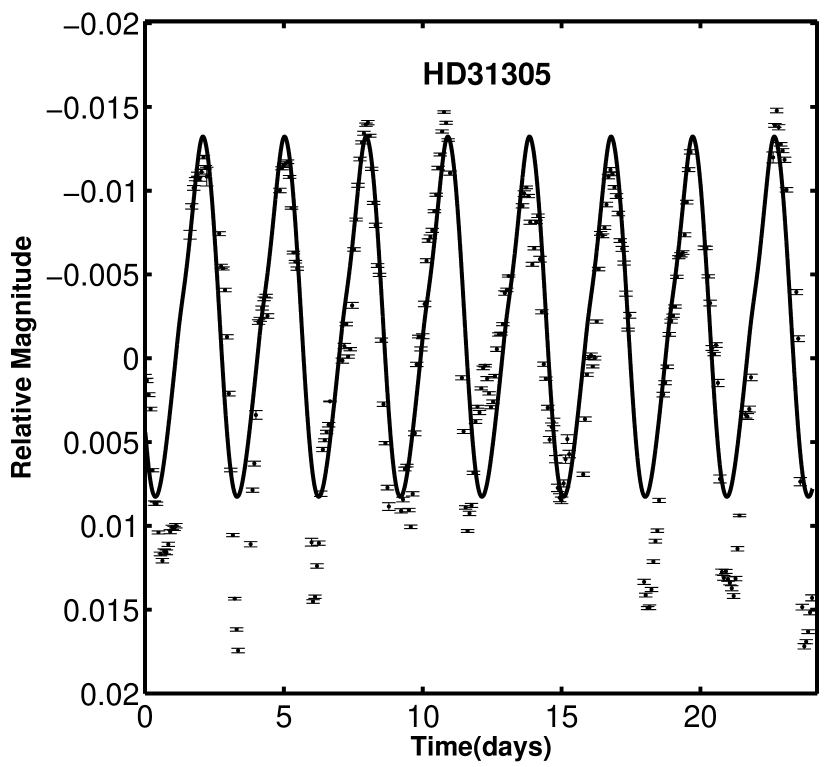
We have overlaid one of the best fitting models for HD 31305 on its light curve in Fig. 10. Deviations at the 0.5% level, as well as a reduced value larger than 1100, confirm that there remains significant aperiodic variation in the data.
4.4. AB Aurigae
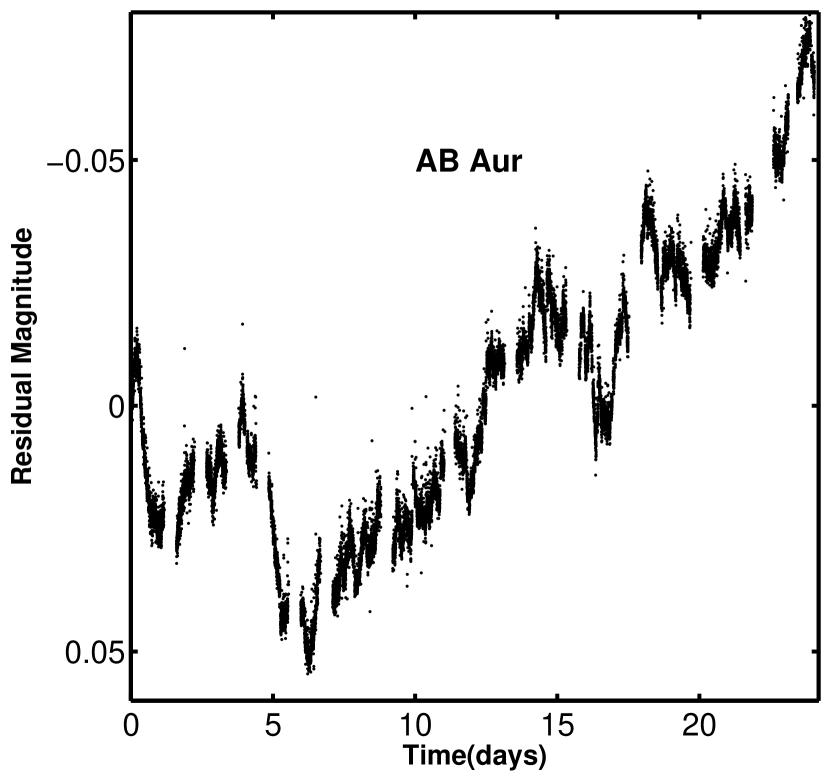
AB Aurigae is a Herbig Ae star with spectral type A0. A large body of observations has indicated that it is encircled by an optically thick, gas dominated disk from 0.24 AU to 300 AU (e.g., Tannirkulam et al. 2008, Oppenheimer et al. 2008). This disk is viewed almost face-on, at an inclination angle between 12 and 35° (Piétu et al. 2005, Fukagawa et al. 2004, Corder et al. 2005, Mariñas et al. 2006).
Previous photometric studies of AB Aur uncovered periodic variability on short timescales from 0.5–1.8 d (Table 2). Our analysis found a much longer period (6.59 d), with substantial aperiodic light curve components on both longer and shorter timescales. Evidence that this is not the star’s rotation period comes from the reported spectroscopic rotation velocity of sin=805 km s-1 (Bohm & Catala 1993) and larger, with a radius of 2.0–2.5 , assuming =38–47 from DeWarf et al. (2003) and Tannirkulam et al. (2008). These values are inconsistent with such a long period; even if were as large as 90°, the photometric period would have to be less than 1.6 days.
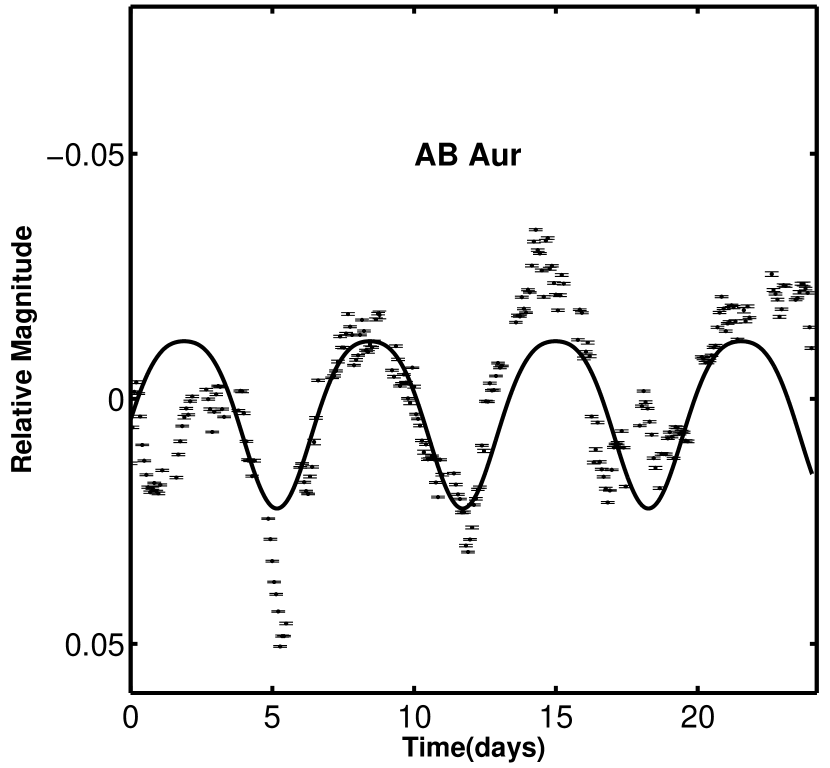
Consequently, the variability observed in AB Aur is not particularly amenable to spot model fitting. For completeness, and in case any of the reported parameters are erroneous, we have proceeded nevertheless to model its light curve using Starspotz. To begin, we subtracted out two linear trends at days 0–5 and 5–25 in the light curve, so that models could be fit to the shorter timescale (10 d) variability in AB Aur. We adopted two values for : 22° and 35°, matching the disk inclination values presented by Corder et al. (2005) and Perrin et al. (2009). Assuming one mid-latitude (20–60°) spot subtending 10–15° in diameter, we could reproduce some of the major trends of the data (see Fig. 11), and with a large number of small spots, we also reproduced some of the smaller fluctuations. The results were relatively insensitive to the limb darkening parameter and the spot darkness. As suspected, none of the spot coverage scenarios provides a particularly satisfactory model, with reduced values in excess of 3000. However, we cannot rule out that a spotted photosphere contributes to a portion of AB Aurigae’s variability. As discussed for HD 31305, the light curve behavior observed here is not readily understood in an A0 star.
5. Summary and discussion
We have presented high precision, high cadence light curves for four known Taurus-Auriga members as well as one newly suspected member, HD 31305. The stellar masses for these stars range from 0.5–2.5 . While our sample is not large, the high quality of the data has enabled us to probe young star variability down to sub-millimagnitude levels and search for low-amplitude and/or short-timescale phenomena.
5.1. Discussion of lightcurve analysis
Our investigation has resulted in the measurement of photometric periods for these objects, all of which display a single dominant periodicity. For cases in which the periodic behavior can be explained by starspots, we have modeled the possible configurations and found that one mid- to high-latitude spot provides a sufficient, but far from perfect, explanation for the periodic variability. This picture is largely consistent with the results of Siwak et al. (2011a), who carried out spot modeling of several variable young G and K stars. Among the periodic stars of their sample, they generally find a high latitude or polar spot (often large), and sometimes an additional smaller spot closer to the equator.
The main difference between our results and theirs is that we are unable to account for the full light curve behavior in our periodic objects using spot models alone. Additional aperiodic variability appears to be prevalent in the higher mass stars of our sample (AB Aur, SU Aur, and HD 31305) at the 0.1–1% level, based on the flicker noise profiles in their periodograms and the substantial residuals after subtraction of best-fit spot models. The variability patterns among these three objects is nevertheless distinct, with differing characteristic time scales found by our autocorrelation analysis (Section 3.3). Investigation of a larger sample of young variable stars may shed light on how these differences arise; we suspect that the inclination of surrounding disks and accretion columns plays a substantial role in the properties of observed variability. In the case of SU Aur, the dust is viewed nearly edge on (Akeson et al. 2002, Kurosawa et al. 2005), while for AB Aur, it is close to face on (Mariñas et al. 2006). Another nearly face-on object, TW Hya, was shown to by Siwak et al. (2011b) to exhibit intermittent and variable-period oscillations mixed with more stochastic variability. MHD simulations of disk accretion by Romanova et al. (2008) have shown that there is a regime of suitably high accretion rates for which the flow of material becomes unstable, and the resulting light curve is stochastic.
The accretion rate of SU Aur has been measured at a moderate 0.5– yr-1 (Calvet et al. 2004). Accretion rates reported for AB Aur, on the other hand, vary widely, from relatively high values of 1.4 and 3 yr-1 (Garcia Lopez et al. 2006, Brittain et al. 2007) to yr-1 and lower based on more indirect methods (Bohm & Catala 1993, Telleschi et al. 2007). It is therefore difficult to surmise whether how the variability observed in our target stars is connected with accretion properties.
Finally, we note that this work has resulted in the measurement of photometric rotation periods for both members of the binary V397 Aur. One period is close to but not exactly twice the other, suggesting that a tidal resonance may be operating in this system. The detection of multiple periods in a combined light curve also highlights the possibility that more close young binaries could be detected in this way without the need for extensive radial velocity data. For binaries in which the two rotation periods are similar, care must also be paid to distinguish the scenario from differential rotation.
5.2. HD 31305: An unusual variable young A star?
As discussed in Section 4.3, the MOST light curve of HD 31305 resembles that of an active young star. Only recent analysis (see below) has hinted that it may be a member of the few-Myr-old Taurus-Auriga star-forming complex. All prior literature has assumed it to be a background field star, and in some cases, used it as a photometric comparison star (e.g., Herbst et al. 1987, DeWarf et al. 2003)!
A clue to its potential youth status is the infrared excess detected by IRAS (identifier 04526+3015), implying that HD 31305 is encircled by dust at 390 K (Oudmaijer et al. 1992). Recent observations from the WISE mission (Rebull et al. 2011) corroborate the presence of infrared excess, although the star was listed as a background object due to the absence of Taurus-Auriga membership information. It star has also been reported to flare in the X-ray (Arzner et al. 2007) with a peak temperature of 8.6 keV (Franciosini et al. 2007). These properties are largely inconsistent with those of A-type main sequence stars, which are weak X-ray emitters (Linsky 2003). Additional evidence from Mooley et al. (2013, in preparation) bolsters the idea of a young age for HD 31305. They report a spectroscopic distance (17411 pc) and proper motion consistent with Taurus membership at the 80% confidence level. Their assembled SED from optical through mid-infrared wavelengths displays indications of a 10 m silicate feature, and a model fit implies a temperature of 350 K at the inner edge of the dust region, consistent with the value suggested by Oudmaijer et al. (1992). However, their low-resolution spectrum lacks emission lines, suggesting that the disk is not actively accreting. Miroshnichenko et al. (1997) pointed out that infrared excesses in HD 31305 and other A-type stars may be consistent with circumstellar dust shells. We alternatively suggest that it is weak enough to implicate a debris disk, since the ratio of infrared to stellar luminosity in the SED assembled by Mooley is 1:200. This scenario would not be inconsistent with an A star that is significantly older than 10 Myr, rather than the 3 Myr age of Taurus. Therefore, we cannot rule out that HD 31305 is a main sequence star, although its light curve behavior remains atypical and difficult to explain.
The variability itself has features in common with the other stars in our sample such as AB Aur, specifically a light curve including both periodic and aperiodic components. To our knowledge, such a mixture of behavior lacks a mechanism among main sequence stars. The most common explanation for non-eclipsing periodic variability– magnetic surface spots– is difficult to invoke for A stars since they are not believed to host substantial magnetic fields. The convective/radiative boundary vanishes for effective temperatures above 6000 K, implying the absence of a solar-like dynamo in these stars. Indeed, no spotted stars earlier than spectral type F8 (6300) have been observed. An exception is the class of chemically peculiar Ap and Bp stars, which retain magnetic fields left over as fossils from the formation process or produced by a turbulent dynamo in the core (Moss 1972). Objects in this class also exhibit large-scale chemical inhomogeneities on their surfaces, which are known to induce variability in the light curves of some Ap and Bp stars.
Although observational evidence for spots on high-mass stars remains weak, periodic variability in B-type main sequence stars attributed to rotational modulation has been detected in high-precision photometry from the CoRoT satellite (Degroote et al. 2011, Pápics et al. 2011) as well as with ground-based data (Briquet et al. 2001a, b, 2004). The periods of these B stars are between 0.3 and 2 days, while their amplitudes are 1–2% for the ground-based objects and a much lower 0.1–1 mmag for the objects observed with the high-precision CoRoT instrument. Perhaps more relevant to the question of HD 31305 are time series photometry from the Kepler mission indicating that up to 8% of main sequence A stars display spot activity (Balona 2011). Notably, though, all of these detections were at an amplitude level well below 0.5 mmag (see their Fig. 3)– a factor of 30 lower than the variability we detect in HD 31305. The possibility of spots on hot, non-peculiar stars is nevertheless supported by recent detections of weak magnetic fields in a handful of main sequence A stars including Vega (Lignières et al. 2009, Petit et al. 2010) and Sirius (Petit et al. 2011), as well as several hotter stars (Alecian et al. 2011). While the paradigm of limited magnetic activity in these objects may be weakening, the variability characteristics associated with them still does not appear to be a good match for the behavior we have observed in HD 31305.
In contrast, the younger Herbig Ae/Be stars are enveloped in a complex and dynamic environment including circumstellar disks, inflowing material, and possible outflows, which might provide an explanation for the aperiodic components of HD 31305’s light curve. These objects may also possess short-lived magnetic fields associated with the protostellar collapse and accretion processes. Such fields have been invoked to explain prominent X-ray emission observed in Herbig Ae stars (Swartz et al. 2005) and could be strong enough to generate surface spots responsible for the observed periodic variability. However, an analysis of the light curves of 230 Herbig Ae/Be stars (Herbst & Shevchenko 1999) revealed that while nearly all objects were variable, few displayed periodicities, on timescales up to 30 days, with amplitudes greater than several percent. An additional possibility involving magnetic field generated variability is that we are observing photometrically not the rotation of the stellar surface, but the passage of dust clouds in the inner disk. The location of material orbiting at a Keplerian rotation period of 3.0 days around a young A0 star with an assumed mass of 2.4 is 0.05 AU. This is an order of magnitude closer to the star than the location implied by the 350–390 K dust temperature estimates of Oudmaijer et al. (1992) and Mooley et al. (2013, in preparation). Therefore, for the variability to be associated with a disk process, we speculate that copious material would have to be spiraling in toward the host star. Without further information about the nature of HD 31305’s inclination and infrared excess, it is difficult to distinguish this scenario from periodic variability generated at the stellar surface.
A final option is that HD 31305 itself is not variable, but rather has a spotted lower mass companion contributing to the overall flux variations and producing the X-ray emission, as proposed by Arzner et al. (2007). We checked the Keck Observatory Archive and discovered an exposure of this star taken with the NIRC2 adaptive optics imaging system as part of engineering tests. The image reveals that there is indeed a companion lying 0.52″ away, at a position angle of 128.5°. We evaluate the possibility that this object is the source of variability in our MOST observations by considering its brightness and inferring the implied variability amplitude. Based on the NIRC2 image we estimate the companion to be 1.3 mag fainter than the primary A0 star at the band. Since a 0.5″ separation indicates a significant probability of association, we consider the case that the two stars are bound members of the 3 Myr Taurus-Auriga association. The TA-DA tool (Da Rio & Robberto 2012) enables us to compute isochrones, infer a mass or temperature for the companion, and calculate its expected brightness in the MOST band, assuming no extinction. Inputting =1.3, we find an expected companion temperature of 4900 K, or K2 spectral type. Integrating a K2 model spectrum over the MOST band from 350–750 nm, we predict the companion to be 3.7 mag fainter at optical wavelengths. Because of MOST’s 3″ pixel size, the light curve of HD 31305 includes all of the flux from this neighboring star. Thus the lower mass star contributes just over 3% of the total flux. To cause the observed 1.5% variations, the companion’s brightness would have to vary by 47%, or 94% peak to peak. This value is at the upper end (i.e., 1% level) of the stellar activity amplitude distribution for similar temperature stars (see Fig. 3 of Basri et al. 2010), and is exceedingly rare among K-type periodic pre main sequence stars (e.g., Stassun et al. 1999, Cohen et al. 2004). Furthermore, it is difficult to conceive of a spot large enough to cause such a substantial variability amplitude. Thus a spotted companion does not provide a likely explanation for the light curve behavior in our MOST time series.
We conclude that the variability may come from the A0 star itself. Given the lack of previous detections of periodic variability in main-sequence A stars, we believe the most likely scenario for HD 31305 is that it is relatively young and displays a heretofore undetected type of variability, which we tentatively associate with its dusty excess or a magnetic field.
5.3. The origin of periodic variability in SU Aurigae
Our MOST observations SU Aur have resulted in the first detection of clear periodic behavior in this star, at a period of 2.66 days. Although SU Aur has been monitored for years, analysis of its light curve has focused on the prominent fading events that led to its classification as an UXOR object. There have been a number of periodicity claims (see Table 2), but most were based on spectroscopic or X-ray data, and many of the periods were noted to have large uncertainties or marginal significance. We attempted to recover the 2.66 d periodicity in publicly available data from the T Tauri photometry database of Herbst et al. (1994) but failed to detect any peaks at the corresponding frequency (0.38 d-1) in the periodogram. It is conceivable that the combination of sparse sampling and systematic dimming events in that dataset may have masked transitory periodic behavior. Higher cadence monitoring is necessary to determine the fraction of time for which periodic variability manifests in SU Aur’s light curve.
As pointed out in Section 4.2, the sin value of SU Aur is 66.2 km s-1, with an uncertainty of 4.6 km s-1 (Hartmann et al. 1986). If the stellar inclination is in line with that of the disk (62°; Akeson et al. 2002), then the expected equatorial velocity is 757 km s-1. In this case, the only way to infer an rotation period as long as the one we have measured (2.66 d) is if the stellar radius is at least 3.6 . If we discount the disk inclination and raise to 90°, then the radius may be as low as 3.2 .
These values stand in contrast to the derived by DeWarf et al. (2003) from spectral energy distribution (SED) fitting. Cohen et al. (1989) reported a much larger radius (3.6 ), which we trace to the larger value of the bolometric luminosity derived by them (13 vs. 6 from DeWarf et al. (2003)). The stellar luminosity of SU Aur is difficult to determine accurately because of the disk contribution to its flux at near-infrared and infrared wavelengths. We have derived our own luminosity values using photometry listed in the SIMBAD database, along with reddening corrections from a fit to the SED (spectral type G2) and band-dependent bolometric corrections. Depending on the bands used, the stellar luminosity could lie anywhere between 7 and 30 . We favor the lower luminosities of 7–9 , as these result from SED fits to the , , and bands only and exclude contaminating emission from the disk at longer wavelengths. Taking these systematics into account, we estimate the radius of SU Aur to be between 2.9 and 3.2 . While we cannot rule out a higher luminosity and hence larger radius, the above estimates of spectroscopic rotation velocity and the 2.66 d period suggest that these values are unphysical.
The inconsistency between our measured periodicity and the inferred rotation rate of SU Aur leads us to believe that we may be witnessing the motion of a dust cloud or hot spot connected with this star’s inner disk. On the presumption that we are not observing starspots, but rather observing material in Keplerian orbit about the star, we can derive its location by adopting the mass of 2.00.1 derived by DeWarf et al. (2003). We find an orbital distance of 7.11011 cm, or 0.05 AU. Intriguingly, this is very close to the value of the inner disk edge reported by Akeson et al. (2002) based on interferometric observations of SU Aur (0.05–0.08 AU). We therefore conclude that the source of periodic variability observed during our MOST observations could be a structural or thermal feature on the inner disk edge, or possibly a discrete cloud of material orbiting along magnetic field lines (e.g., Ultchin et al. 1997) just interior to the disk.
Measurement of the rotation period of the inner disk also has implications for the angular momentum evolution of young stars, many of which are believed to be magnetically locked to their disks for at least a few Myr (see Cauley et al. 2012, for a recent summary). Our inference of a star rotating significantly faster (1.86 days, based on the sin and values adopted above) than the inner disk confronts this idea. The magnetic field lines connecting these two regions would likely be highly distorted by this velocity shear, and the properties of accretion flows could be quite different from those predicted by models involving corotating disks (Romanova et al. 2008). Alternatively, we could be observing disk material that is located farther out than the inner edge, and thus beyond the corotation radius.
5.4. Implications for future time series observations of young stars
We have seen that full characterization of young star variability requires a combination of high photometric precision, short cadence, and sufficiently long time baseline that is challenging to arrange. The appearance of both periodic and aperiodic variability suggests that it may be difficult to infer rotation periods with sparsely sampled data, as is usually the case from the ground. The large range of rotation periods reported for some of our targets underlines this problem.
In the cases of SU Aur and HD 31305, we have further suggested that periodic variability may not represent the stellar rotation period at all, if it is instead tied to the surrounding circumstellar disk. We therefore highlight a need for more comparisons of sin measurements with photometric periods detected in young stars with infrared excesses. We suggest that these measurements be carefully reviewed for stars displaying infrared excesses or spectroscopic accretion signatures suggestive of disks. Rotation period distributions for these objects typically have been derived from ground-based data, and in some clusters display bimodal structure (Herbst et al. 2002). Periodicities associated with regions many stellar radii above the star’s surface may contaminate rotation rate samples and thus bias our view of angular momentum evolution if not all young cluster stars are locked to their disks.
Different observational complications arise for aperiodically variable targets. Our timescale analysis has provided guidelines for the time sampling rate in photometric future campaigns. For objects with aperiodic light curve behavior, our results suggest that data need not be taken more frequently than every hour to characterize the stochastic components of variability in young stars at 1% precision. For higher signal-to-noise observations such as those presented here, cadences as short as five minutes can be used to probe lower amplitudes of the flicker noise. In addition, we find a wide range of coherence timescales characterizing the aperiodic variability, from 0.2 to 6.2 days. However, our very small sample may not be representative of all young stars, especially those in the very low mass range below 0.5 . In particular, accreting brown dwarfs may have shorter characteristic variability timescales, as measured by autocorrelation (e.g., Cody & Hillenbrand 2011). We thus encourage further high-precision, well sampled long baseline time series observations of young cluster members to expand the size and diversity of the variability dataset. Clearly, multi-wavelength data as well as high-resolution spectroscopy will provide much-needed feedback for model development.
References
- Akeson et al. (2002) Akeson, R. L., Ciardi, D. R., van Belle, G. T., & Creech-Eakman, M. J. 2002, ApJ, 566, 1124
- Alecian et al. (2011) Alecian, E., Wade, G. A., Catala, C., Bagnulo, S., Böhm, T., Bouret, J., Donati, J., Folsom, C., Grunhut, J., Landstreet, J. D., Petit, P., & Silvester, J. 2011, in Astronomical Society of the Pacific Conference Series, Vol. 449, Astronomical Society of the Pacific Conference Series, ed. P. Bastien, N. Manset, D. P. Clemens, & N. St-Louis, 275
- Alencar et al. (2010) Alencar, S. H. P., Teixeira, P. S., Guimarães, M. M., McGinnis, P. T., Gameiro, J. F., Bouvier, J., Aigrain, S., Flaccomio, E., & Favata, F. 2010, A&A, 519, A88+
- Arzner et al. (2007) Arzner, K., Güdel, M., Briggs, K., Telleschi, A., & Audard, M. 2007, A&A, 468, 477
- Balona (2011) Balona, L. A. 2011, MNRAS, 415, 1691
- Basri et al. (2010) Basri, G., Walkowicz, L. M., Batalha, N., Gilliland, R. L., Jenkins, J., Borucki, W. J., Koch, D., Caldwell, D., Dupree, A. K., Latham, D. W., Meibom, S., Howell, S., & Brown, T. 2010, ApJ, 713, L155
- Bohm & Catala (1993) Bohm, T., & Catala, C. 1993, A&AS, 101, 629
- Bouvier et al. (1986) Bouvier, J., Bertout, C., Benz, W., & Mayor, M. 1986, A&A, 165, 110
- Bouvier et al. (1993a) Bouvier, J., Cabrit, S., Fernandez, M., Martin, E. L., & Matthews, J. M. 1993a, A&AS, 101, 485
- Bouvier et al. (1993b) —. 1993b, A&A, 272, 176
- Bouvier et al. (1995) Bouvier, J., Covino, E., Kovo, O., Martin, E. L., Matthews, J. M., Terranegra, L., & Beck, S. C. 1995, A&A, 299, 89
- Box & Jenkins (1976) Box, G. E. P., & Jenkins, G. M., eds. 1976, Time series analysis. Forecasting and control
- Breger et al. (1993) Breger, M., Stich, J., Garrido, R., Martin, B., Jiang, S. Y., Li, Z. P., Hube, D. P., Ostermann, W., Paparo, M., & Scheck, M. 1993, A&A, 271, 482
- Briquet et al. (2001a) Briquet, M., Aerts, C., & De Cat, P. 2001a, A&A, 366, 121
- Briquet et al. (2004) Briquet, M., Aerts, C., Lüftinger, T., De Cat, P., Piskunov, N. E., & Scuflaire, R. 2004, A&A, 413, 273
- Briquet et al. (2001b) Briquet, M., De Cat, P., Aerts, C., & Scuflaire, R. 2001b, A&A, 380, 177
- Brittain et al. (2007) Brittain, S. D., Simon, T., Najita, J. R., & Rettig, T. W. 2007, ApJ, 659, 685
- Budding (1977) Budding, E. 1977, Ap&SS, 48, 207
- Calvet et al. (2004) Calvet, N., Muzerolle, J., Briceño, C., Hernández, J., Hartmann, L., Saucedo, J. L., & Gordon, K. D. 2004, AJ, 128, 1294
- Carpenter et al. (2001) Carpenter, J. M., Hillenbrand, L. A., & Skrutskie, M. F. 2001, AJ, 121, 3160
- Carpenter et al. (2002) Carpenter, J. M., Hillenbrand, L. A., Skrutskie, M. F., & Meyer, M. R. 2002, AJ, 124, 1001
- Catala et al. (1999) Catala, C., Donati, J. F., Böhm, T., Landstreet, J., Henrichs, H. F., Unruh, Y., Hao, J., Collier Cameron, A., Johns-Krull, C. M., Kaper, L., Simon, T., Foing, B. H., Cao, H., Ehrenfreund, P., Hatzes, A. P., Huang, L., de Jong, J. A., Kennelly, E. J., ten Kulve, E., Mulliss, C. L., Neff, J. E., Oliveira, J. M., Schrijvers, C., Stempels, H. C., Telting, J. H., Walton, N., & Yang, D. 1999, A&A, 345, 884
- Cauley et al. (2012) Cauley, P. W., Johns-Krull, C. M., Hamilton, C. M., & Lockhart, K. 2012, ApJ, 756, 68
- Claret & Bloemen (2011) Claret, A., & Bloemen, S. 2011, A&A, 529, A75
- Cody & Hillenbrand (2010) Cody, A. M., & Hillenbrand, L. A. 2010, ApJS, 191, 389
- Cody & Hillenbrand (2011) —. 2011, ApJ, 741, 9
- Cohen et al. (1989) Cohen, M., Emerson, J. P., & Beichman, C. A. 1989, ApJ, 339, 455
- Cohen et al. (2004) Cohen, R. E., Herbst, W., & Williams, E. C. 2004, AJ, 127, 1602
- Corder et al. (2005) Corder, S., Eisner, J., & Sargent, A. 2005, ApJ, 622, L133
- Croll et al. (2006) Croll, B., Walker, G. A., Kuschnig, R., Matthews, J. M., Rowe, J. F., Walker, A., Rucinski, S. M., Hatzes, A. P., Cochran, W. D., Robb, R. M., Guenther, D. B., Moffat, A. F., Sasselov, D., & Weiss, W. W. 2006, in Bulletin of the American Astronomical Society, Vol. 38, American Astronomical Society Meeting Abstracts, 230.02
- Da Rio & Robberto (2012) Da Rio, N., & Robberto, M. 2012, AJ, 144, 176
- Deeming (1975) Deeming, T. J. 1975, Ap&SS, 36, 137
- Degroote et al. (2011) Degroote, P., Acke, B., Samadi, R., Aerts, C., Kurtz, D. W., Noels, A., Miglio, A., Montalbán, J., Bloemen, S., Baglin, A., Baudin, F., Catala, C., Michel, E., & Auvergne, M. 2011, A&A, 536, A82
- DeWarf et al. (2003) DeWarf, L. E., Sepinsky, J. F., Guinan, E. F., Ribas, I., & Nadalin, I. 2003, ApJ, 590, 357
- Dorren (1987) Dorren, J. D. 1987, ApJ, 320, 756
- Foster (1996) Foster, G. 1996, AJ, 112, 1709
- Franciosini et al. (2007) Franciosini, E., Scelsi, L., Pallavicini, R., & Audard, M. 2007, A&A, 471, 951
- Fukagawa et al. (2004) Fukagawa, M., Hayashi, M., Tamura, M., Itoh, Y., Hayashi, S. S., Oasa, Y., Takeuchi, T., Morino, J.-i., Murakawa, K., Oya, S., Yamashita, T., Suto, H., Mayama, S., Naoi, T., Ishii, M., Pyo, T.-S., Nishikawa, T., Takato, N., Usuda, T., Ando, H., Iye, M., Miyama, S. M., & Kaifu, N. 2004, ApJ, 605, L53
- Garcia Lopez et al. (2006) Garcia Lopez, R., Natta, A., Testi, L., & Habart, E. 2006, A&A, 459, 837
- Głȩbocki & Gnaciński (2005) Głȩbocki, R., & Gnaciński, P. 2005, in ESA Special Publication, Vol. 560, 13th Cambridge Workshop on Cool Stars, Stellar Systems and the Sun, ed. F. Favata, G. A. J. Hussain, & B. Battrick, 571
- Grankin et al. (2008) Grankin, K. N., Bouvier, J., Herbst, W., & Melnikov, S. Y. 2008, A&A, 479, 827
- Grankin et al. (2007) Grankin, K. N., Melnikov, S. Y., Bouvier, J., Herbst, W., & Shevchenko, V. S. 2007, A&A, 461, 183
- Günther et al. (2010) Günther, H. M., Lewandowska, N., Hundertmark, M. P. G., Steinle, H., Schmitt, J. H. M. M., Buckley, D., Crawford, S., O’Donoghue, D., & Vaisanen, P. 2010, A&A, 518, A54
- Hareter et al. (2008) Hareter, M., Reegen, P., Kuschnig, R., Weiss, W. W., Matthews, J. M., Rucinski, S. M., Guenther, D. B., Moffat, A. F. J., Sasselov, D., & Walker, G. A. H. 2008, Communications in Asteroseismology, 156, 48
- Hartmann et al. (1986) Hartmann, L., Hewett, R., Stahler, S., & Mathieu, R. D. 1986, ApJ, 309, 275
- Hartmann & Stauffer (1989) Hartmann, L., & Stauffer, J. R. 1989, AJ, 97, 873
- Hartmann et al. (1987) Hartmann, L. W., Soderblom, D. R., & Stauffer, J. R. 1987, AJ, 93, 907
- Herbig (1962) Herbig, G. H. 1962, Advances in Astronomy and Astrophysics, 1, 47
- Herbst et al. (2002) Herbst, W., Bailer-Jones, C. A. L., Mundt, R., Meisenheimer, K., & Wackermann, R. 2002, A&A, 396, 513
- Herbst et al. (1987) Herbst, W., Booth, J. F., Koret, D. L., Zajtseva, G. V., Shakhovskaya, H. I., Vrba, F. J., Covino, E., Terranegra, L., Vittone, A., Hoff, D., Kelsey, L., Lines, R., & Barksdale, W. 1987, AJ, 94, 137
- Herbst et al. (1994) Herbst, W., Herbst, D. K., Grossman, E. J., & Weinstein, D. 1994, AJ, 108, 1906
- Herbst & Shevchenko (1999) Herbst, W., & Shevchenko, V. S. 1999, AJ, 118, 1043
- Huerta et al. (2008) Huerta, M., Johns-Krull, C. M., Prato, L., Hartigan, P., & Jaffe, D. T. 2008, ApJ, 678, 472
- Irwin & Bouvier (2009) Irwin, J., & Bouvier, J. 2009, in IAU Symposium, Vol. 258, IAU Symposium, ed. E. E. Mamajek, D. R. Soderblom, & R. F. G. Wyse, 363–374
- Johns & Basri (1995) Johns, C. M., & Basri, G. 1995, ApJ, 449, 341
- Joy (1945) Joy, A. H. 1945, ApJ, 102, 168
- Kochukhov (2011) Kochukhov, O. 2011, in IAU Symposium, Vol. 273, IAU Symposium, 249–255
- Koldoba et al. (2008) Koldoba, A. V., Ustyugova, G. V., Romanova, M. M., & Lovelace, R. V. E. 2008, MNRAS, 388, 357
- Kraus et al. (2011) Kraus, A. L., Ireland, M. J., Martinache, F., & Hillenbrand, L. A. 2011, ApJ, 731, 8
- Kurosawa et al. (2005) Kurosawa, R., Harries, T. J., & Symington, N. H. 2005, MNRAS, 358, 671
- Kuschnig (2009) Kuschnig, R. 2009, Communications in Asteroseismology, 158, 162
- Lenz & Breger (2005) Lenz, P., & Breger, M. 2005, Communications in Asteroseismology, 146, 53
- Lignières et al. (2009) Lignières, F., Petit, P., Böhm, T., & Aurière, M. 2009, A&A, 500, L41
- Linsky (2003) Linsky, J. L. 2003, Advances in Space Research, 32, 917
- Mariñas et al. (2006) Mariñas, N., Telesco, C. M., Fisher, R. S., Packham, C., & Radomski, J. T. 2006, ApJ, 653, 1353
- Mathieu et al. (1989) Mathieu, R. D., Walter, F. M., & Myers, P. C. 1989, AJ, 98, 987
- Matthews et al. (2004) Matthews, J. M., Kuschnig, R., Guenther, D. B., Walker, G. A. H., Moffat, A. F. J., Rucinski, S. M., Sasselov, D., & Weiss, W. W. 2004, Nature, 430, 51
- Miroshnichenko et al. (1997) Miroshnichenko, A., Ivezic, Z., & Elitzur, M. 1997, ApJ, 475, L41
- Morales-Calderón et al. (2011) Morales-Calderón, M., Stauffer, J. R., Hillenbrand, L. A., Gutermuth, R., Song, I., Rebull, L. M., Plavchan, P., Carpenter, J. M., Whitney, B. A., Covey, K., Alves de Oliveira, C., Winston, E., McCaughrean, M. J., Bouvier, J., Guieu, S., Vrba, F. J., Holtzman, J., Marchis, F., Hora, J. L., Wasserman, L. H., Terebey, S., Megeath, T., Guinan, E., Forbrich, J., Huélamo, N., Riviere-Marichalar, P., Barrado, D., Stapelfeldt, K., Hernández, J., Allen, L. E., Ardila, D. R., Bayo, A., Favata, F., James, D., Werner, M., & Wood, K. 2011, ApJ, 733, 50
- Norton et al. (2007) Norton, A. J., Wheatley, P. J., West, R. G., Haswell, C. A., Street, R. A., Collier Cameron, A., Christian, D. J., Clarkson, W. I., Enoch, B., Gallaway, M., Hellier, C., Horne, K., Irwin, J., Kane, S. R., Lister, T. A., Nicholas, J. P., Parley, N., Pollacco, D., Ryans, R., Skillen, I., & Wilson, D. M. 2007, A&A, 467, 785
- Oppenheimer et al. (2008) Oppenheimer, B. R., Brenner, D., Hinkley, S., Zimmerman, N., Sivaramakrishnan, A., Soummer, R., Kuhn, J., Graham, J. R., Perrin, M., Lloyd, J. P., Roberts, Jr., L. C., & Harrington, D. M. 2008, ApJ, 679, 1574
- Orlando et al. (2010) Orlando, S., Sacco, G. G., Argiroffi, C., Reale, F., Peres, G., & Maggio, A. 2010, A&A, 510, 71
- Oudmaijer et al. (1992) Oudmaijer, R. D., van der Veen, W. E. C. J., Waters, L. B. F. M., Trams, N. R., Waelkens, C., & Engelsman, E. 1992, A&AS, 96, 625
- Pápics et al. (2011) Pápics, P. I., Briquet, M., Auvergne, M., Aerts, C., Degroote, P., Niemczura, E., Vučković, M., Smolders, K., Poretti, E., Rainer, M., Hareter, M., Baglin, A., Baudin, F., Catala, C., Michel, E., & Samadi, R. 2011, A&A, 528, A123
- Percy et al. (2006) Percy, J. R., Gryc, W. K., Wong, J. C.-Y., & Herbst, W. 2006, PASP, 118, 1390
- Perrin et al. (2009) Perrin, M. D., Schneider, G., Duchene, G., Pinte, C., Grady, C. A., Wisniewski, J. P., & Hines, D. C. 2009, ApJ, 707, L132
- Petit et al. (2011) Petit, P., Lignières, F., Aurière, M., Wade, G. A., Alina, D., Ballot, J., Böhm, T., Jouve, L., Oza, A., Paletou, F., & Théado, S. 2011, A&A, 532, L13
- Petit et al. (2010) Petit, P., Lignières, F., Wade, G. A., Aurière, M., Böhm, T., Bagnulo, S., Dintrans, B., Fumel, A., Grunhut, J., Lanoux, J., Morgenthaler, A., & Van Grootel, V. 2010, A&A, 523, A41
- Petrov et al. (1996) Petrov, P. P., Gullbring, E., Ilyin, I., Gahm, G. F., Tuominen, I., Hackman, T., & Loden, K. 1996, A&A, 314, 821
- Piétu et al. (2005) Piétu, V., Guilloteau, S., & Dutrey, A. 2005, A&A, 443, 945
- Praderie et al. (1986) Praderie, F., Catala, C., Simon, T., & Boesgaard, A. M. 1986, ApJ, 303, 311
- Rebull (2011) Rebull, L. M. 2011, in Astronomical Society of the Pacific Conference Series, Vol. 448, 16th Cambridge Workshop on Cool Stars, Stellar Systems, and the Sun, ed. C. Johns-Krull, M. K. Browning, & A. A. West, 5
- Rebull et al. (2011) Rebull, L. M., Koenig, X. P., Padgett, D. L., Terebey, S., McGehee, P. M., Hillenbrand, L. A., Knapp, G. R., Leisawitz, D., Liu, W., Noriega-Crespo, A., Ressler, M. E., Stapelfeldt, K. R., Fajardo-Acosta, S., & Mainzer, A. 2011, ApJS, 196, 4
- Reegen et al. (2006) Reegen, P., Kallinger, T., Frast, D., Gruberbauer, M., Huber, D., Matthews, J. M., Punz, D., Schraml, S., Weiss, W. W., Kuschnig, R., Moffat, A. F. J., Walker, G. A. H., Guenther, D. B., Rucinski, S. M., & Sasselov, D. 2006, MNRAS, 367, 1417
- Romanova et al. (2008) Romanova, M. M., Kulkarni, A. K., & Lovelace, R. V. E. 2008, ApJ, 673, L171
- Rowe et al. (2006) Rowe, J. F., Matthews, J. M., Kuschnig, R., Guenther, D. B., Moffat, A. F. J., Rucinski, S. M. R., Sasselov, D., Walker, G. A. H., & Weiss, W. W. 2006, Mem. Soc. Astron. Italiana, 77, 282
- Rucinski et al. (2008) Rucinski, S. M., Matthews, J. M., Kuschnig, R., Pojmański, G., Rowe, J., Guenther, D. B., Moffat, A. F. J., Sasselov, D., Walker, G. A. H., & Weiss, W. W. 2008, MNRAS, 391, 1913
- Rucinski et al. (2010) Rucinski, S. M., Zwintz, K., Hareter, M., Pojmański, G., Kuschnig, R., Matthews, J. M., Guenther, D. B., Moffat, A. F. J., Sasselov, D., & Weiss, W. W. 2010, A&A, 522, A113
- Shulyak et al. (2010) Shulyak, D., Krtička, J., Mikulášek, Z., Kochukhov, O., & Lüftinger, T. 2010, A&A, 524, A66
- Siwak et al. (2011a) Siwak, M., Rucinski, S. M., Matthews, J. M., Kuschnig, R., Guenther, D. B., Moffat, A. F. J., Sasselov, D., & Weiss, W. W. 2011a, MNRAS, 415, 1119
- Siwak et al. (2011b) Siwak, M., Rucinski, S. M., Matthews, J. M., Pojmański, G., Kuschnig, R., Guenther, D. B., Moffat, A. F. J., Sasselov, D., & Weiss, W. W. 2011b, MNRAS, 410, 2725
- Stassun et al. (1999) Stassun, K. G., Mathieu, R. D., Mazeh, T., & Vrba, F. J. 1999, AJ, 117, 2941
- Swartz et al. (2005) Swartz, D. A., Drake, J. J., Elsner, R. F., Ghosh, K. K., Grady, C. A., Wassell, E., Woodgate, B. E., & Kimble, R. A. 2005, ApJ, 628, 811
- Tannirkulam et al. (2008) Tannirkulam, A., Monnier, J. D., Harries, T. J., Millan-Gabet, R., Zhu, Z., Pedretti, E., Ireland, M., Tuthill, P., ten Brummelaar, T., McAlister, H., Farrington, C., Goldfinger, P. J., Sturmann, J., Sturmann, L., & Turner, N. 2008, ApJ, 689, 513
- Telleschi et al. (2007) Telleschi, A., Güdel, M., Briggs, K. R., Skinner, S. L., Audard, M., & Franciosini, E. 2007, A&A, 468, 541
- Ultchin et al. (1997) Ultchin, Y., Regev, O., & Bertout, C. 1997, ApJ, 486, 397
- Unruh et al. (2004) Unruh, Y. C., Donati, J.-F., Oliveira, J. M., Collier Cameron, A., Catala, C., Henrichs, H. F., Johns-Krull, C. M., Foing, B., Hao, J., Cao, H., Landstreet, J. D., Stempels, H. C., de Jong, J. A., Telting, J., Walton, N., Ehrenfreund, P., Hatzes, A. P., Neff, J. E., Böhm, T., Simon, T., Kaper, L., Strassmeier, K. G., & Granzer, T. 2004, MNRAS, 348, 1301
- Walker et al. (2003) Walker, G., Matthews, J., Kuschnig, R., Johnson, R., Rucinski, S., Pazder, J., Burley, G., Walker, A., Skaret, K., Zee, R., Grocott, S., Carroll, K., Sinclair, P., Sturgeon, D., & Harron, J. 2003, PASP, 115, 1023
- Walker et al. (2007) Walker, G. A. H., Croll, B., Kuschnig, R., Walker, A., Rucinski, S. M., Matthews, J. M., Guenther, D. B., Moffat, A. F. J., Sasselov, D., & Weiss, W. W. 2007, ApJ, 659, 1611
- Walker et al. (2005) Walker, G. A. H., Kuschnig, R., Matthews, J. M., Cameron, C., Saio, H., Lee, U., Kambe, E., Masuda, S., Guenther, D. B., Moffat, A. F. J., Rucinski, S. M., Sasselov, D., & Weiss, W. W. 2005, ApJ, 635, L77
- Walter et al. (1988) Walter, F. M., Brown, A., Mathieu, R. D., Myers, P. C., & Vrba, F. J. 1988, AJ, 96, 297
- Zakirov et al. (1993) Zakirov, M. M., Azimov, A. A., & Grankin, K. N. 1993, Information Bulletin on Variable Stars, 3898, 1
- Zorec & Royer (2012) Zorec, J., & Royer, F. 2012, A&A, 537, 120
- Zwintz et al. (2009) Zwintz, K., Kallinger, T., Guenther, D. B., Gruberbauer, M., Huber, D., Rowe, J., Kuschnig, R., Weiss, W. W., Matthews, J. M., Moffat, A. F. J., Rucinski, S. M., Sasselov, D., Walker, G. A. H., & Casey, M. P. 2009, A&A, 494, 1031