-titleAgeing low-mass stars: from red giants to white dwarfs
Red Giant evolution and specific problems
Abstract
In spite of the great effort made in the last decades to improve our understanding of stellar evolution, significant uncertainties still remain due to our poor knowledge of some complex physical processes that still require an empirical calibration, such as the efficiency of convective heat transport and interior mixing. Here we will review the impact of these uncertainties on the evolution of red giant stars.
1 Introduction
Thanks to the efforts of many different groups in the last decades, stellar evolution has now reached a high degree of accuracy and completeness. Indeed, it can now account for a variety of internal physical processes, follow the most advanced phases and deal with different chemical compositions, so that one could in principle reproduce any stellar environment disclosed by the continuously advancing observational facilities. At the same time observations themselves have become more and more detailed, even providing direct access to star interiors, like in the case of asteroseismology, thus posing a real challenge to theory. In spite of these efforts, physical processes exist that, because of their complexity, still suffer of large uncertainties with a straightforward drawback: models lose their predictive power. This is crucial when dealing with advanced evolutionary phases, e.g. the Red Giant Branch (RGB) and the Asymptotic Giant Branch (AGB), and stellar populations that are not well represented in the solar vicinity or in our Galaxy. In fact, we know that about half of the stars in Universe were formed in elliptical galaxies under very different environmental conditions. From the theoretical point of view there are key questions which still lack a definitive answer, namely: Does the mixing length parameter depend on metallicity ? Which is the efficiency of convective overshoot ? How much does mass loss on the RGB depend on metallicity ?
This review is not intended to tackle these issues, but rather it will summarise the current theoretical situation with particular emphasis on evolved stars during the RGB and He-burning phases, for which the above uncertainties become more critical. We may expect that adding new dimensions to the HR diagram, such as those provided by asteroseismology, could allow the biggest improvements just where the uncertainties are the largest.
2 The PARSEC code
Here we briefly review the basic physics input used to compute stellar evolution models. We refer in particular to the new code developed in Padova, PARSEC ( Padova T Rieste Stellar Evolution Code), with which we obtained many of the results presented here. A detailed description can be found in Bressan12
2.1 Equation of state, nuclear reaction rates, opacities and neutrino emission
The equation of state (EOS) is computed with the FreeEOS code developed and updated over the years by A.W. Irwin 111http://freeeos.sourceforge.net/. The FreeEOS package is fully implemented in our code and we may use it “on-the-fly” but, since the pre-tabulated version is much faster and sufficiently accurate for most of our purposes, we proceed by pre-computing suitable tables and by interpolating between them. As shown by Bressan et al., differences between the two methods are negligible.
Opacities in the high-temperature regime, , are obtained from the Opacity Project At Livermore (OPAL) team Igle while, in the low-temperature regime, , we use opacities generated with our ÆSOPUS222http://stev.oapd.inaf.it/aesopus code Marigo09 . Conductive opacities are included following Itoh08 . The nuclear reaction network consists of the p-p chains, the CNO tri-cycle, the Ne–Na and Mg–Al chains, and the most important -capture reactions, including the -n reactions. The network solves for the abundances of chemical species: 1H, D, 3He, 4He,7Li, 8Be, 4He, 12C, 13C, 14N, 15N, 16N, 17N, 18O, 19F, 20Ne, 21Ne, 22Ne, 23Na, 24Mg, 25Mg, 26Mg, 26Alm, 26Alg, 27Al, 28Si. In total we consider reaction rates, that are taken from the recommended rates in the JINA reaclib database Cyb10 from which we also take the corresponding -values. The electron screening factors for all reactions are those from Dewitt and Grab .
The abundances of the various elements are evaluated with the aid of a semi-implicit extrapolation scheme, without assuming nuclear equilibrium and requiring the conservation of the total number of nucleons during the evolution Marigo01 . Energy losses by electron neutrinos are taken from Mun and Itoh83 , but for plasma neutrinos, for which we use the fitting formulae provided by Haft .
The energy transport in the convective regions is described according to the mixing-length theory of BV . The super-adiabatic gradient is maintained until its difference with respect to the adiabatic one decreases below . The mixing length parameter is fixed by means of the solar model calibration described below, and turns out to be .
Microscopic diffusion is included following the implementation by sala . The diffusion coefficients are calculated following Thoul and the corresponding system of second order differential equations is solved together with the chemistry equation network, at the end of each equilibrium model. Diffusion is applied to all the elements considered in the code in the approximations that they are all fully ionized.
3 The solar model
The comparison with the solar model is a necessary step to check the quality of the input physics, to calibrate the free parameters that cannot be directly derived from the theory, such as the Mixing Length parameter, and to obtain the initial solar abundance of helium and metals.
3.1 The solar partition of heavy elements
The full reference distribution of metals in the Sun consists of chemical elements333A few elements (Po, At, Rn, Fr, Ra, Ac, and Pa) are assigned negligible abundances. from Li to U, with abundances taken from the compilation by GS98 (GS98). However for a subset of species we adopt the abundances recently revised by CA (and references therein, CA11). According to this abundance compilation, the present-day Sun’s metallicity is . This value is intermediate between the most recent estimates, e.g. of Lodders or of Asplund (AGSS), and the previous value of by GS98. We refer to Grevesse (this volume) for a discussion of the different estimates. We remind here that the assumption of a different metallicity for the Sun bears indirectly on the location of the RG stars, because it affects directly the calibration of the MLT parameter, as discussed below. Other partitions of heavy elements, , have been considered, following the evidence of different chemical evolution paths in our own Galaxy and in the outer galaxies (e.g. -enhanced mixtures).
| Solar data | Model | |||||
| Value⊙ | error | source | Tab-EOS | Fly-EOS | ||
| (1033erg s-1) | 3.846 | 0.005 | Guen | 3.848 | 3.841 | |
| (1010 cm) | 6.9598 | 0.001 | Guen | 6.9584 | 6.96112 | |
| (K) | 5778 | 8 | from & | 5779 | 5775 | |
| 0.01524 | 0.0015 | CA | 0.01597 | 0.01595 | ||
| 0.2485 | 0.0035 | Basu04 | 0.24787 | 0.24762 | ||
| 0.0207 | 0.0015 | from and | 0.02169 | 0.02166 | ||
| 0.713 | 0.001 | Basu97 | 0.7125 | 0.7129 | ||
| 0.1921 | 0.0001 | Basu09 ) | 0.1887 | 0.1881 | ||
| cm/s | 2.2356 | 0.0001 | Basu09 | 2.2359 | 2.2364 | |
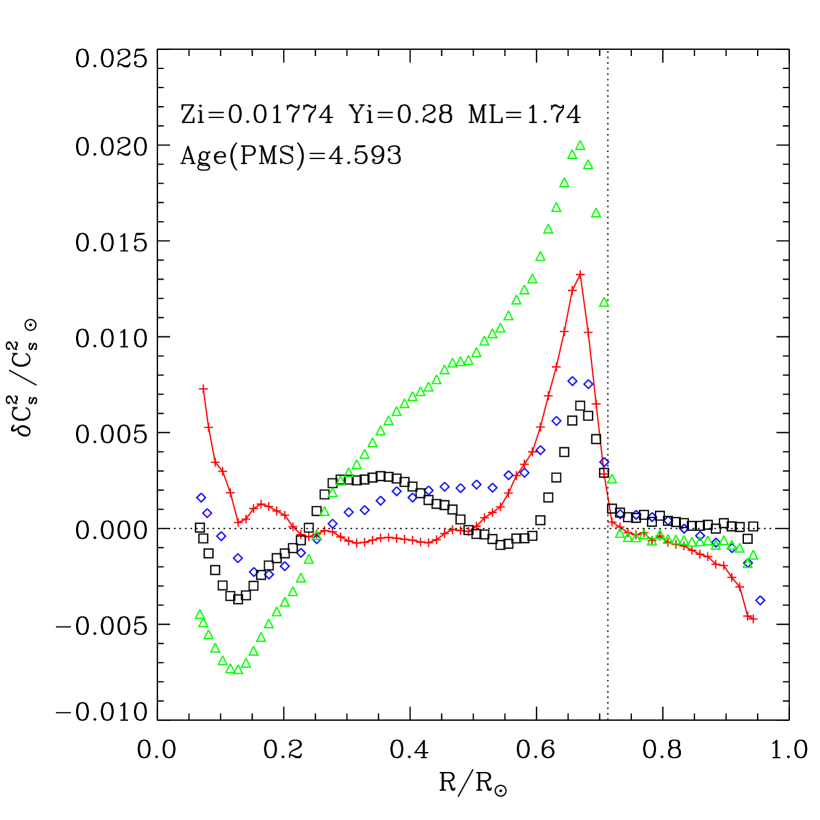
For the Tab-EOS model the derived parameters are =0.01774, =0.28, =1.74 and Age=4.593 Gyr. Assuming for the Fly-EOS the same initial parameters, we get an age of 4.622 Gyr. Age includes the pre main sequence phase.
With the scaled-solar partition of heavy elements , we have computed a large grid of solar models from the PMS phase to an age of 4.8 Gyr, varying the initial composition, and and the mixing length parameter . To calibrate these free parameters, the models were compared with a set of solar data obtained from the literature which are summarized in Table 1. The reference solar data used here come from MDI observations described in Basu00 . More recent data can be found in Basu09 from the BiSON experiment. However since we intend to consider the effects of changing the present-day surface solar composition, we have found it more convenient using the Basu00 data, with respect to which several comparisons at different chemical compositions are available in literature. Since an important goal of the comparison is to obtain the mixing length parameter that will be used to compute all other stellar evolutionary sets, the calibration has been performed exactly with the same set-up used for the calculations of the other tracks, i.e. with tabulated EOS and opacities and, of course, using microscopic diffusion. For sake of comparison we have also computed a solar model with the “on-the-fly” version of FreeEOS, adopting the parameters of the best fit obtained with the tabulated EOS, but changing the solar age in order to match as well as possible the solar data. The parameters of our best model are also listed in Table 1.
In Fig. 1 we plot the relative variation of the squared sound speed , as a function of the fractional radius inside the Sun (red crosses and solid line). The solar values were obtained from MDI data Basu00 . In the same figure we also show: the Basu09 model differences with respect to MDI data, obtained with the GS98 solar abundances (blue diamonds); the sere difference profile using GS98 (black squares) or AGSS solar abundances (green triangles), respectively. The quoted age includes the PMS lifetime, here defined as the time elapsed until when the total gravitational luminosity first goes to zero on the ZAMS. The PMS lifetime amounts to about 40 Myr. We see that our solar model performs fairly well, also in consideration of the fact that lowering the solar metallicity relative to the GS98 value was generally found to worsen the comparison between the models and the solar data.
Particularly encouraging are the small values of the in the central radiative regions of the Sun, indicating that a good agreement is feasible also with abundances lower than those of GS98. Towards the central regions our model predicts sound speed and density somewhat lower than the measured solar values. A similar, though less pronounced problem, is also present in the comparison of the models with the solar data extracted from the Bison experiment Basu09 . For the track computed with the “on-the-fly” FreeEOS we did not repeat the whole calibration process but we may also obtain a fairly good agreement with the solar data, by slightly increasing the age.
4 The evolution after the Main Sequence
Besides the choice of the microscopic physics, the evolution after the main sequence is affected by mixing processes related to the efficiency of convective core overshoot, atomic diffusion and rotation. For the latter, not yet implemented in PARSEC, we refer to the discussion by Eggenberger in this volume. In PARSEC we adopt a maximum overshooting efficiency , i.e. a moderate amount of overshooting, which coincides with the values adopted in the previous Bertelli and Gir00 models. This corresponds to about of overshoot region above the convective border found in other common formalisms. It is well known that there are theoretical difficulties in defining the efficiency of overshooting in the transition region between stars with radiative cores and those with convective cores (e.g. Aparicio ). In this region, say between where and depend from the chemical composition, we assume that the overshooting efficiency increases linearly with mass from zero to the maximum value. is defined as the initial stellar mass that maintains a persistent convective core during H-burning. Practically, is the minimum mass of a star in which a convective core is still present even after its central hydrogen has decreased by a significant amount (0.2) from the beginning of the main sequence. is set equal to +0.3. This choice is supported by the modelling of the open cluster M 67 (see Bressan12 ), which indicates an overshooting efficiency already at masses of for solar-metallicity stars; and by the SMC cluster NGC 419 (Girardi09 , Kam ), in which the turn-off probes masses between and 1.9 . Recent indications come also from asteroseismology but they are still ambiguous: while the observations of Cen A (Meu ) suggest negligible overshooting in solar-metallicity stars of mass , recent asteroseismic studies of the nearby old low-mass star HD 203608 (Deh ), with , support the existence of overshooting (with , which corresponds to in our formalism) at masses as low as , which is probably just slightly above the limit. Clearly, the behavior of overshooting in the transition region from to deserves more detailed investigations.

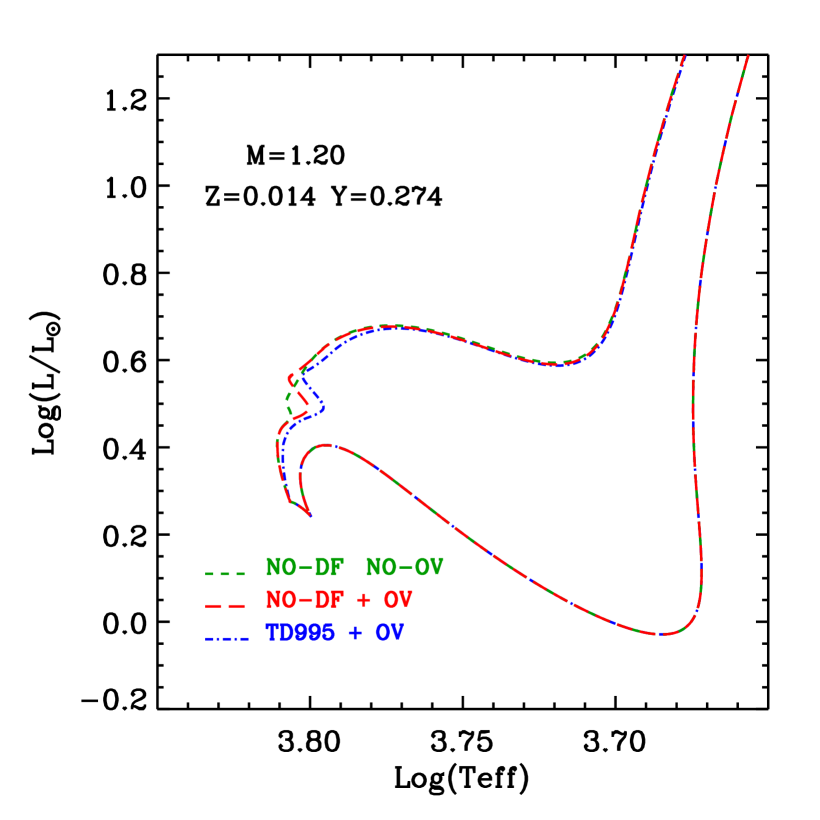
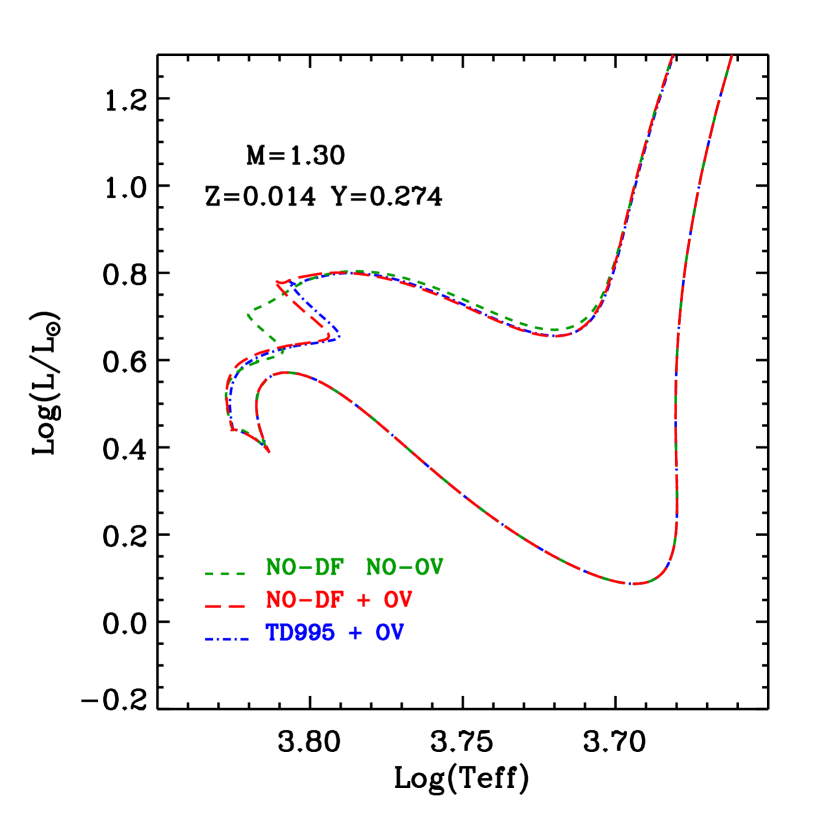
Effects of diffusion have also been thoroughly discussed in literature (see e.g. Vandb and references therein). A still open problem is how to deal with diffusion in stars with almost fully radiative envelopes. Indeed, on the basis of accurate abundance determinations in stars of globular cluster NGC 6397 by Grat , Chab concluded that microscopic diffusion should be fully inhibited in the external layers of metal poor stars at least down to a depth of about 0.005 from the photosphere, and partially inhibited in the region 0.005 to 0.01 from the photosphere. At larger metallicities, microscopic diffusion in the external layers of stars of similar mass is already inhibited by the more extended external convection. One could think that in more massive stars with less extended surface convective regions, the effects of diffusion are negligible because of the much shorter stellar evolutionary times. However if the mesh spacing in the external layers is kept suitably small for accuracy purposes, diffusion can noticeably change the surface composition even for masses well above those of globular clusters, when external convection disappears (Turc ). To cope with these difficulties some sort of extra-mixing beyond the base of the external convective layers has been invoked (e.g. Richer ). This extra-mixing, of unknown origin but whose effect is that of moderating/inhibiting other diffusive processes, is parameterized as a turbulent diffusion with a coefficient that is calibrated on the observed surface abundances of old stars (Vandb ). Unfortunately, when the calibrating observable is the surface Li abundance, the results of different investigations, based on different stars, do not agree (Mel , Nor ). Furthermore, this calibration is challenged even more by the discovery that early main sequence stars still suffer from a non negligible mass accretion (Dem11 ). This tail of accretion, preceded by a very efficient turbulent mixing during the pre-main sequence phase that completely destroys Li, could reshape our view of the surface evolution of this element (Mol ), and likely requires another different calibration of the inhibiting mechanism. For all these reasons and since we neglect radiative levitation (Vauc ), in the present models we have assumed that the outermost regions of the star, with Mr/M 0.995, are always homogenized. In the current version of PARSEC diffusion operates during the main sequence phase throughout the whole star even in presence of a well developed convective core and it is maintained until the effects on the evolution of the star become negligible ( ). This criterion supersedes the one described in Bressan12 according to which diffusion was not considered in stars that develop a persistent convective core, i.e. when core overshoot is taken into account. Figure 2 illustrates how the effects of overshoot and diffusion affect the evolutionary tracks in the radiative/convective core transition region.
5 The Red Giant Branch
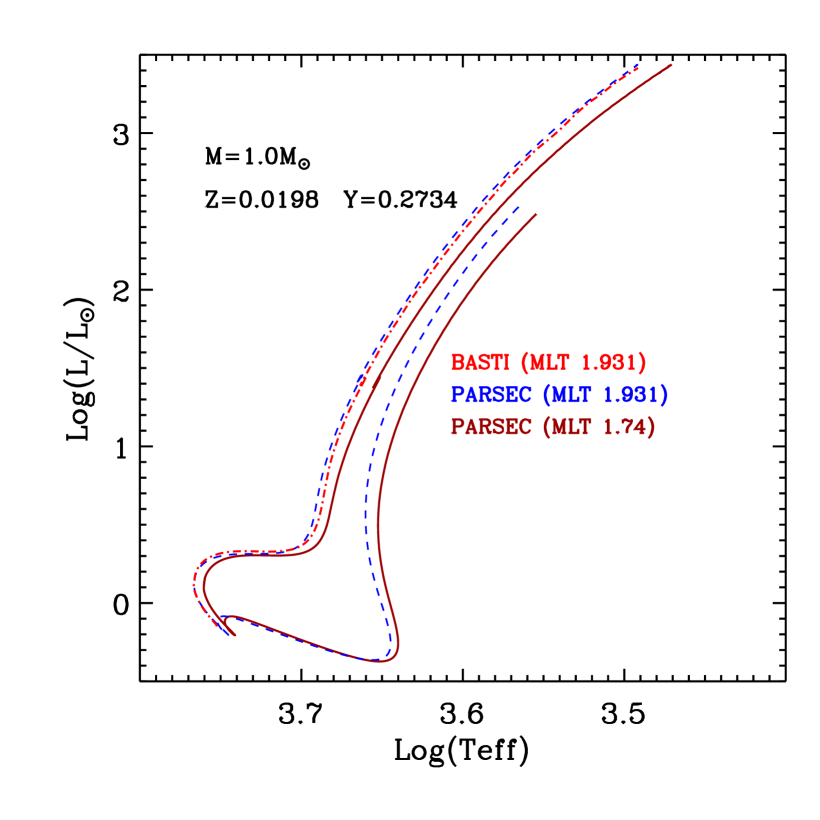
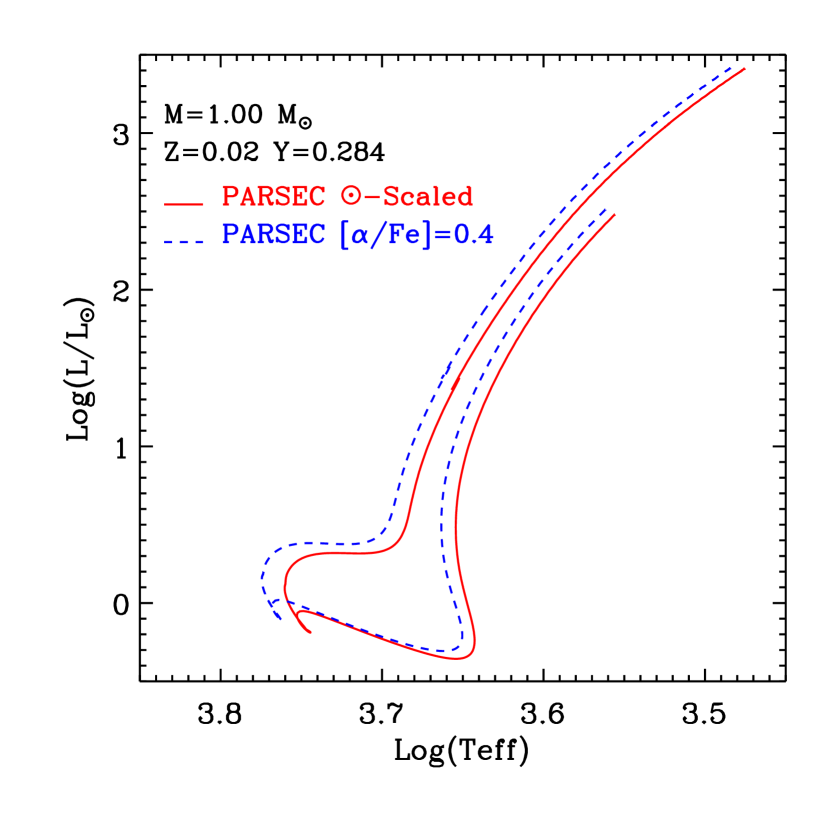
One of the main goals of stellar evolution is predicting the correct location (temperature and slope) of the Red Giant Branch (RGB), since it is used for the derivation of the age of resolved stellar populations, and provides also a photometric estimate of their metallicity. The RGB is also expected to importantly contribute to the integrated colours of old stellar populations. For a given chemical composition the temperature of the RGB is affected mainly by the treatment of inefficient convection (MLT or other models), the atmospheric boundary conditions, the low-temperature opacities and the EOS. These effects have been extensively discussed in the literature (e.g. Mont Vandb , CAS11 ). Here we call attention just to a couple of subtle but important effects. The first one is that the observed metal abundance of the Sun impacts directly on the location of the RGB because of the calibration of the MLT parameter. The left panel of Figure 3 shows that when adopting the same MLT parameter used by BaSTI, the PARSEC track of M=1M⊙ runs almost superimposed to the BasTI one for the same composition. However, the different calibration obtained with the CA11 solar metallicity results in a lower MLT parameter which significantly affects the location of the track in the HR diagram.
The other effect is related to the definition of ”-enhancement” i.e. to the way the chemical mixture is effectively built. In general, given an ratio, one has two options: a) either keeping the ratio [Fe/H] fixed while increasing the absolute abundances of the elements, which leads to a net increase of the total metallicity ; or b) keeping the metallicity fixed while depressing the abundances of the Fe-group elements and somewhat enhancing those of the elements. In the former case the most relevant consequence is the effective increase of O, Mg, Ne, etc., while in the latter case the most important effect is the depletion of the Fe-group elements.
The right panel of Figure 3 exemplifies the effect of adopting -enhanced mixtures on the evolutionary tracks in the H-R diagram, using the b) option. There is a systematic trend of the -enhanced tracks (blue line) to be somewhat warmer than the corresponding scaled-solar cases (red line), especially along the RGB. The changes in the abundances may produce important effects on evolutionary tracks, mainly due to opacity effects (Marigo09 ). As a general rule we may expect that -enhanced tracks computed according to the a) option tend to be cooler than the corresponding scaled-solar tracks (e.g. Vandb ) because of a net increase in the metallicity, while -enhanced tracks computed according to the b) option tend to be cooler than the corresponding scaled-solar tracks because the depression of the Fe-group elements implies a reduction of the H- opacity, important absorption source at temperatures K. In fact the H- opacity is highly sensitive to the number of free electrons, a significant fraction of which is just provided by Fe-group elements.
5.1 The RGB Bump
During the first red giant ascent low-mass stars experience a brief though noticeable readjustment of their internal structure, when the hydrogen burning shell reaches the chemical discontinuity left by the maximum depth of the convective envelope during by the first dredge up episode. This brief stall produce an observable excess of stars in the CM diagram, named the RGB bump, that can be easily compared with theoretical predictions. Indeed the observed location of the RGB bump in globular clusters is about 0.2 to 0.4 mag fainter than that predicted by models (Dicec10 ; see also CAS11 ), though at the higher metallicities this result depends on the adopted metallicity scale. Alongi were the first to consider the possibility that a more efficient mixing at the base of the convective envelope (envelope overshoot) could easily remedy the above discrepancy by deepening the location of the chemical discontinuity. Assuming an extra mixing of about below the bottom of the convective region, the RGB bump happens mag fainter, which almost fills the observed discrepancy It is worth noticing here that another effect of such an extra mixing is the wider extension of the blue loops of intermediate-mass stars (Alongi ). Against the plausibility of such mixing it has always been argued that the calibration of the solar model does not require a sizable overshoot region, because the transition between the fully adiabatic envelope and the radiative underlying region in our Sun is already well reproduced by models without overshoot. However, this does not exclude the possibility that just below the fully adiabatic region convection may penetrate in form of radiative fingers that are able to induce a significant mixing. Very recently it has been suggested that a mechanism of this kind could provide an even better agreement with the physical state of matter in this transition region derived from solar oscillations data (Chr11 ). The size of this region has been recently estimated to be , but consistent results may be obtained also with a larger value, , which is in very good agreement with the one adopted since Alongi . These simple considerations would favor larger values of in low-mass stars. The fact that the discrepancy disappears at higher metallicities is intriguing and deserves a more careful investigation. In this respect, the effects of the envelope overshoot and mass accretion on the abundance of light elements (e.g. 7Li) during and after the PMS evolution (Mol ) may provide an critical test against observations.
5.2 The Tip of the Red Giant Branch
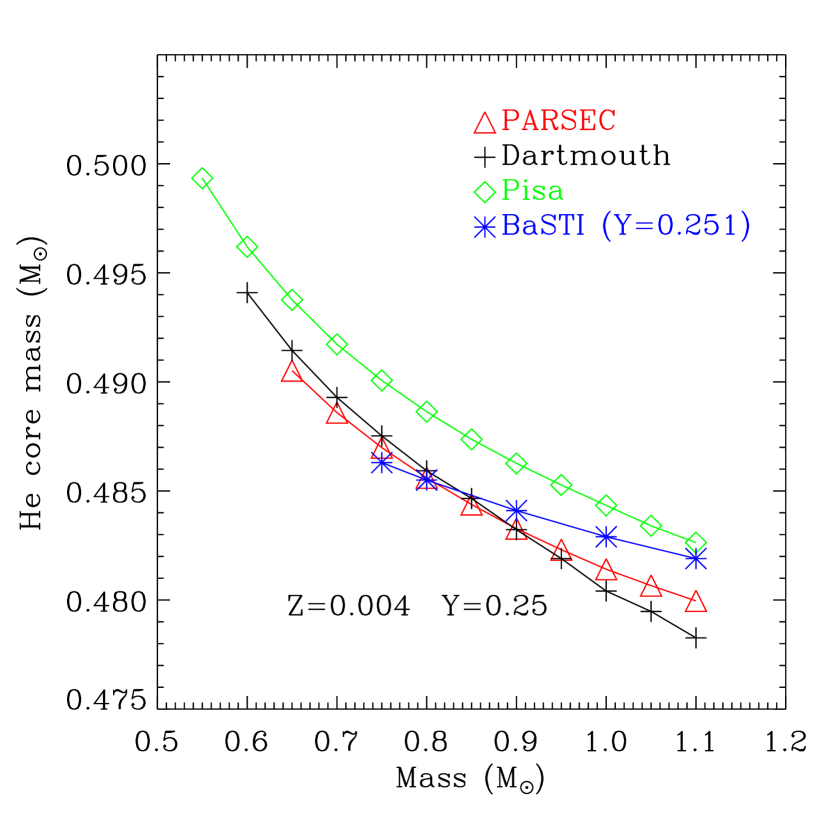
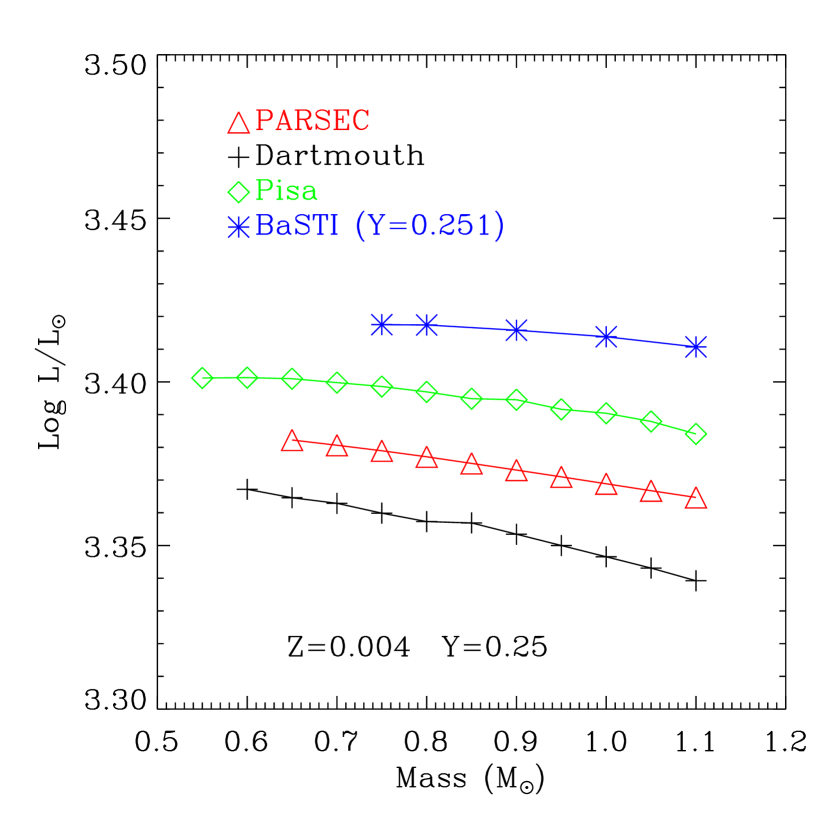
The RGB evolution of single low-mass stars ends with the helium flash inside electron-degenerate core, if the initial mass is M0.5M⊙. The helium core mass at the Tip of the RGB (TRGB) determines its luminosity and as well affects the luminosity of the subsequent helium burning phase. In nearby resolved galaxies the TRGB can be easily detected and it is one of the most important distance indicators.
For a given metallicity, the He-core mass and the TRGB luminosity predicted by different models depend on i) the adopted input physics, i.e. opacities, EOS, nuclear reactions, neutrino rates and efficiency of atomic diffusion, ii) the adopted solar chemical composition and calibration, iv) and computational details of the previous evolutionary phases. Figure 4 compares the He-core mass and the luminosity at the TRGB, as predicted by different models in the literature: PARSEC (Bressan12 ), Dartmouth (Dotter08 ), Pisa (dellom ) and BaSTI (Pietr ). As for the He-core mass, there is a fairly nice agreement between different groups. The agreement is slightly less good for the TRGB luminosities. At M0.8 M⊙, models from Dartmouth, PARSEC and BaSTI with the same He-core mass, present luminosities that increase from the former to the latter. The difference between Dartmouth and PARSEC amounts to 0.05 mag while the difference between Dartmouth and BaSTI is of about 0.15 mag. A thorough discussion of possible effects produced by e.g. conductive opacities and nuclear reaction rates (in particular the reaction) can be found in CAS11 .
6 He-burning stars
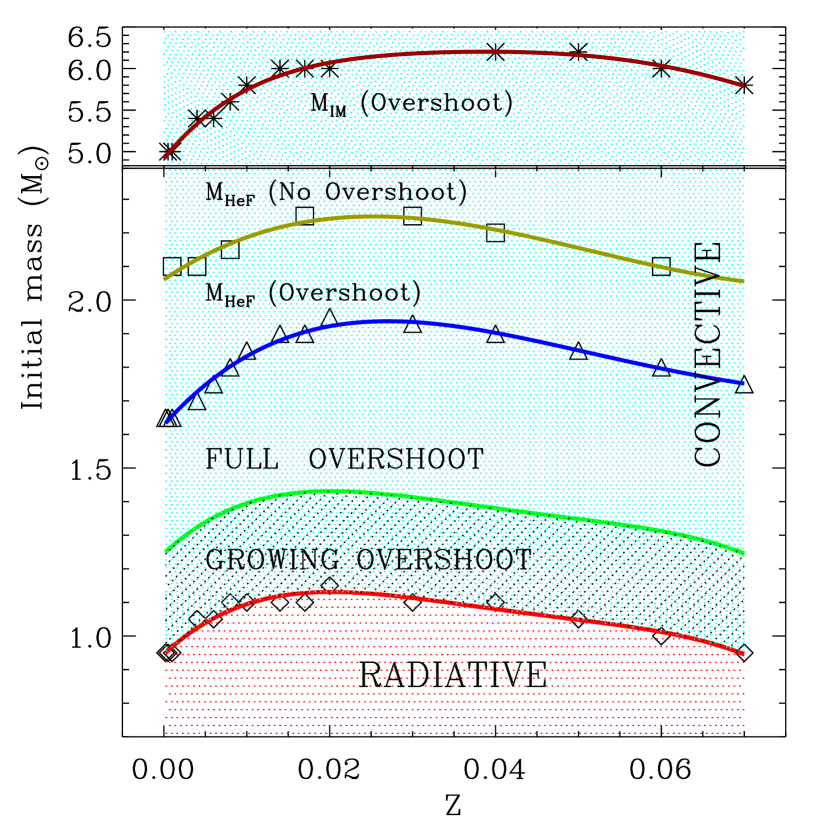
The threshold initial mass below which stars eventually undergo the helium flash, MHeF, depends critically on the chemical composition and on the assumed efficiency of core mixing processes during the H-burning phase (mainly convective overshoot and rotation). The behavior of as a function of metallicity is shown in Figure 5. Without overshoot, is about 0.3 M⊙ larger than for models computed with a mild overshoot efficiency. In Figure 5 we plot also the behavior of and for scaled-solar models that follow the enrichment law. These critical masses may change moderately by varying the He content at a given metallicity.
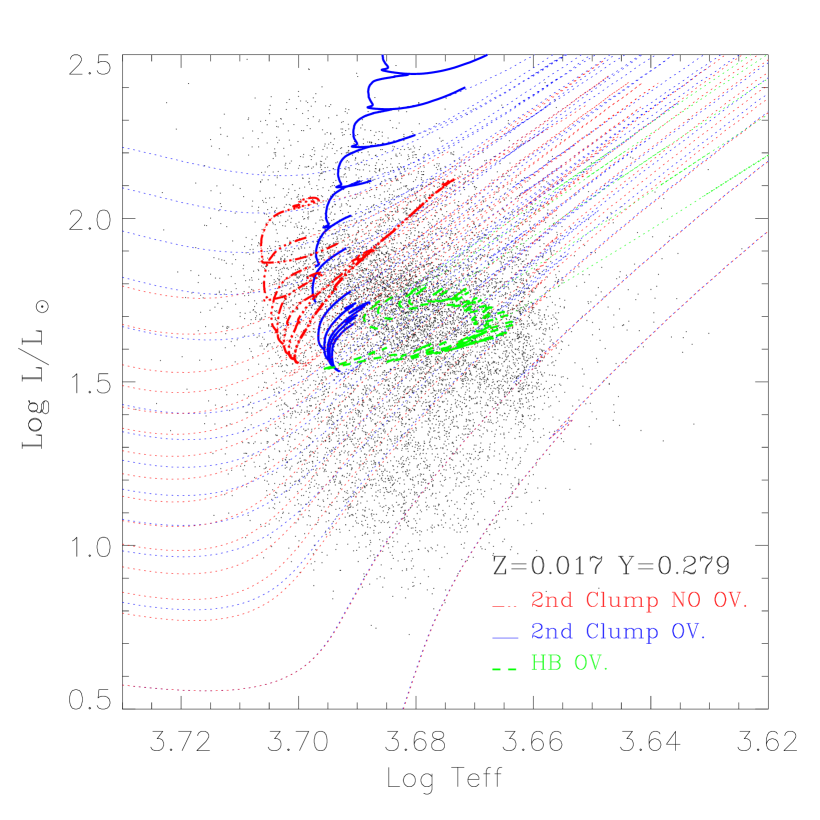
The position of central helium burning stars in the HR diagram is mainly determined by the size of the He-core and H-rich envelope and of course by the chemical composition. Stars undergoing the helium flash have similar He-core masses and, when the envelope is sufficiently small, they occupy the Horizontal Branch (HB) while, as the envelope mass become sizable, they distribute on a Red Clump (RC) at cooler temperatures. For the (initial) solar metallicity the HB and RC loci are shown by the thick green tracks in the left panel of Figure 6. At lower metallicity the locus extends at much hotter temperatures for lower initial masses, while it is similar for the higher masses. If the initial mass is larger than the stars ignite helium quiescently. Moreover for M they posses a smaller He-core. This is why they constitute a separate clump with luminosity even lower than that of the stars slightly less massive, as shown by the thick blue tracks in the left panel of Figure 6. This clump is commonly named the secondary Red Clump (2ndRC; Gir99 ). Green and blue tracks in the left panel of Figure 6 are computed taking into account core overshoot. Tracks without core overshoot are shown in red and only for initial masses larger than MHeF in order to highlight the location of the 2ndRC for models without overshoot. The points in Figure 6 are the Red-Giant stars of the public Kepler data set (Hek ). The models shown in Figure 6 do not account for mass loss during the RGB, which is another source of uncertainty. Indeed recent asteroseismic determination of the masses of stars on the RGB and in the RC of the old metal-rich cluster NGC 6791, indicate that mass loss could be less efficient than thought before (Miglio , reim ).
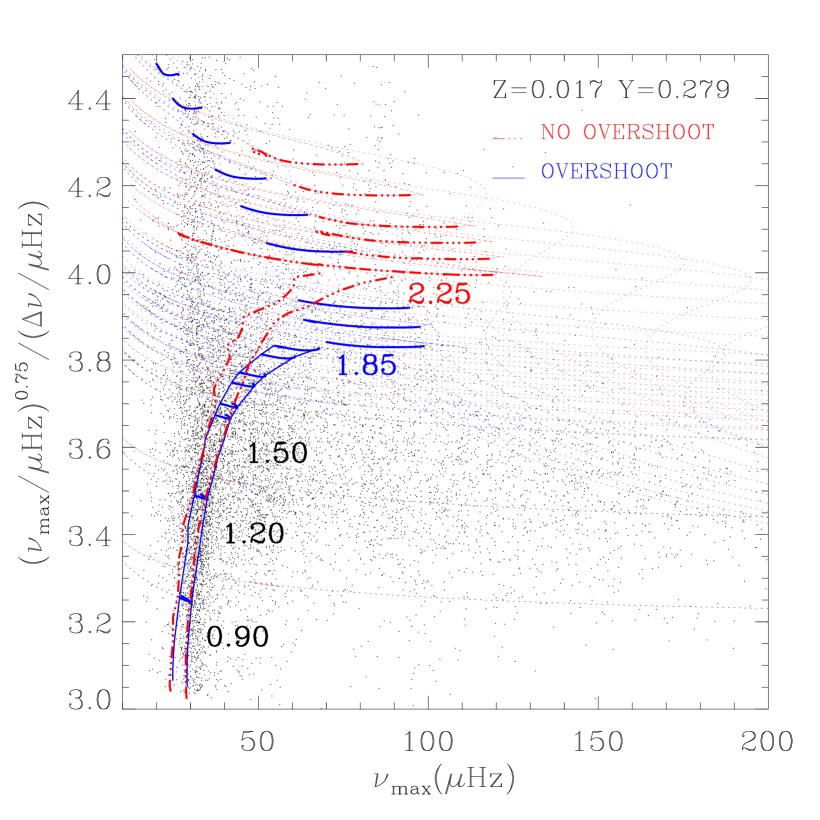
The right panel of Figure 6 shows the models in the frequency domain after adopting suitable scaling relations and a functional form that almost eliminates the dependence on the stellar luminosity (Hub ). In the right panel, green and red dots mark the location of the helium burning stars after the helium flash for model with (1.85 M⊙) and without (2.25 M⊙) core overshoot, respectively. The corresponding 2ndRC tracks of stars with M are also shown in blue and red, respectively.
7 Conclusions
We discussed a number of uncertainties that still affect stellar evolution models. Our solar model obtained with the CA11 revised solar metallicity compares fairly well with that computed with GS98 abundances. We have stressed that a correct estimate of the solar metallicity has an impact also on the advanced evolutionary phases. While some discrepancies existing in the past have been removed (e.g. at the RGB Tip), the problem remains of understanding the efficiency of interior mixing during the main sequence, as well in the later evolutionary phases. The latter has a significant impact on the turn-off region and on the clump of He-burning stars. In the latter phase a mild overshoot produces 2ndRCs with masses 0.3 M⊙ lower than without overshoot. Since depends also on the chemical composition, Asteroseismic measuremets of RC masses in star clusters of known abundances will be of paramount importance in resolving this issue.
Aknowledments We warmly thanks the organizers for the kind hospitality.
References
- (1) Bressan A. et al. arXiv, (2012), arXiv:1208.4498
- (2) Iglesias, C. A., Rogers, F. J., ApJ, 464 (1996) 943
- (3) Marigo, P., Aringer, B., A&A, 508 (2009) 1539-1569
- (4) Itoh, N. et al. ApJ, 677 (2008) 495-502
- (5) Cyburt, R. H. et al. ApJs, 189 (2010) 240-252
- (6) Dewitt, H. E., Graboske, H. C., Cooper, M. S., ApJ, 181 (1973) 439-456
- (7) Graboske, H. C., Dewitt, H. E., Grossman, A. S., Cooper, M. S., ApJ, 181 (1973) 457-474
- (8) Marigo, P., Girardi, L., Chiosi, C., Wood, P. R. , A&A, 371 (2001) 152-173
- (9) Munakata, H., Kohyama, Y., Itoh, N., ApJ, 296 (1985) 197-203
- (10) Itoh, N., Kohyama, Y., ApJ, 275 (1983) 858-866
- (11) Haft, M., Raffelt, G., Weiss, A., ApJ, 425 (1994) 222-230
- (12) Böhm-Vitense, E., ZA, 46 (1958) 108
- (13) Salasnich, B., PhD Thesis Univ. of Padova (1999)
- (14) Thoul, A. A., Bahcall, J. N., Loeb, A., ApJ, 421 (1994) 828-842
- (15) Grevesse, N., Sauval, A. J., Space. Sci. Rev., 85 (1998) 161-174
- (16) Caffau, E. et al. Sol. Phys., 268 (2011) 255-269
- (17) Lodders K., Palme H., Gail H.-P., Landolt-Börnstein - Group VI Astronomy and Astrophysics Numerical Data and Functional Relationships in Science and Technology Volume 4B: Solar System (Edited by J.E. Trümper, 2009) 44
- (18) Asplund, M., Grevesse, N., Sauval, A. J., Scott, P. , ARA&A, 47 (2009) 481-522
- (19) Guenther, D. B., Demarque, P., Kim, Y.-C., Pinsonneault, M. H. , ApJ, 387 (1992) 372-393
- (20) Basu, S., Antia, H. M., ApJL, 606 (2004) L85-L88
- (21) Basu, S., Antia, H. M., MNRAS, 287 (1997) 189-198
- (22) Basu, S. et al. ApJ, 699 (2009) 1403-1417
- (23) Basu, S., Pinsonneault, M. H., Bahcall, J. N., ApJ, 529 (2000) 1084-1100
- (24) Serenelli, A. M., Basu, S., Ferguson, J. W., Asplund, M., ApJL, 705 (2009) L123-L127
- (25) Komatsu, E. et al. ApJs, 192 (2011) 18,
- (26) Bertelli, G. et al. A&As, 106 (1994) 275-302
- (27) Girardi, L., Bressan, A., Bertelli, G., Chiosi, C. , A&As, 141 (2000) 371-383
- (28) Aparicio, A., Bertelli, G., Chiosi, C., Garcia-Pelayo, J. M. , A&A, 240 (1990) 262-288
- (29) Girardi, L., Rubele, S., Kerber, L., MNRAS, 394 (2009) L74-L78
- (30) Kamath, D., Wood, P. R., Soszyński, I., Lebzelter, T. , MNRAS, 408 (2010) 522-534
- (31) de Meulenaer, P. et al. A&A, 523 (2010) A54
- (32) Deheuvels, S. et al. A&A, 514 (2010) A31
- (33) VandenBerg, D. A. et al. , ApJ, 755 (2012) 15-32
- (34) Gratton, R. G. et al. A&A, 369 (2001) 87-98
- (35) Chaboyer, B. et al. ApJ, 562 (2001) 521-527
- (36) Turcotte, S. et al. ApJ, 504 (1998) 539
- (37) Richer, J., Michaud, G., Turcotte, S., ApJ, 529 (2000) 338-356
- (38) Meléndez, J. et al. A&A, 515 (2010) L3
- (39) Nordlander, T., Korn, A. J., Richard, O., Lind, K. , ApJ, 753 (2012) 48
- (40) De Marchi, G. et al. ApJ, 740 (2011) 11
- (41) Molaro, P. et al. ArXiv e-prints, (2012)
- (42) Vauclair, S., Astrophysical Processes in Upper Main Sequence Stars (Saas-Fee Advanced Course 13, 1983) 167
- (43) Montalbán, J. and Kupka, F. and D’Antona, F. and Schmidt, W. A&A, 370 (2001) 982-990
- (44) VandenBerg D. A., Edvardsson B., Eriksson K., Gustafsson B., ApJ, 675 (2008) 746-763
- (45) Cassisi, S. et al. A&A, 527 (2011) A59
- (46) Di Cecco, A. et al. ApJ, 712 (2010) 527-535
- (47) Alongi, M., Bertelli, G., Bressan, A., Chiosi, C. , A&A, 244 (1991) 95-106
- (48) Christensen-Dalsgaard, J. et al. MNRAS, 414 (2011) 1158-1174
- (49) Dotter, A. et al. ApJs, 178 (2008) 89-101
- (50) Dell’Omodarme, M., Valle, G., Degl’Innocenti, S., Prada Moroni, P. G., A&A, 540 (2012) A26
- (51) Pietrinferni, A., Cassisi, S., Salaris, M., Castelli, F. , ApJ, 612 (2004) 168-190
- (52) Girardi L., Bertelli G., MNRAS, 308 (1999) 818-832
- (53) Hekker, S. et al., MNRAS, 414 (2011) 2954-2961
- (54) Miglio, A. et al. MNRAS, 419 (2012) 2077-2088
- (55) Reimers, D., Memoires of the Societe Royale des Sciences de Liege, 8 (1975) 369-382,
- (56) Huber, D. et al. , ApJ, 743 (2011) 143-152