A New Sub-Period-Minimum CV with Partial Hydrogen Depletion and Evidence of Spiral Disk Structure
Abstract
We present time-resolved spectroscopy and photometry of CSS 120422:111127+571239 (= SBS 1108+574), a recently discovered SU UMa-type dwarf nova whose 55-minute orbital period is well below the CV period minimum of 78 minutes. In contrast with most other known CVs, its spectrum features He I emission of comparable strength to the Balmer lines, implying a hydrogen abundance less than 0.1 of long period CVs—but still at least 10 times higher than than in AM CVn stars. Together, the short orbital period and remarkable helium-to-hydrogen ratio suggest that mass transfer in CSS 120422 began near the end of the donor star’s main-sequence lifetime, meaning that the system is probably an AM CVn progenitor as described by Podsiadlowski, Han, & Rappaport (2003). Moreover, a Doppler tomogram of the H line reveals two distinct regions of enhanced emission. While one is the result of the stream-disk impact, the other is probably attributable to spiral disk structure generated when material in the outer disk achieves a 2:1 orbital resonance with respect to the donor.
1 Introduction
1.1 Cataclysmic Variables and the Period Minimum
Cataclysmic variables (CVs) are close binary systems in which a white dwarf accretes matter from a companion star which overflows its Roche lobe. Very few CVs have orbital periods below the so-called “period minimum,” which has been observed to be 78 minutes (Hellier, 2001). As Kolb & Baraffe (1999) explain, the period minimum is a consequence of emerging electron degeneracy in the donor star and the strong, inverse relationship between donor-star density and a CV’s orbital period. When a non-degenerate donor sheds some of its mass, its density increases, prompting the CV’s orbital period to shrink. A degenerate donor, however, has exactly the opposite response to mass loss, so once the secondary star becomes degenerate, it will have reached its maximum density—and thus the shortest orbital period possible for the system. Thereafter, the CV will evolve toward a longer orbital period, its period having “bounced” off the minimum.
Nevertheless, a handful of CVs, some with orbital periods as short as several minutes, defy the 78-minute period minimum. Almost every CV in this category is an AM CVn-type system, featuring a rich helium spectrum lacking even the slightest hint of hydrogen. Helium-enhanced stars are denser than their hydrogen-dominated counterparts, so they adhere to a shorter period minimum (Augusteijn et al., 1996).
There are three theoretical avenues of formation for these unusual stars (Nelemans et al., 2010). First, the distance between two detached white dwarfs might decrease as a result of gravitational radiation, causing the lower-mass companion to eventually overflow its Roche lobe. Second, a low-mass, helium-fusing star in an interacting binary might lose so much mass that its core would be unable to sustain the necessary temperature and pressure for continued helium fusion, producing a semi-degenerate core. Third, if mass transfer were to commence near the end of the main-sequence lifetime of the donor star, the secondary star would shed its hydrogen envelope, exposing the relatively dense, hydrogen-deficient interior of the star. Spectroscopically, the helium-to-hydrogen ratio would gradually increase as the system continued to evolve. Unlike the first two models, the evolved-main-sequence-donor model predicts the presence of some hydrogen in the donor star (Podsiadlowski, Han, & Rappaport, 2003; Breedt et al., 2012).
Oddly, a few CVs are below the period minimum, but with strong hydrogen lines in their spectra, they cannot be AM CVn stars. Instead, these stars belong to the SU UMa sequence of CVs; consequently, while in outburst, they display superhumps—periodic photometric oscillations attributed to a precessing, eccentric accretion disk—whose period is within several percent of the orbital period. However, the secondary stars in the sub-period-minimum SU UMa systems are not the garden-variety donor stars found in most CVs above the minimum. In two of these CVs, EI Psc (Thorstensen et al., 2002) and V485 Cen (Augusteijn et al., 1996), the He I 667.8-nm-to-H ratio is elevated with respect to CVs above the period minimum, and the secondary star is plainly visible in optical and near-infrared spectra. A third system below the minimum, SDSS J150722.30+523039.8, has very weak helium lines and shows no trace of the donor, leading Littlefair et al. (2007) to conclude that the secondary is a brown dwarf.
Another sub-period-minimum star, CSS 100603:112253-111037 (hereinafter, CSS 100603), is a hybrid of these three systems. Like EI Psc and V485 Cen, its spectrum has strong emission from both hydrogen and neutral helium. Like the brown-dwarf system, though, the donor star is invisible in spectra, and the estimated mass ratio is quite low. Breedt et al. (2012) argue that CSS 100603 is probably an AM CVn progenitor in which the donor star is an evolved main-sequence star.
Here, we present observations of CSS 120422, a very short period system similar to CSS 100603, but with several interesting differences.
1.2 CSS 120422:111127+571239
On 2012 April 22, the Catalina Sky Survey (Drake et al., 2009) detected an outburst of CSS 120422:111127+571239 (hereinafter, CSS 120422), a previously undiscovered CV. With a peak observed brightness of V 15.4, the system brightened by at least 4 magnitudes from its typical brightness in the Catalina data.111Because CSS 120422 was discovered at an indeterminate point after the start of its outburst, the actual peak magnitude is unknown. Even prior to the discovery of its very short orbital period, the system garnered attention because it is remarkably blue during quiescence, even for a CV (Kato, 2012). The VSNET collaboration (Kato et al., 2004) immediately launched an extensive observing campaign, finding an initial superhump period of 56 minutes, well below the 78-minute period minimum for hydrogen-rich CVs (Kato et al., 2012). Although most known CVs below the minimum are AM CVn systems, spectroscopy revealed a hydrogen-dominated spectrum, eliminating the AM CVn hypothesis (Garnavich et al., 2012). After the system returned to quiescence, Pavlenko et al. (in preparation; preliminary findings discussed in Kato et al., 2012) reported unusually strong helium lines in CSS 120422’s quiescent spectrum.
2 Observations
2.1 VATT Photometry
We observed CSS 120422 with the Vatican Advanced Technology Telescope (VATT) and VATT4K CCD imager on 2012 June 15, 16 and 18 (UT), performing time-resolved photometry through a Bessell filter on the first two nights a Bessell filter on the final night. Clouds prevented observations on June 17. The CCD pixels were binned 22, and only the central 500 rows were read out in order to reduce the overhead on each exposure. Generally exposures were 60 sec long with a readout time of 11 sec, but seeing degraded during the second half of the final night, so the exposure time was increased to 100 sec. The CCD images were bias-subtracted and flat-field-corrected using dithered exposures taken during twilight.

We used a star 2 arcmin south of CSS 120422 as a comparison star (USNO-B1.0 position RA=11:11:26.83 DEC=+57:12:38.9 J2000). The SDSS photometric catalog magnitudes for the comparison star convert to and mag. Located 1 arcmin west of the comparison star, the check star has SDSS converted magnitudes of and . Aperture photometry using DAOPHOT in IRAF produced the light curves shown in Fig. 1.
2.2 FLWO Spectroscopy
We obtained spectra of CSS 120422 with the 1.5m Tillinghast telescope at the Fred L. Whipple Observatory on 2012 May 12 and 13 (UT), roughly three weeks after the initial detection of the outburst. The FAST spectrograph utilized a 300 line mm-1 grating and covered the spectral range between 360 nm and 750 nm. On May 12, a single 30 minute exposure with a 3-arcsec-wide slit was obtained. During the following night, a series of nine images, each with an exposure time of 420 sec, were taken through a 2-arcsec-wide slit. Seeing was approximately 1.5 arcsec, and the slit was set to a position angle of 90∘ on both nights. Table 1 gives a log of the spectral observations.
The CCD images were bias-subtracted and flat-field-corrected using normalized internal lamps. Extracted using the “twod” package in IRAF,222IRAF is distributed by the National Optical Astronomy Observatory, which is operated by the Association of Universities for Research in Astronomy (AURA) under cooperative agreement with the National Science Foundation. the spectra were wavelength-calibrated using images of an internal HeNeAr lamp interspersed with the stellar spectra. The CSS 120422 spectra, having all been obtained at an airmass less than 1.15, were flux-calibrated using a spectrum of Feige 34 taken at an airmass of 1.03.
The combined spectrum, displayed in Figure 2, reveals a blue continuum with a conspicuous Balmer jump. Weak emission lines of H and He I at both 587.5 nm and 667.8 nm are visible in addition to broad Balmer absorption features with emission cores, a spectrum typical of a hydrogen-accreting dwarf nova declining from outburst (Garnavich et al., 2012). Because the system was returning to quiescence, its absorption-dominated outburst spectrum was in the process of transitioning back into an emission-line spectrum during our observations. Consequently, the simultaneous presence of emission and absorption undoubtedly diluted the strengths of many lines.

2.3 LBT Spectroscopy
We obtained spectra of CSS 120422 with the Large Binocular Telescope (LBT) and Multi-Object Dual Spectrograph (MODS; Pogge et al., 2010) on 2012 June 16 (UT). The sixteen 400-second exposures employed a 1.0 arcsec slit oriented to the parallactic angle in order to minimize slit losses. The spectra cover a time period of about 1 hour and 15 minutes, or about 1.3 orbits of the binary. Table 1 presents a log of the LBT spectral observations.
The red and blue MODS CCD spectra were bias-subtracted and flat-field-corrected using normalized internal lamp illumination images. As with the FLWO data, the spectra were extracted using the “twod” package in IRAF. We used an internal Neon lamp on the red side and an Argon lamp for the blue channel for wavelength calibration, and the star HZ 44 served as the spectrophotometric standard for the flux calibration.
The brightness of CSS 120422 in the LBT data is approximately 2.8 mag fainter than the FLWO spectra obtained in May.
The combined LBT spectrum appears in Figure 3. Similar to the May spectra, a strong blue continuum is obvious, but by June, a wide variety of emission lines had appeared. Double-peaked Balmer and He I emission lines which originate in the accretion disk are evident, as are weaker lines of intermediate-mass elements, especially Si II and Ca II. The H profile is well fit by two Gaussians separated by 1200 km s-1, each with a full width at half maximum (FWHM) of 940 km s-1. The center of mass of the line is shifted to the red by 50 km s-1.

The near-equal strength of the He I and Balmer lines is particularly striking. In normal, hydrogen-rich CVs, the He I emission is much weaker than the hydrogen lines, and in AM CVn systems, He I dwarfs the negligible hydrogen emission. However, in CSS 120422, the average total flux of the He I 587.5 nm line is 20% higher than that of H. To put this in perspective, the H line is typically three times as strong as the He I 587.5-nm feature in CVs.
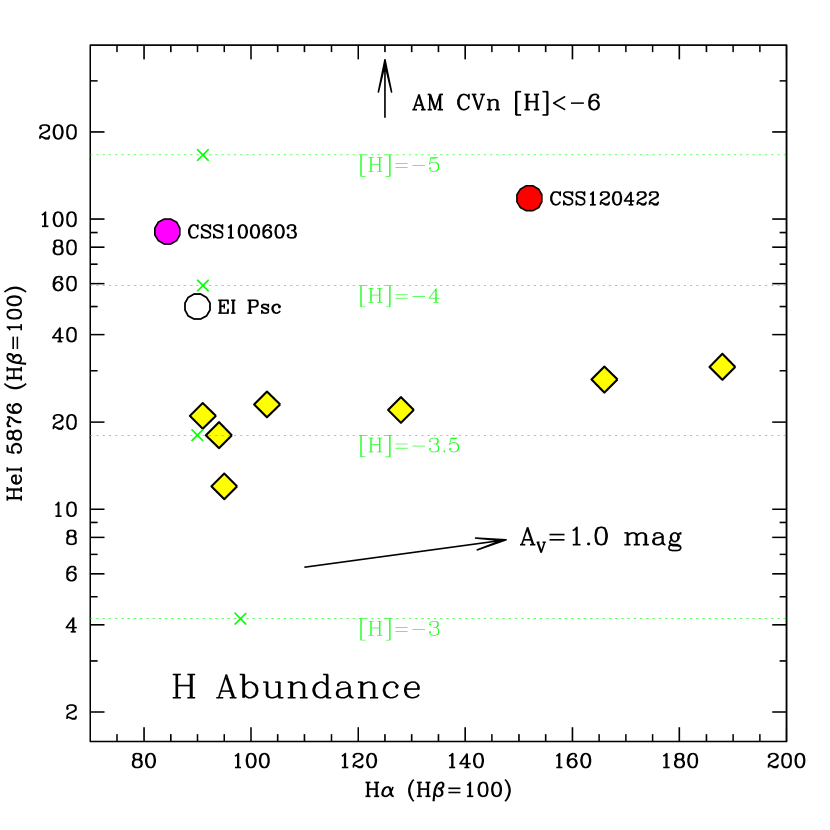
As alluded to earlier, other systems, such as CSS 100603 and EI Psc, exhibit He I-to-H ratios comparable to that of CSS 120422. Williams & Ferguson (1982) modeled the line strengths in several long-period CVs and found that they were somewhat depleted in hydrogen compared to the Sun. Specifically, the He I 5876-to-H flux ratio observed in long-period CVs was about 0.2, implying a hydrogen abundance [H]=log10(H/He)/Solar(H/He)= according to Williams & Ferguson (1982). Nagel, Rauch, & Werner (2009) concluded that significant H emission lines are present at [H]= and that AM CVn stars must have [H] for hydrogen emission to be undetectable (see Fig. 6). With some interpolation, these studies indicate that in CSS 120422, which features a He I 587.6-nm line of similar strength to the H line, the hydrogen abundance is [H]. We also measured this line ratio for CSS 100603 from the public SDSS spectrum and find a hydrogen abundance that is similar to CSS 120422. The He I 587.6-nm line was not measured by Thorstensen et al., but the He I 667.8-nm line strength suggests that EI Psc has a hydrogen abundance which is a factor of three higher in comparison with these recently discovered objects.
In CSS 120422, Ca II emission from the infrared triplet and HK lines is also quite prominent. Additionally, we identify Si II 634.7/637.1 nm lines, both of which have been observed in the AM CVn star CP Eri (Groot et al., 2001). The feature at 923 nm may be due to Mg II, but the line expected at 788.5 is not detected (Marsh et al., 1991). Alternatively, it might be a Paschen line. There is also a weak He II 468.6 nm feature blended with the He I 471.3 nm line, and on the red side of the He I 587.5 nm line, there is weak emission which may be due to low-velocity Na I.
CSS 120422’s spectrum contains more than just this forest of emission lines. In particular, the H and H lines both sit within broad absorption troughs in the continuum. (To a lesser extent, this is also true of the H line, too.) In other short-period CVs, the WD is responsible for producing comparable features at these wavelengths (Rodríguez-Gil et al., 2005), so we attribute the absorption in CSS 120422 to pressure-broadened absorption from the WD’s photosphere. These absorption lines suggest that the WD must contribute much of the system’s overall optical flux (e.g. Patterson, Thorstensen, & Knigge, 2008), likely indicating a low mass-transfer rate during quiescence. If this inference is correct, it would account for the unusually blue quiescent color noted by Kato (2012). A quiescent accretion disk will usually be cooler than the WD, causing the overall flux of the system to be redder, but in a system with a low rate of mass transfer, the disk will be relatively tenuous and dim, enabling the WD’s blue continuum to overwhelm the disk’s meager contribution.
3 Analysis
3.1 VATT Photometry
3.1.1 Orbital Period, Ephemeris, & Light Curve Morphology
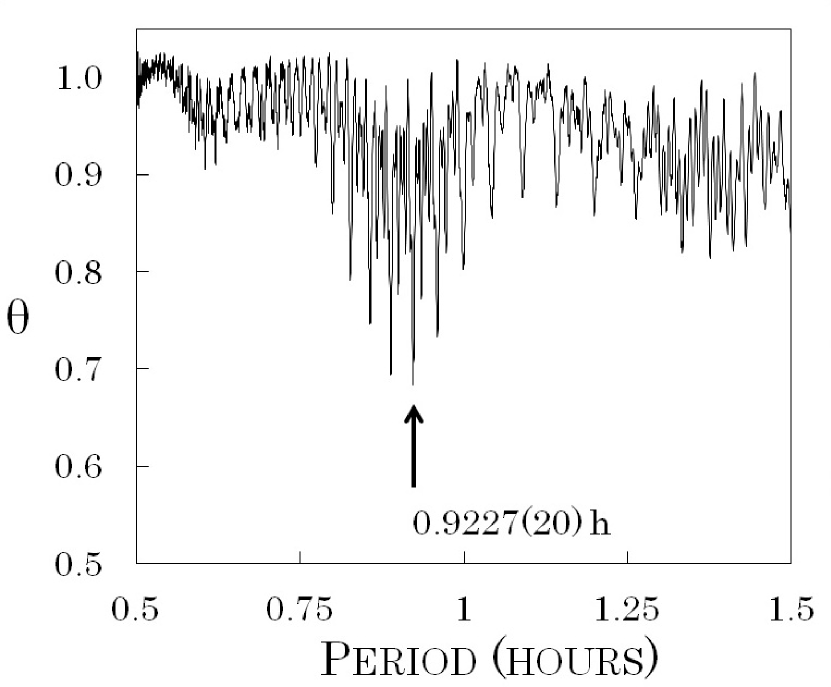
We removed a linear trend from each night of VATT photometry and created a power spectrum from all three nights using the phase-dispersion-minimization (PDM) algorithm (Stellingwerf, 1978). PDM scans a user-selected period range, calculates a phase plot for each trial period, divides the phase plot into a user-specified number of bins, and quantifies the total amount of scatter in each bin. The best candidate periods will have the least amount of scatter in their phase plots, a technique which is well-suited to analyzing non-sinusoidal signals, such as the waveform of CSS 120422’s orbital period. In the PDM power spectrum (see Fig. 5), the strongest signal is at 55.36 minutes, but there is also a competing alias at 53.28 minutes. Using a completely independent dataset, Kato et al. (2012) report the longer of these two periods as the orbital period and find no evidence of the shorter period (T. Kato, private communication).
We show the phase plot of all three nights of data (both and bands) in Figure 5 using the ephemeris of
where phase zero corresponds with the peak in the light curve.
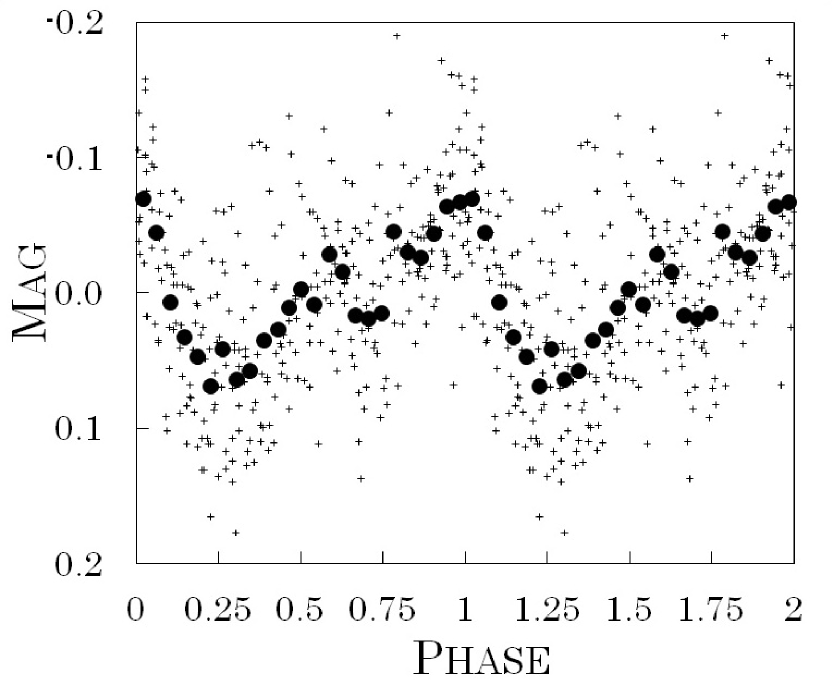
The phased light curve is very saw-toothed, with a gradual rise, a sharp peak, and then a rapid drop in brightness. When the data are binned to improve the signal-to-noise ratio, the waveform displays a weakly double-humped structure, with two distinct maxima per orbital cycle. In this regard, the light curve resembles that of WZ Sge-type CVs. The maximum at phase zero and the broad minimum centered on phase 0.25 are both readily apparent, but the maximum seen near phase 0.55 and the ensuing minimum around phase 0.7 are much more subtle. The phase plot generated by Kato et al. (in preparation) is generally similar, but the double-peaked structure is somewhat difficult to discern.
The morphologies of the individual light curves are remarkably variable from night-to-night and even from cycle-to-cycle. For example, the light curve from 2012 June 15 should have contained three minima similar to the one centered on photometric phase 0.2 in the phase plot in Figure 5, but the second one is nearly non-existent. Likewise, on the following night, an expected peak in the light curve did not occur and was followed instead by a comparatively gentle decrease in flux. In the very next cycle, however, the peak returned, and the post-peak dip had a different shape. Clearly, the source of the orbital modulation, which we believe to be tidally-induced spiral structure in the outer disk (see Section 4.2.1), is capable of significant variability on timescales of less than one hour.
3.1.2 Inferred Mass Ratio
Patterson (1998) reported an empirical relation between a CV’s mass ratio ( = /) and its fractional superhump period excess (). Although the exact physical processes underlying this - correlation are unclear, it provides approximate estimates of using just the orbital and superhump periods, making it a particularly useful technique for analyzing a system whose mass ratio cannot be ascertained by other means. Relying upon a detailed survey of superhumps, Kato et al. (2009) updated Patterson’s original formula slightly, obtaining where is determined using the shortest Psh rather than the mean Psh. Applying the quadratic formula and rejecting the negative root (to ensure a positive value of ) yields a more convenient, explicit function: Using this formula, a Psh of 55.971 minutes (Kato et al., 2012), and our Porb of 55.36 minutes, we obtain . However, since the - relation in other systems is only approximate, the uncertainty for is probably greatly underestimated.
The correlation between and underscores that the 53-minute signal in our photometry is an alias of the true period at 55 minutes. If the signal at 53 minutes were the actual orbital period, then , a value which would be difficult to reconcile with the complete non-detection of the donor and the low mass ratios of other short-period CVs. Additionally, it would be inconsistent with the evidence of spiral shocks produced by disk material at the 2:1 resonance which, as Section 4.2.1 explains, could form only if .
Kato et al. (2012) point out that a mass ratio of 0.06 is not nearly as extreme as the mass ratios of other short-period dwarf novae, suggesting an unusually dense and massive secondary star which has shed much of its hydrogen envelope via mass transfer. In Section 4.1, we reach a similar conclusion based on our interpretation of the system’s spectrum.
3.2 Spectroscopy
The double-peaked Balmer and He I emission lines in the LBT spectra exhibit a radial-velocity variation over the photometric period (Figure 7). In contrast to many AM CVn stars and CSS 100603, these lines do not show stationary, central peaks in our trailed spectra, but there is an ‘S-wave’ present between the peaks of each of these lines. The single-peaked He II emission shows a particularly prominent S-wave for approximately half of the orbit, a feature which we attribute to the bright spot created by the stream-disk collision. The non-appearance of the He II line for over half of the orbit implies that the inclination of the system is sufficiently high that the bright spot rotates behind the disk as seen from Earth.
3.2.1 Equivalent Width Variation
We estimated the equivalent width (EW) of several of the brightest lines using the “splot” routine in IRAF. Each line was measured several times with slightly different continuum values and the resulting differences used to estimate an error. Only H showed significant variation above the noise, and the result is shown in Figure 6 along with the phase plot. The H EW varies by 20%, with the lowest EW occurring at photometric phase 0.8, when the orbital modulation nears its peak flux.
3.2.2 Radial Velocities
To avoid influencing the measurement of radial velocity variations with changes in the line shapes, we estimated the line velocities using the method described by Shafter (1983). The Shafter method multiples the red and blue wings of an emission line by a pair of Gaussian functions separated by a certain number of Ångstroms. The wavelength of the Gaussians are shifted until the difference in flux measured by the two functions is zero. This wavelength is assumed to be the central wavelength of the emission line. This is repeated for all the spectra, at which point it is possible to construct a radial velocity curve. The best separation between the Gaussian functions is determined by fitting each set of radial velocity curves with a sinusoidal function and choosing the one that gives the lowest parameter.

This method was applied to the H line and the fit parameters as a function of Gaussian separation are shown in Figure 8. The minimum occurred at a full Gaussian separation of 61 Å, and the parameter rises sharply when the separation is increased. The minimum was 12 for sixteen spectra and four fit parameters (amplitude, ; systemic velocity, ; orbital period, ; phase, ). We find that km s-1, km s-1, and min, a value within 1.4 of the 55.36-minute photometric period.
At first, our estimate of km s-1 might seem to contradict the small mass ratio that we have inferred, as it is impossible to obtain so large a value for the WD’s radial-velocity amplitude using . Nevertheless, in a CV can often be significantly different than the true orbital motion of the WD (e.g. U Geminorum: Long & Gilliland, 1999). Since an accretion disk’s emission is often asymmetric, techniques which rely upon a measurement of the wings of a spectral line will frequently produce inaccurate radial velocities for the WD (e.g. Appendix A.2 in Hellier, 2001). For example, although CSS 100603 has a mass ratio of just , in that system is km s-1 for the H line, a number which would be unreasonably high if it actually represented the WD’s motion.
The resulting radial velocity curve is shown in Figure 7 where the phase has been set to match the photometric phase. The maximum brightness in the orbital modulation occurs at the maximum disk redshift.

4 Discussion
4.1 Evolutionary Track of CSS 120422
Several attributes of CSS 120422 distinguish it from most other sub-period-minimum systems with detectable hydrogen. For example, EI Psc and V485 Cen both contain prominent secondary stars which are relatively easy to detect spectroscopically. The prevailing explanation for the secondary stars in these two systems is that they are evolved stars which have shed their outer envelopes. Both are abnormally luminous for such short orbital periods (Uemura et al., 2002). While EI Psc and V485 Cen both exhibit helium enrichment like CSS 120422, the non-detection of the donor in CSS 120422 out to 950 nm suggests that it is cool and dim, in agreement with the system’s very low mass ratio.
While the combination of an invisible donor and a sub-minimum period could be the signature of a brown-dwarf secondary, the greatly elevated levels of helium in CSS 120422 do not support this scenario. Brown dwarfs, by definition, lack the mass necessary to enter the main sequence, so they should not be particularly rich in helium. Thus, the helium enhancement in EI Psc and V485 Cen is inconsistent with the presence of brown-dwarf donors in those systems (Politano, 2004); indeed, in the spectra of brown-dwarf CVs, the He I emission is quite subdued (e.g., Littlefair et al., 2007; Unda-Sanzana et al., 2008). Although the He I/H ratio is sensitive to both pressure and temperature, the intense He I lines in CSS 120422 disfavor the possibility that the secondary star is a brown dwarf.
Indeed, at first blush, CSS 120422 is almost identical to CSS 100603, the system reported by Breedt et al. (2012). In both of these sub-period-minimum systems, the accretion disk shows high levels of both hydrogen and helium, and the late-type donor is spectroscopically undetectable. In their theoretical examination of AM CVn progenitors, Nelemans et al. (2010) identify the presence of hydrogen as conspicuous evidence favoring the evolved-CV channel over the double-white-dwarf and helium-star channels of AM CVn formation; if the secondary were either a white dwarf or a helium star, hydrogen would likely be undetectable. Thus, both of these systems are excellent candidates for AM CVn progenitors evolving pursuant to the evolved-main-sequence-donor model.
In neither system is the donor fully degenerate yet. To reach this conclusion about CSS 100603, Breedt et al. (2012) relied upon models of fully degenerate helium stars, and we took a similar approach with CSS 120422. Specifically, we used Equation 15 in Verbunt & Rappaport (1988) (a mass-radius relation for a fully degenerate helium star) and set it equal to Equation 6 in Knigge (2006) (a formula for the radius of a Roche-lobe-filling star given its mass and orbital period). Together, these formulae reveal that if the secondary were a degenerate helium star with an orbital period of 0.9227 hours, its mass would be 0.0083M⊙—which, given the mass ratio of 0.06, implies an unreasonably low WD mass of 0.14M⊙. Alternatively, if we adopt 0.83M⊙ as the mass of the primary,333According to Zorotovic, Schreiber, & Gänsicke (2011), this is the average mass of primary stars in CVs. the expected mass of the secondary would be 0.05M⊙ according to the mass ratio. A helium star of this mass would have a radius of just 0.03R⊙, making it considerably smaller than the radius of its Roche lobe (0.08R⊙). Based on these considerations, we conclude that the donor in CSS 120422 is semi-degenerate, and the system will continue to evolve toward the shorter orbital periods which characterize the majority of AM CVn stars.
While it is likely that these two systems are the products of very similar evolutionary processes, CSS 120422 does have several features which differentiate it from its cousin. The two most obvious dissimilarities are that CSS 120422 is an additional minutes below the period minimum and has a mass ratio 4 times greater than Breedt’s CV. Moreover, CSS 120422 shows more extensive heavy-element enrichment, especially the Si II 634.7/637.1-nm doublet and the near-infrared Ca II triplet, both of which are weak or non-existent in CSS 100603. As Section 4.2 explains, we also find that CSS 120422’s disk is decidedly non-uniform—especially in the H wavelength—and likely contains spiral structure. No comparable features have been reported in CSS 100603.
4.2 Non-Uniform Disk Emission
The H spectroscopy shows evidence of multiple emission regions on the disk. In the trailed H spectra in Fig. 9, the most prominent feature is the bright spot’s classic S-wave, which oscillates between the H line’s two peaks over the course of the orbit. This S-wave vanishes as the bright spot moves from zero-velocity to maximum blueshift, only to reappear abruptly as the bright spot attains its maximum blueshift. During the bright spot’s invisibility, a blueshifted absorption-like feature appears, but we suspect that it is the mere absence of emission rather than true absorption. In addition, near the maximum redshift of the bright spot, an even stronger emission feature appears in the blue wing of the H line. As the bright spot transitions from maximum redshift to zero radial velocity, the blueshifted emission feature also moves toward zero velocity, but its intensity plummets dramatically.
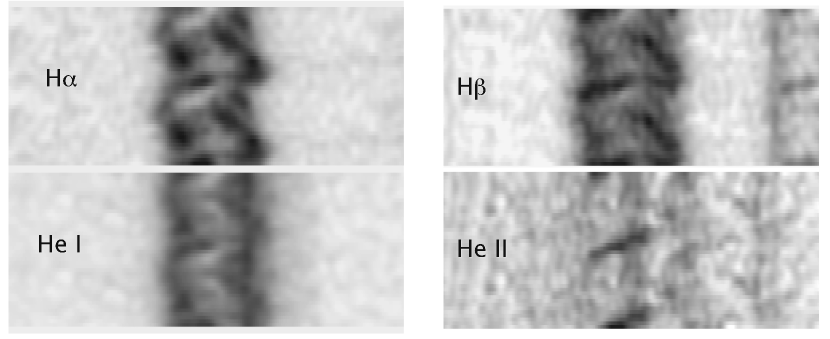
The appearance of the H and He I lines (also in Fig. 9) is somewhat less remarkable. The S-wave from the bright spot remains apparent, but the second emission feature is very subtle compared to the H trailed spectrum. As with the H line, the bright spot vanishes in these wavelengths as it moves from zero radial velocity to maximum blueshift.
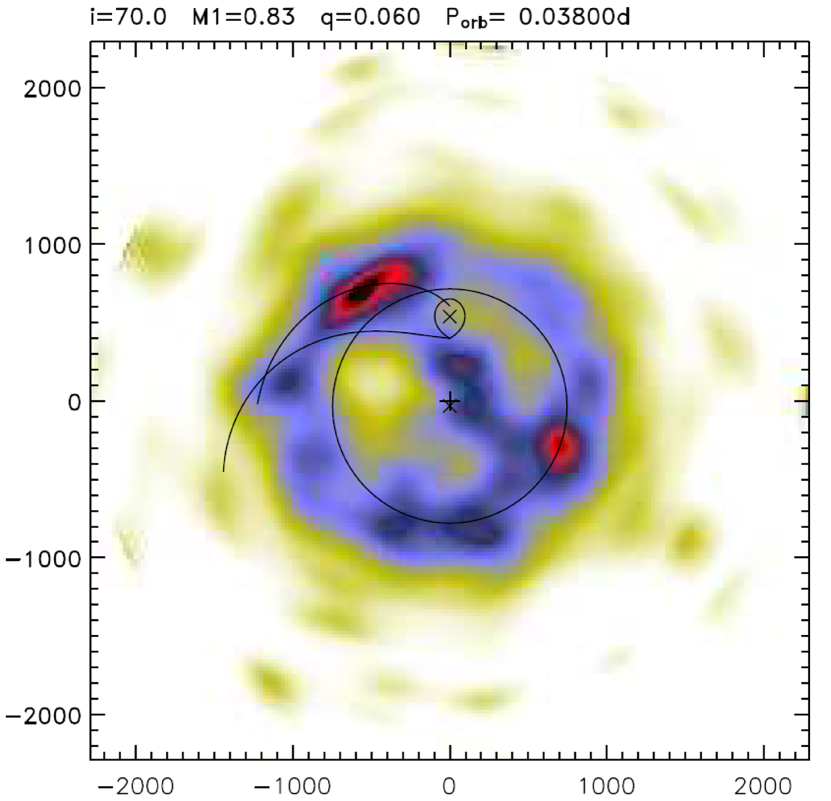
The velocity information contained within a trailed spectrum can be used to reconstruct an indirect image of the disk in velocity coordinates (as opposed to spatial coordinates). Known as Doppler tomography, this technique essentially generates an inside-out image of the disk (Marsh & Horne, 1988). Using the Doppler tomography algorithm of Spruit (1998), we find that the competing S-waves in the H trailed spectrum correspond with two distinct emission regions located on opposite sides of the disk (Fig. 10). The bright spot in the Vx,+Vy quadrant, which has a noticeably higher velocity than the other emission, is almost certainly attributable to the shock created by the stream-disk interaction, but the emission in the +Vx,Vy quadrant—which consists of both intermediate- and low-velocity components—presents a more of a mystery, one which we address in the following two subsections.
4.2.1 Tidally-Induced Spiral Shocks
In other CVs, there have been at least two major proposed explanations for non-uniform emission of this sort. One possibility is that the outer disk contains spiral arms produced by the tidal torque of the secondary. Spiral shocks facilitate angular momentum transfer in the disk, and in CVs with very low mass ratios, spirals can be permanent features in the disk because material in the outer disk attains a 2:1 orbital resonance with the donor (Lin & Papaloizou, 1979). In CVs with relatively high mass ratios, tidal forces dissipate the outer disk before it can expand to the 2:1 resonance, but calculations by both Lin & Papaloizou (1979) and Osaki & Meyer (2002) found that when , the 2:1 resonance is inside the tidal truncation radius. Observationally, several CVs have shown strong evidence of spiral structure stemming from the 2:1 resonance (e.g. Aviles et al., 2010).
We favor the presence of spiral shocks in as the source of the features observed in our Doppler tomogram. Given that , the 2:1 resonance in CSS 120422 rests within the tidal truncation radius, making it possible for permanent spiral structure to develop as described in Lin & Papaloizou (1979). We further note that the overall appearance of our tomogram is very similar to a simulated tomogram of a disk with spiral arms caused by disk material at this very resonance (Aviles et al., 2010). To test more quantitatively for the presence of disk material at the 2:1 resonance, we again adopted a WD mass of 0.83M⊙ (see our footnote 3) and computed the Keplerian velocity of disk material with an orbital period of exactly half of the system’s orbital period. According to the formula
the corresponding resonance velocity for these parameters is 750 km s-1, which we plot as a circle around the origin in the tomogram. Although there are obvious pitfalls with simply assuming the WD’s mass, the overlaid circle intersects much of the intense, non-uniform emission, furnishing circumstantial evidence that the disk in CSS 120422 did extend to the 2:1 resonance when we observed the system.
Just as importantly, Kunze & Speith (2005) calculated that spiral structure in such a system would produce a double-peaked light curve and presented a simulated phase plot which matches ours with uncanny accuracy. Kunze and Speith predict that both the minima and maxima will be unequal, with the deepest minimum coming at phase 0.25 and a weaker one at phase 0.75; the global maximum occurs at phase zero, and the weaker peak at phase 0.55.444Whereas we set phase zero equal to the peak of the light curve, Kunze and Speith selected the time of minimum flux as phase zero in their data. For the sake of internal consistency with the rest of this paper, we apply our own phasing scheme when describing their simulated phase plot. Compared with the corresponding features in Kunze’s and Speith’s simulated light curve, the secondary maximum and minimum in our phase plot (Fig. 5) are somewhat feeble in appearance. This relatively minor disparity might be because the simulations assume a higher inclination than the one actually observed in CSS 120422.
4.2.2 Accretion-Stream Overflow
Alternatively, non-uniform disk emission might be the result of an accretion stream which overflows the disk after its initial collision, a mechanism which has received a great deal of attention in theoretical studies (e.g., Armitage & Livio, 1996, 1998). The overflowing stream would cloak portions of the disk, producing absorption at certain photometric phases and spectroscopic velocities, as it accelerated toward the inner disk. The reimpact of the stream with the disk, in turn, would produce an inner hotspot which, according to Armitage & Livio (1998), would be much more apparent in a system with a low-luminosity accretion disk. The emission in the +Vx,Vy quadrant of our tomogram, therefore, might be such a feature.
A shortcoming of the stream-overflow hypothesis is that the inner bright spot should have a noticeably higher velocity than the outer bright spot because the WD’s strong gravity would significantly accelerate the overflowing stream. We observe the reverse; the second bright spot in the +Vx,Vy quadrant has a lower velocity than the stream-disk interaction. Thus, the lower-than-expected velocity weighs against the possibility of an overflowing accretion stream. Furthermore, an overflowing stream would probably produce absorption at most phases, something which we do not observe.
Though we cannot rule out the possibility of stream overflow, spiral shocks elegantly weave the spectroscopy, photometry, and mass ratio of CSS 120422 into a reasonably coherent theory of the system, one which is less speculative than the stream-overflow model.
5 Conclusion
We have reported photometry and spectroscopy of CSS 120422:111127+571239, a CV with an orbital period over 20 minutes below the period minimum. While the system is hydrogen-rich, its helium-to-hydrogen ratio is much higher than in typical SU UMa-type CVs, and the donor is completely invisible in our spectra. We identify spectroscopic and photometric periods of 52.2 minutes and 55.36 minutes, respectively. Using the 55-minute period and the previously reported superhump period (Kato et al., 2012), we estimate a mass ratio of . Furthermore, Doppler tomography reveals two distinct regions of intense H emission on the disk, consistent with spiral shocks produced when material in the outer disk reaches a 2:1 resonance with the secondary. Drawing upon theoretical light curves of low-mass-ratio CVs, we suspect that these spiral arms are responsible for the intermittently double-peaked orbital modulation in the photometry, which is reminiscent of the variation observed in WZ Sge stars.
The best explanation for the short orbital period and the elevated helium abundance is that CSS 120422 is a progenitor of an AM CVn system following the evolved-CV track, similar to the system reported by Breedt et al. (2012). The discovery of two systems of this type in such rapid succession substantiates theoretical predictions (e.g. Nelemans et al., 2010) that the evolved CV channel of evolution can contribute significantly to the galactic AM CVn population.555Breedt et al. (2012) briefly mention two other sub-period-minimum CVs which could be AM CVn progenitors with evolved donors, but at the time of writing, neither system has been studied in much detail.
References
- Armitage & Livio (1996) Armitage, P. J. & Livio, M. 1996, ApJ, 470, 1024
- Armitage & Livio (1998) Armitage, P. J. & Livio, M. 1998, ApJ, 493, 898
- Augusteijn et al. (1996) Augusteijn, T., van der Hooft, F., de Jong, J. A., & van Paradijs, J. 1996, A&A, 311, 889
- Aviles et al. (2010) Aviles, A., Zharikov, S., Tovmassian, G., et al. 2010, ApJ, 711, 389
- Breedt et al. (2012) Breedt, E., Gänsicke, B. T., Marsh, T. R., et al. 2012, MNRAS, 425, 2548
- Drake et al. (2009) Drake, A. J., Djorgovski, S. G., Mahabal, A., et al. 2009 ApJ, 696, 870
- Garnavich et al. (2012) Garnavich, P., Littlefield, C., et al. 2012, The Astronomer’s Telegram, 4112, 1
- Groot et al. (2001) Groot, P. J., Nelemans, G., Steeghs, D., & Marsh, T. R. 2001, ApJ, 558, L123
- Hellier (2001) Hellier, C., 2001, Cataclysmic Variable Stars: How and Why They Vary. London: Springer-Praxis
- Kato (2012) Kato, T. 2012, VSNET-alert 14475
- Kato et al. (2012) Kato, T., et al. 2012, arXiv:1210.0678v1
- Kato et al. (2004) Kato, T., Uemura, M., Ishioka, R., et al. 2004, PASJ, 56, 1
- Kato et al. (2009) Kato, T., et al. 2009, PASJ, 61, 395
- Knigge (2006) Knigge, C. 1988, MNRAS, 373, 484
- Kolb & Baraffe (1999) Kolb, U. & Baraffe, I. 1999, MNRAS, 309, 1034
- Kunze & Speith (2005) Kunze, S. & Speith, R. 2005, in ASP Conf. Ser. 330, The Astrophysics of Cataclysmic Variables and Related Objects, eds. J. M. Hameury & J. P. Lasota (San Francisco, CA: ASP), 389
- Lin & Papaloizou (1979) Lin, D. N. C. & Papaloizou, J. 1979, MNRAS, 186, 799
- Littlefair et al. (2007) Littlefair, S. P., Dhillon, V. S., Marsh, T. R., et al. 2007, MNRAS, 381, 827
- Long & Gilliland (1999) Long, K. S. & Gilliland, R. L. 1999, ApJ, 511, 916
- Marsh & Horne (1988) Marsh, T. R. & Horne, K. 1988, MNRAS, 235, 269
- Marsh et al. (1991) Marsh, T. R., Horne, K., & Rosen, S. 1991, ApJ, 366, 535
- Nagel, Rauch, & Werner (2009) Nagel, T., Rauch, T., & Werner, K. 2009,A&A, 499, 773
- Nelemans et al. (2010) Nelemans, G., Yungelson, L. R., van der Sluys, M. V., and Tout, C. A. 2010, MNRAS, 401, 1347
- Osaki & Meyer (2002) Osaki, Y. & Meyer, F. 2002, A&A, 383, 574
- Patterson (1998) Patterson, J. 1998, PASP, 110, 1132
- Patterson, Thorstensen, & Knigge (2008) Patterson, J., Thorstensen, J., & Knigge, C. 2008, PASP, 120, 510
- Podsiadlowski, Han, & Rappaport (2003) Podsiadlowki, P., Han, Z., & Rappaport, S. 2003 MNRAS, 340, 1214
- Pogge et al. (2010) Pogge, R. W., Atwood, B., Brewer, D. F., et al. 2010, Proc. SPIE, 7735
- Politano (2004) Politano, M. 2004, ApJ, 604, 817
- Rodríguez-Gil et al. (2005) Rodríguez-Gil, P., Gänsicke, B. T., Hagen, H.-J., et al. 2005, A&A, 431, 269
- Shafter (1983) Shafter, A. W. 1983, ApJ, 267, 222
- Spruit (1998) Spruit, H. C. 1998, arXiv:astro-ph/9806141v1
- Stellingwerf (1978) Stellingwerf, R. F. 1978, ApJ, 224, 953
- Thorstensen et al. (2002) Thorstensen, J. R., Fenton, W. H., Patterson, J. O., et al. 2002, ApJ, 567, 49
- Uemura et al. (2002) Uemura, M., Kato, T., Ishioka, R., et al. 2002, PASJ, 54, 599
- Unda-Sanzana et al. (2008) Unda-Sanzana, E., Marsh, T. R., Gänsicke, B. T., et al. 2008, MNRAS, 388, 889
- Verbunt & Rappaport (1988) Verbunt, F. & Rappaport, S. 1988, ApJ, 332, 193
- Williams & Ferguson (1982) Williams, R. E. & Ferguson, D. H. 1982, ApJ, 257, 672
- Zorotovic, Schreiber, & Gänsicke (2011) Zorotovic, M., Schreiber, M. R., & Gänsicke, B. T. 2011, A&A, 536, 42
| Date | HJD | Exposure | Instrument |
|---|---|---|---|
| (UT) | +2456000 | (sec) | /Telescope |
| 2012 May 12 | 1800 | FAST/Tillinghast | |
| 2012 May 13 | 60.6356 | 420 | FAST/Tillinghast |
| 2012 May 13 | 60.6412 | 420 | FAST/Tillinghast |
| 2012 May 13 | 60.6462 | 420 | FAST/Tillinghast |
| 2012 May 13 | 60.6512 | 420 | FAST/Tillinghast |
| 2012 May 13 | 60.6570 | 420 | FAST/Tillinghast |
| 2012 May 13 | 60.6620 | 420 | FAST/Tillinghast |
| 2012 May 13 | 60.6670 | 420 | FAST/Tillinghast |
| 2012 May 13 | 60.6727 | 420 | FAST/Tillinghast |
| 2012 May 13 | 60.6777 | 420 | FAST/Tillinghast |
| 2012 Jun 16 | 94.6645 | 400 | MODS/LBT |
| 2012 Jun 16 | 94.6680 | 400 | MODS/LBT |
| 2012 Jun 16 | 94.6716 | 400 | MODS/LBT |
| 2012 Jun 16 | 94.6751 | 400 | MODS/LBT |
| 2012 Jun 16 | 94.6786 | 400 | MODS/LBT |
| 2012 Jun 16 | 94.6821 | 400 | MODS/LBT |
| 2012 Jun 16 | 94.6856 | 400 | MODS/LBT |
| 2012 Jun 16 | 94.6891 | 400 | MODS/LBT |
| 2012 Jun 16 | 94.6926 | 400 | MODS/LBT |
| 2012 Jun 16 | 94.6962 | 400 | MODS/LBT |
| 2012 Jun 16 | 94.6997 | 400 | MODS/LBT |
| 2012 Jun 16 | 94.7032 | 400 | MODS/LBT |
| 2012 Jun 16 | 94.7068 | 400 | MODS/LBT |
| 2012 Jun 16 | 94.7103 | 400 | MODS/LBT |
| 2012 Jun 16 | 94.7138 | 400 | MODS/LBT |
| 2012 Jun 16 | 94.7173 | 400 | MODS/LBT |