The origin of the 3.4 m feature in Wild 2 cometary particles and in ultracarbonaceous interplanetary dust particles
Abstract
We analyzed 2 ultra-carbonaceous interplanetary dust particles and 2 cometary Wild 2 particles with infrared spectroscopy. We characterized the carrier of the 3.4 m band in these samples and compared its profile and the CH2/CH3 ratios to the 3.4 m band in the diffuse interstellar medium (DISM), in the insoluble organic matter (IOM) from 3 primitive meteorites, in asteroid 24 Themis and in the coma of comet 103P/Hartley 2. We found that the 3.4 m band in both Wild 2 and IDPs is similar, but different from all the other astrophysical environments that we compared to. The 3.4 m band in IDPs and Wild 2 particles is dominated by CH2 groups, the peaks are narrower and stronger than in the meteorites, asteroid Themis, and the DISM. Also, the presence of the carbonyl group C=O at 1700 cm-1 (5.8 m) in most of the spectra of our samples, indicates that these aliphatic chains have O bonded to them, which is quite different from astronomical spectra of the DISM. Based on all these observations we conclude that the origin of the carrier of the 3.4 m band in IDPs and Wild 2 samples is not interstellar, instead, we suggest that the origin lies in the outermost parts of the solar nebula.
1 Aim of paper
In this work we performed a coordinated study of cometary and interplanetary particles. We first used an electron microscope to locate the carbonaceous materials in the samples and determine their morphological aspects. We then performed in situ infrared spectroscopy directly on the carbonaceous materials to investigate their 3.4 m band and the presence of other organic-related peaks (carbonyl, aromatics, etc). Finally we compared the 3.4 m feature of our samples to the 3.4 m feature of other astrophysical environments.
2 Introduction
The NASA Stardust spacecraft returned particles collected from the coma of comet 81P/ Wild 2 (hereafter Wild 2). Hundreds of cometary particles ranging from 1 m to 100 m in size were collected by impact into aerogel with an encounter velocity of 6.1 km/s (Brownlee et al. 2006). The examination of these samples has provided many unexpected findings, including the presence of refractory minerals (Simon et al. 2008), the presence of chondrule-like objects (Nakamura et al. 2008) and low abundance of presolar grains (Stadermann & Floss 2008). Indigenous organic materials are also observed in Wild 2 samples (Sandford et al. 2006; Matrajt et al. 2008; Cody et al. 2008, 2011; Gallien et al. 2008; Wirick et al. 2009; De Gregorio et al. 2010, 2011; Clemett et al. 2010; Nakamura-Messenger et al. 2011). The abundance of organic matter in the Wild 2 samples was lower than expected because the most of the submicron material was destroyed upon capture (Brownlee et al. 2006). Coordinated analyses of organic material have shown that the organic material in the Wild 2 particles is very diverse in its morphology, isotopic and chemical composition, abundance, spatial distribution and complexity (Matrajt et al. 2008; De Gregorio et al. 2010, 2011; Nakamura-Messenger et al. 2011). Infrared spectroscopy (Sandford et al. 2006; Keller et al. 2006; Muñoz Caro et al. 2008; Bajt et al. 2009) has shown that aliphatics are present in most tracks and particles. In some cases, the aliphatic molecules are indistinguishable from the organics intrinsic to aerogel (Muñoz Caro et al. 2008). But in most cases the organics are very different from the compounds found in aerogel, which is mainly dominated by CH3 groups (Bajt et al. 2009).
Interplanetary dust particles (IDPs) are materials collected in the Earth’s stratosphere usually considered to be among the most primitive samples of the solar system (Brownlee et al. 1976; Sandford 1987). Most IDPs are very carbon-rich, having in average 10-12 wt C content (Schramm et al. 1989). The carbonaceous materials in these IDPs are made of organic molecules (Thomas et al. 1993; Flynn et al. 2003), including aromatic and aliphatic compounds (Clemett et al. 1993; Keller et al. 2004). These carbonaceous phases often have H and N isotopic anomalies (Messenger 2000; Aleon et al. 2003; Keller et al. 2004) proving that they are indigenous and suggesting that they formed through low-temperature chemical reactions (Messenger 2000; Keller et al. 2004; Floss et al. 2006) in a presolar cold molecular cloud or at the edges of the protoplanetary disk.
In the present study we analyzed with Fourier transform infrared spectroscopy two IDPs and two Wild 2 samples that have been previously characterized by other analytical (Matrajt et al. 2008, 2012). These past studies revealed that all of these samples have carbonaceous materials with 15N and D excesses and it was suggested that this is primitive organic matter that has changed little or not at all since the formation of the Solar System (Flynn et al. 2003; Keller et al. 2004; Matrajt et al. 2008, 2012, 2013). However, owing to their small size, the nature of these phases has been poorly constrained. In this work we characterized these organic materials with FTIR to determine 1) the nature of the organics; 2) the characteristics of the 3.4 m band and 3) the origin of these carbonaceous materials (solar vs interstellar).
3 Samples
In this study we worked with two IDPs, that we nicknamed Chocha and GS and two fragments from two Stardust tracks that we nicknamed Febo and Ada.
3.1 GS
Particle GS (curatorial name L2055-R-1,2,3,4,5 cluster 7) is a “Grigg-Skjellerup timed-collection” IDP. Calculations (Messenger 2002) predicted that 1 to 50 of the total flux of IDPs 40 m in diameter collected after Earth passed through comet 26P/Grigg-Skjellerup’s dust stream in April 2003 would originate from this comet. A dedicated collection of this dust stream was organized by NASA known as “Grigg-Skjellerup collection”. Our sample is an ultra-carbonaceous particle made of 90 carbon, anhydrous minerals (mainly olivines and diopside) and Fe-Mg carbonates. Previous studies of the carbonaceous materials of this particle showed that it is composed of several carbonaceous textures which have N isotopic anomalies (Matrajt et al. 2012).
3.2 CHOCHA
Particle Chocha is an IDP from collector flag W7154. It is an anhydrous ultra-carbonaceous particle made of 95 carbon. It also contains anhydrous minerals, mainly olivine, pyroxene (diopside) and Fe-Ni sulfides (pyrrhotite and pentlandite). Previous studies of the cabonaceous materials of this particle showed that it is composed of several carbonaceous textures which all have N isotopic anomalies (Matrajt et al. 2012).
3.3 FEBO
Particle Febo is fragment 2 from Stardust track 57. The particle is made mainly of pyrrhotite and fine-grained material and also contains small silicates. Previous studies of the carbonaceous materials, found in the periphery of the pyrrhotite and between the small fine grains, showed that they have several textures and N and H isotopic anomalies (Matrajt et al. 2008).
3.4 ADA
Particle Ada is fragment 2 from Stardust track 26. The particle is made mainly of tridymite and fayalite. Previous studies of the carbonaceous materials, found in the periphery of the particle, showed that they have several textures and N and H isotopic anomalies (Matrajt et al 2008).
4 Methoods
4.1 Sample preparation
The Wild 2 particles were received from NASA inside aerogel chips, also known as keystones. The entire aerogel chips and the IDPs were embedded in acrylic, then cut with a diamond knife to a thickness of less than 50 nm to make it transparent to the electron beam. Acrylic was then dissolved out from the cut sections with chloroform vapors, following the methodology developed by Matrajt & Brownlee (2006).
4.2 Transmission Electron Microscopy (TEM)
All microtome slices were studied with a 200 keV Tecnai field-emission electron microscope in transmission mode. We used a CCD Orius camera to study the morphologies and textures of the carbonaceous materials. We also used a Gatan Imaging Filter (GIF) detector to acquire carbon maps.
4.3 Fourier Transform Infra Red (FTIR) spectroscopy
Fourier transformed Infrared (FTIR) spectroscopy is a technique often used for the in situ identification of organic functional groups. The mid infrared spectral region, from 650 to 4000 cm-1, shows unique absorption features characteristic of organic materials. We used the infrared microscope located on beamline U2B of the National Synchrotron Light source at Brookhaven National Laboratory to study samples Febo, GS and Chocha. Spectra were obtained over a range of 4000 to 650 cm-1 and with an energy resolution of 4 cm-1 and a spatial resolution of 3-5 m, using a Thermo-Nicolet Continuum FTIR bench (KBr beamsplitter) in transmission mode, and a MCT-A detector. Sample Ada was analyzed at the Advanced Light Source (ALS) at Lawrence Berkeley National Laboratory, using a Thermo-Nicolet Magna 760 FTIR bench (KBr beamsplitter) and a SpectraTech Nic-Plan IR microscope in reflectance mode, and an MCT-A detector. The preliminary IR data of Ada was published in a conference abstract (Wopenka et al. 2008).
5 Results
Table 1 shows the peak assignments for all the peak positions found in all four samples and it also shows which assignments were found for each of the samples studied. Table 2 shows the CH2/CH3 ratios. Ratios were calculated using the optical depth of the CH3 peak at 2956 cm-1 and the optical depth of the CH2 peak at 2926 cm-1 (Sandford et al. 1991). We made a baseline correction by fitting the baseline with a straight line across the range from 3100 cm-1 to 2800 cm-1. Table 3 shows a comparison of peaks from the 3.4 m region and the C=O peak between our samples and other objects (DISM, comet 103P/Hartley, Murchison IOM, Orgueil IOM, Tagish Lake, asteroid 24 Themis).
The IR peak assignments and interpretations were done based on former IR studies of IDPs (Keller et al. 2004; Matrajt et al. 2005; Muñoz Caro et al. 2006) and the Tagish Lake meteorite (Matrajt et al. 2004) and are as follows: 3255 cm-1 is the OH stretch in water, carboxylic acids or alcohols. 2990 cm-1 is a =C-H stretching 2950-2956 cm-1 is the CH3 asymmetric stretching in aliphatic hydrocarbons. 2918-2920 cm-1 is the CH2 asymmetric stretching in hydrocarbons. 2896 and 2860-2870 cm-1 are the CH3 symmetric stretchings in hydrocarbons. 2845-2855 cm-1 is the CH2 symmetric stretching in aliphatic hydrocarbons. 2160 cm-1 is a C=C stretching vibration in alkenes. 1740 cm-1 is the carbonyl (C=O) in esters. 1730, 1714-1717 and 1700 cm-1 are C=O stretching in ketone and carboxylic acids. 1685 cm-1 is the H-O-H stretching in water. 1480 and 1447 cm-1 are CH3 and CH2 bending vibrations, respectively. 1435 cm-1 is C=C stretching in aromatics. 1386 cm-1 is the CH3 symmetric bending. 1270 and 1240 cm-1 are C-O-C vibrations in esters. 1190 and 1147 cm-1 are unknown. 1065 cm-1 is a C-OH vibration in secondary cyclic alcohol. 987, 970 and 910 cm-1 are CH=CH bending vibrations. Absorption at 1650-1654 cm-1 is the C=C stretching in aromatics. 1448 cm-1 is the CH2 bending in aliphatics or the CO3- in carbonates. 1418 cm-1 is the C=C stretching in aromatics. 1350 cm-1 is the CH3 bending in aliphatic hydrocarbons. 1220 cm-1 is the CH2 wagging mode. 1160 cm-1 is CH2 twisting mode. 1216, 1136 and 1106 cm-1 are Si-O stretching in silicates. 1070, 1060 and 952 cm-1 are the Si-O stretching in pyroxenes. 930 cm-1 is the Si-O stretching in silicates and 887 cm-1 is Si-O stretching in olivine.
5.1 IDP GS
5.1.1 TEM
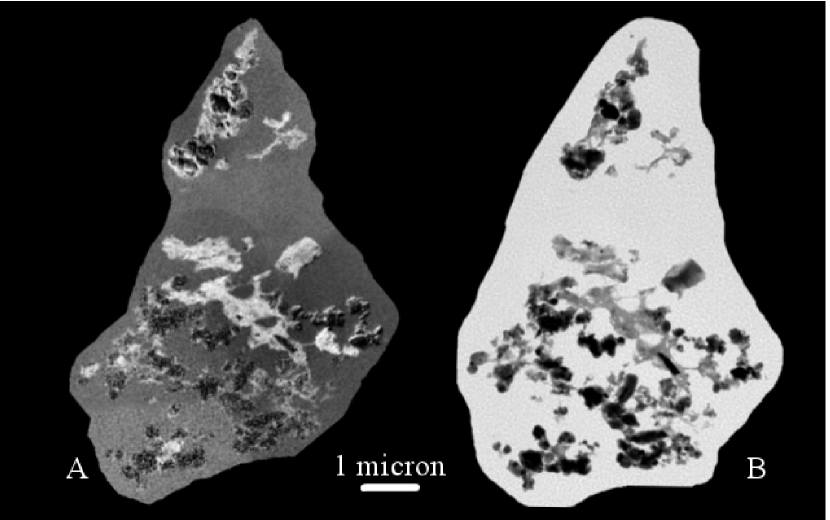
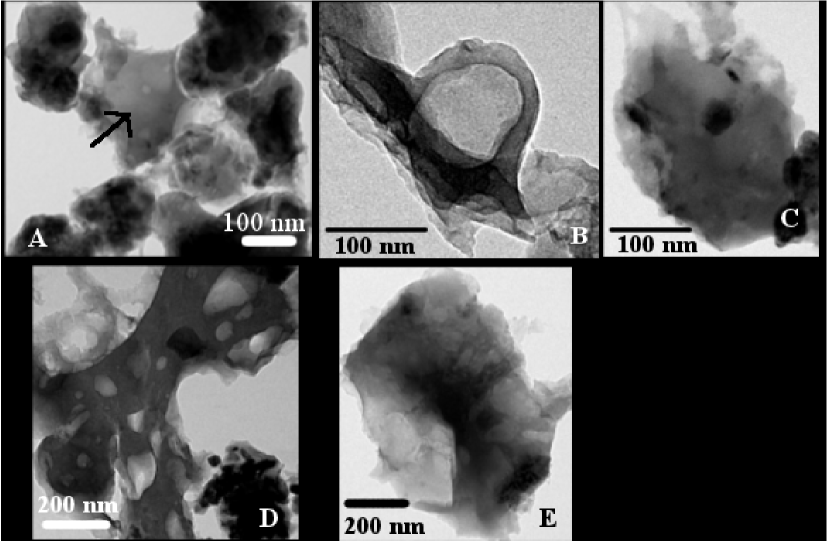
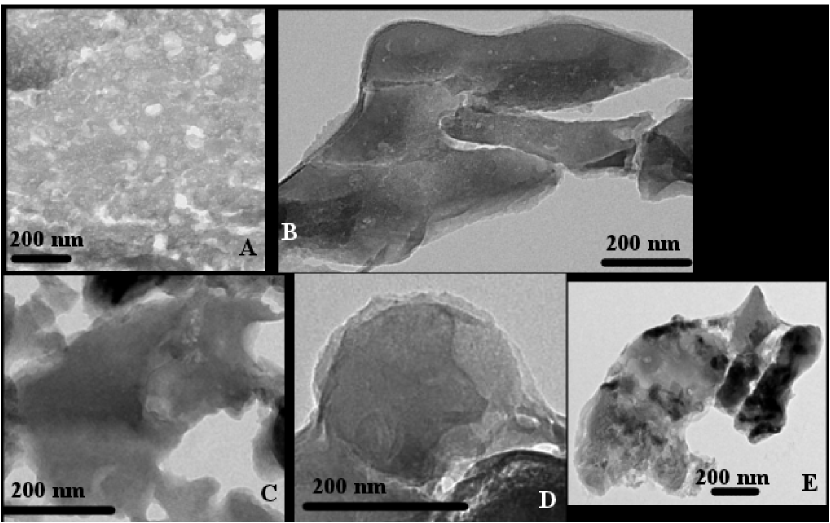
Energy filtered transmission electron microscopy (EFTEM) carbon maps revealed that most of the microtomed area of the particle is made of carbonaceous material (Figure 1). The bright field (BF) images of the different carbonaceous areas revealed several types of morphologies: spongy, globular, smooth, dirty and vesicular. These morphologies, previously described in adjacent sections of this same IDP and other IDPs (Matrajt et al. 2012) can be described as follows (Figure 2): vesicular morphology is characterized by having small vesicles or voids found in a C-rich smooth material. Usually the voids are smaller than the section thickness (50-70 nm). Globular morphology is characterized by round-shaped structures that may be hollow or filled. Dirty morphology is characterized by a carbonaceous material that has mineral grains (typically sulfides) embedded in it. Spongy morphology is characterized by a lace mesh-like material. Smooth morphology is characterized by a shapeless and textureless material.
5.1.2 IR
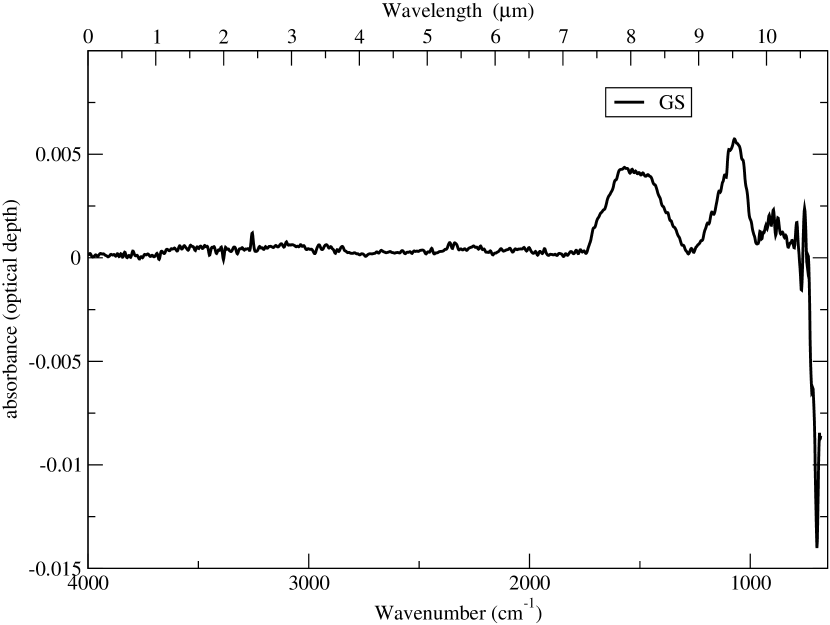
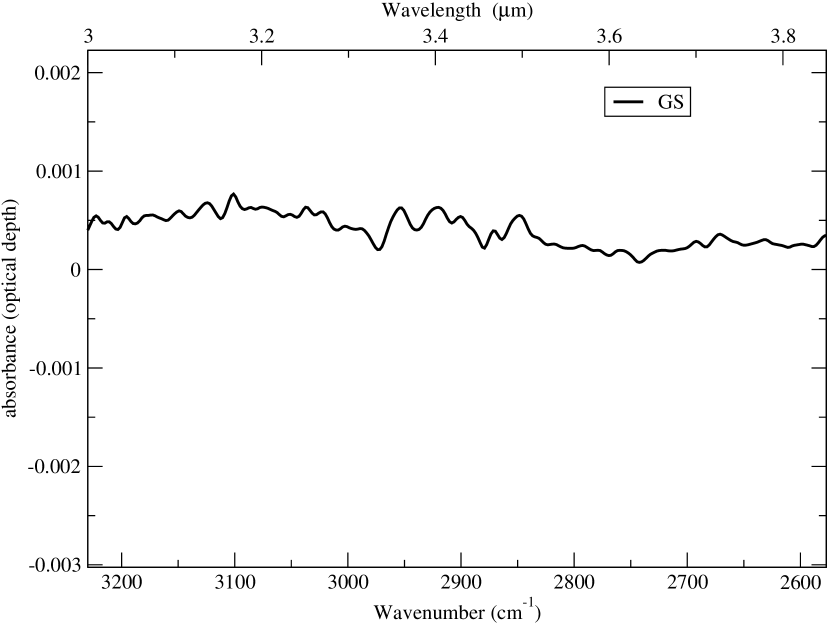
Figure 3 shows a FTIR spectrum of the entire particle. Peaks are observed at 3255, 2951, 2920, 2896, 2870, 2845 and 1070 cm-1. Also, a broad band from 1545 to 1455 cm-1 is observed. From the peak assignments we deduced that this particle contains water bonded to its structure, probably to carbonates. It also contains organics that correspond to aliphatic hydrocarbon chains containing symmetric and assymetric stretchings and silicates. The broad band from 1545 and 1455 cm-1 corresponds to carbonates. Figure 4 shows the aliphatic stretching peak area (3000-2800 cm-1) zoomed. The CH2/CH3 band depth ratio found was 1.0 (Table 2).
5.2 IDP Chocha
5.2.1 TEM
EFTEM carbon maps revealed that 95 of the microtomed area of the particle is made of carbonaceous material (Figure 5). The bright field (BF) images of the different carbonaceous areas revealed several types of morphologies (Figure 6): spongy , vesicular, smooth, globular, and dirty. These morphologies were previously described in adjacent sections of this same IDP and other IDPs (Matrajt et al. 2012).
5.2.2 IR
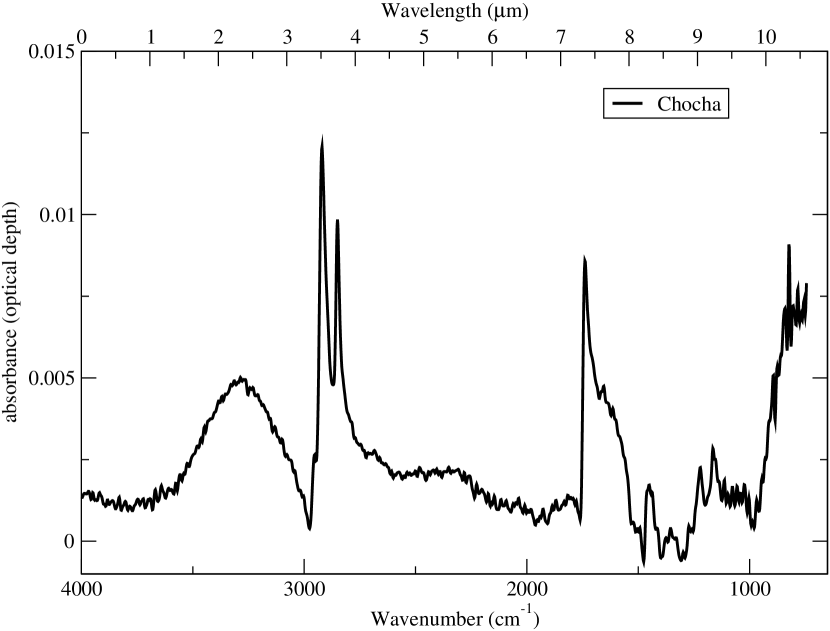
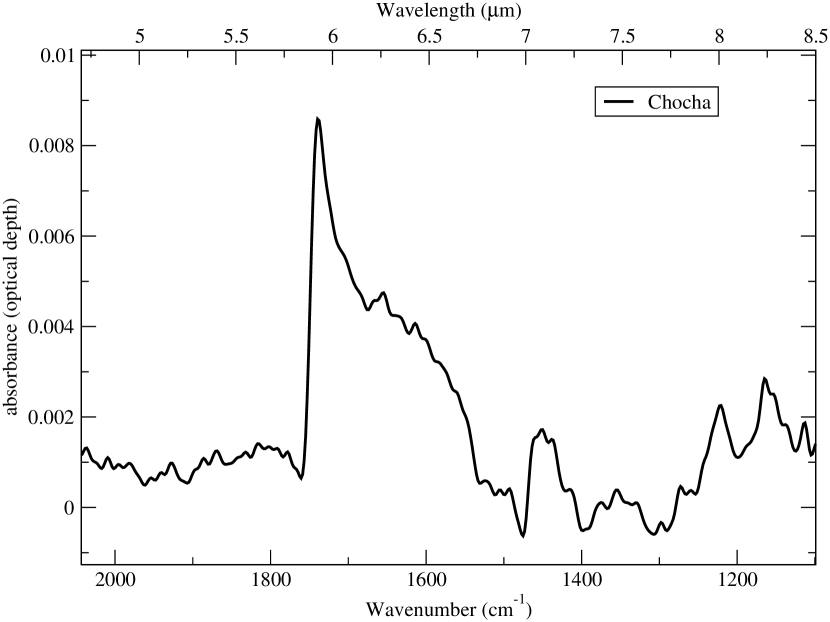
Figure 7 shows a FTIR spectrum of the entire particle. Peaks are observed at 2956, 2920, 2847, 1740, 1654, 1448, 1350, 1220 and 1160 cm-1. There is also a broad band centered at 3270 cm-1. From the peak assignments (Table 1) we deduced that this particle contains aliphatic hydrocarbon chains containing symmetric and assymetric stretchings. The organic material also contains carbonyl, probably in the form of esters, and either olefinic or aromatic C=C molecules. The particle also has silicates. The broad band is the OH stretch in water. The CH2/CH3 ratio found was 4.6 (Table 2).
5.3 Wild 2 Febo
5.3.1 TEM
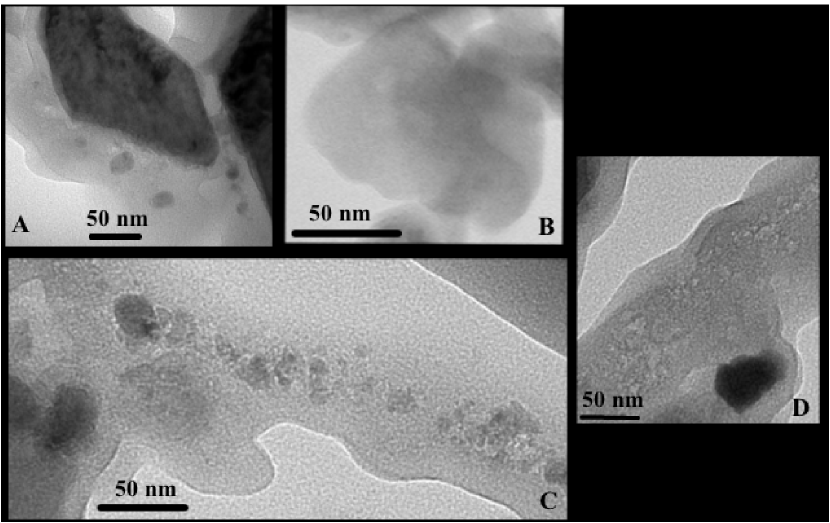
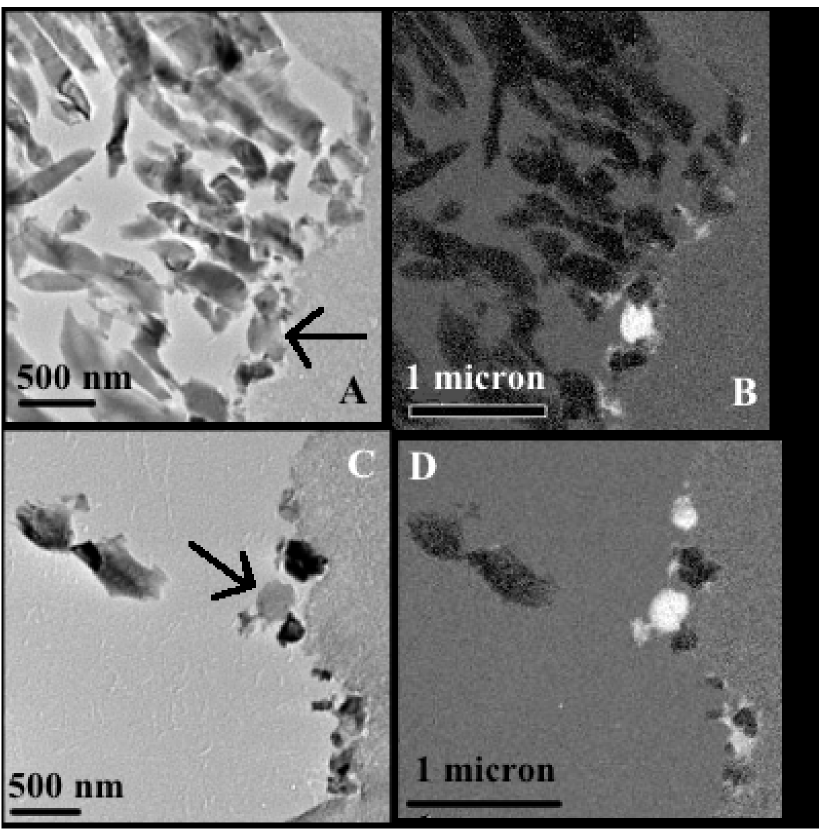
EFTEM carbon maps of the microtomed section revealed several small areas that are carbon-rich (Figure 8). The BF images of the different carbonaceous areas reveal several types of morphologies (Figure 9): dirty , vesicular and smooth. The dirty and vesicular morphologies were previously described in adjacent sections of this same particle (Matrajt et al. 2008) and are identical to morphologies identified in IDPs (Matrajt et al. 2012).
5.3.2 IR
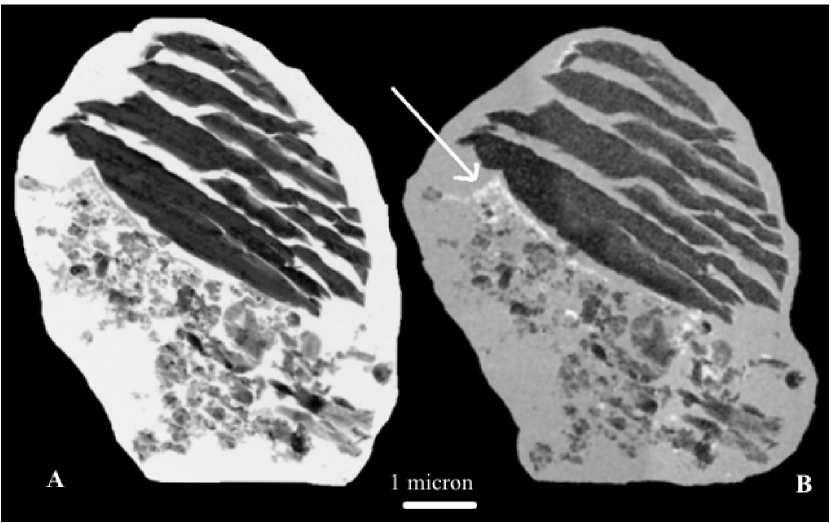
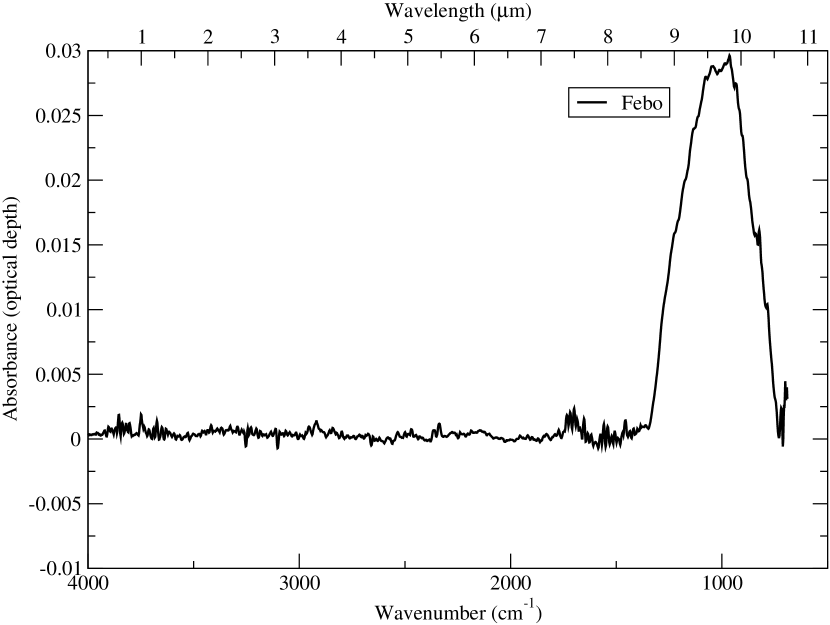
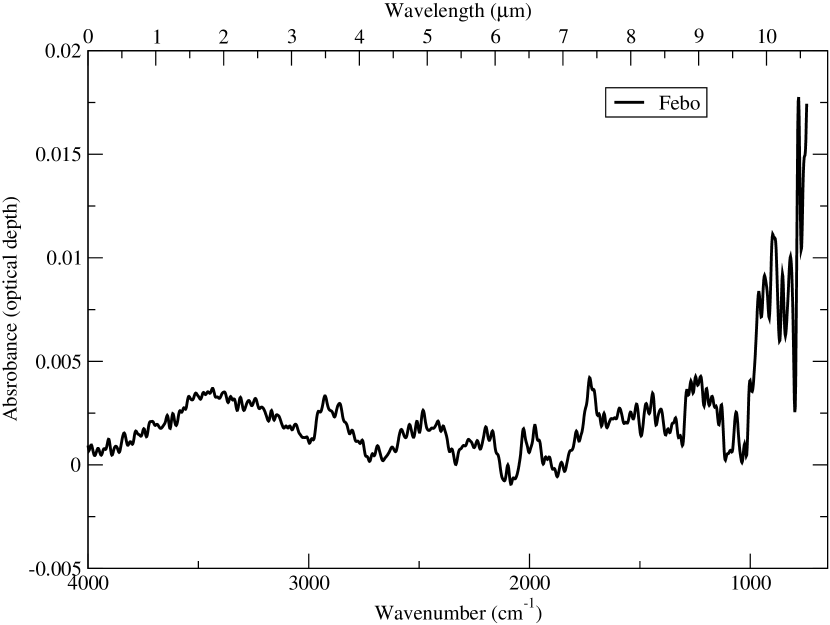
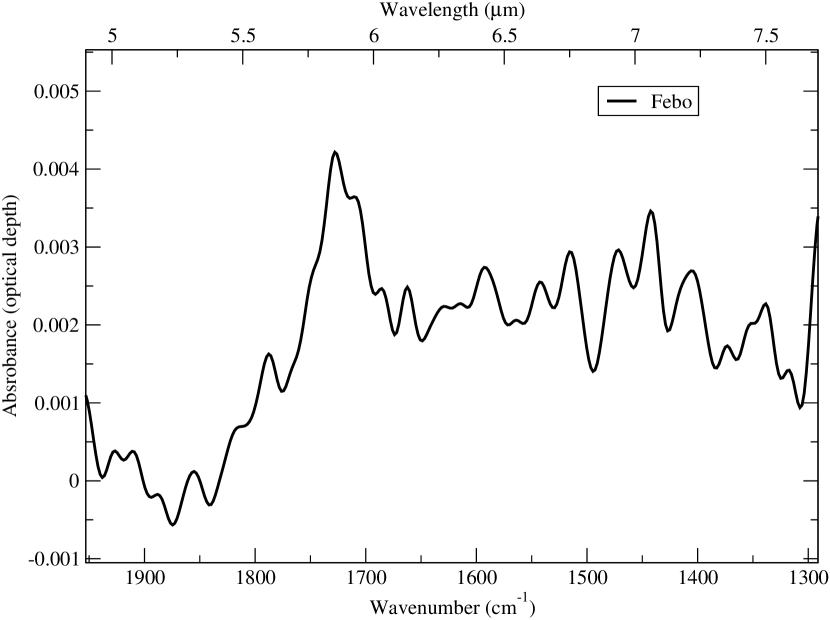
Figure 10 shows two FTIR spectra from two areas of the particle. The left one was acquired primarily on top of the sulfide area (black area of the particle in figure 8). The right spectrum was primarily acquired from the fine-grained area of the particle (arrow in Figure 8), which is the area where all the C-rich materials were observed. Peaks in the left spectrum are observed at 2954, 2920, 2855, 1730, 1717, 1700, 1685 and 1650 cm-1. There is also a broad band between 1070 and 957 cm-1 centered at 1010 cm-1. The peak assignments indicate that this portion of the particle contains hydrocarbons with aliphatic chains, carbonyl in ketones and carboxylic acids and water bonded to the structure of the organic molecules. There is also some evidence of aromatic or olefinic C=C molecular bonds. The broad band is the Si-O stretch in silicates.
The peaks in the right spectrum are observed at 2950, 2920, 2860, 1730, 1060, 952, 930 and 887 cm-1. The peak assignments indicate that this side of the particle has aliphatic hydrocarbon chains and carbonyl in ketones and carboxylic acids. There is also evidence of olivines and pyroxenes. The CH2/CH3 band depth ratio was 1.96 (Table 2).
5.4 Wild 2 Ada
5.4.1 TEM
EFTEM carbon maps of microtomed sections revealed several small areas that are carbon-rich (Figure 11). The BF images of the different carbonaceous areas reveal two types of morphologies: globular and smooth. These morphologies were previously described in adjacent sections of this same particle (Matrajt et al. 2008) and are identical to morphologies identified in IDPs (Matrajt et al. 2012).
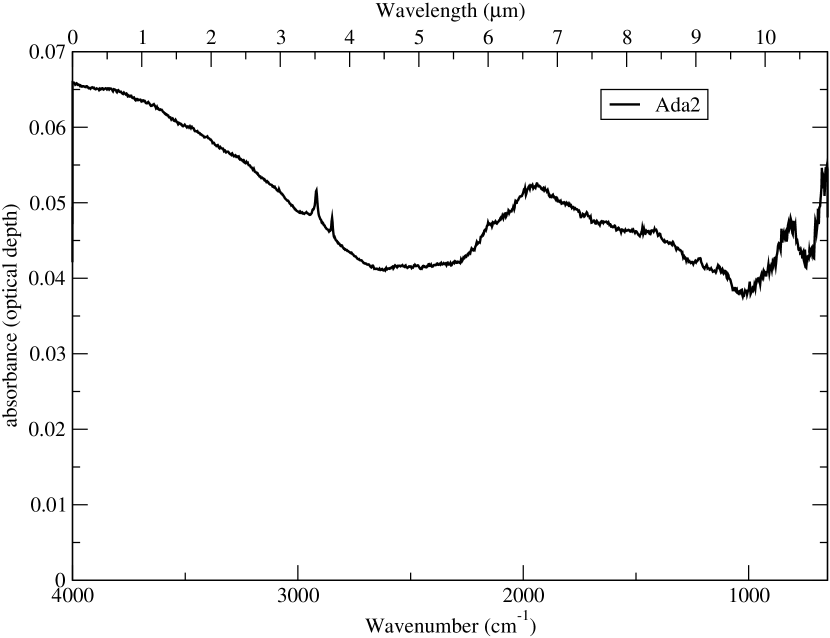
5.4.2 IR
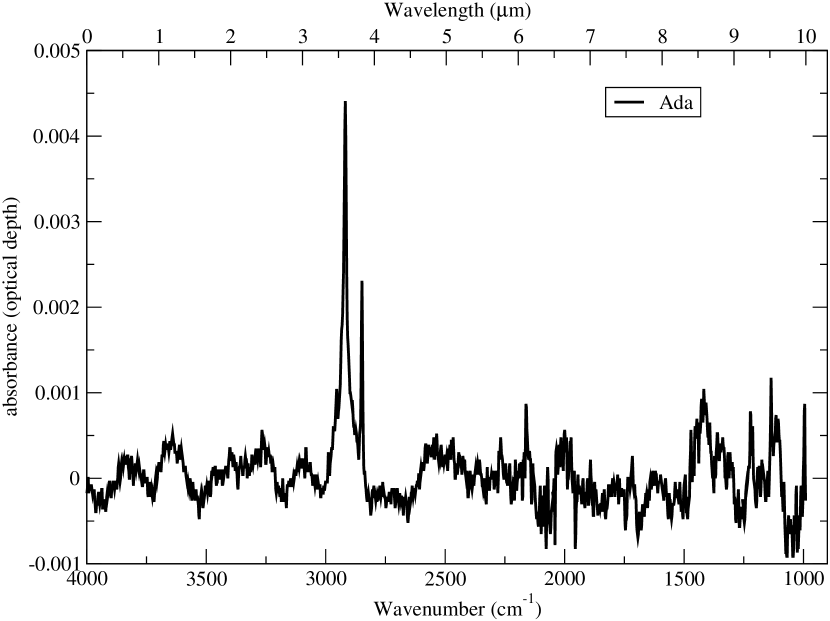
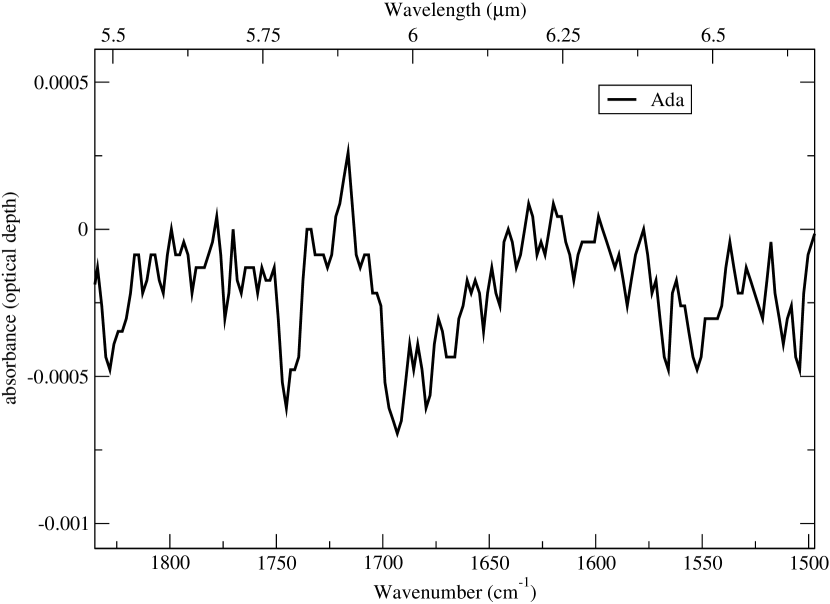
Figure 12 shows two FTIR spectra of two different microtomed sections. Peaks are observed at 2954, 2918, 2847, 2160, 1714, 1418, 1216, 1136 and 1106 cm-1. Peak assignments (Table 1) indicate that this particle contains chains of aliphatic hydrocarbons, some of which have C=C groups attached to them. There is also evidence of carbonyl in ketone and carboxylic acids and either olefinic or aromatic C=C bonds. Olivines are the main silicate present in this sample. The CH2/CH3 band depth ratio was 4.3 (Table 2).
5.5 Acrylic
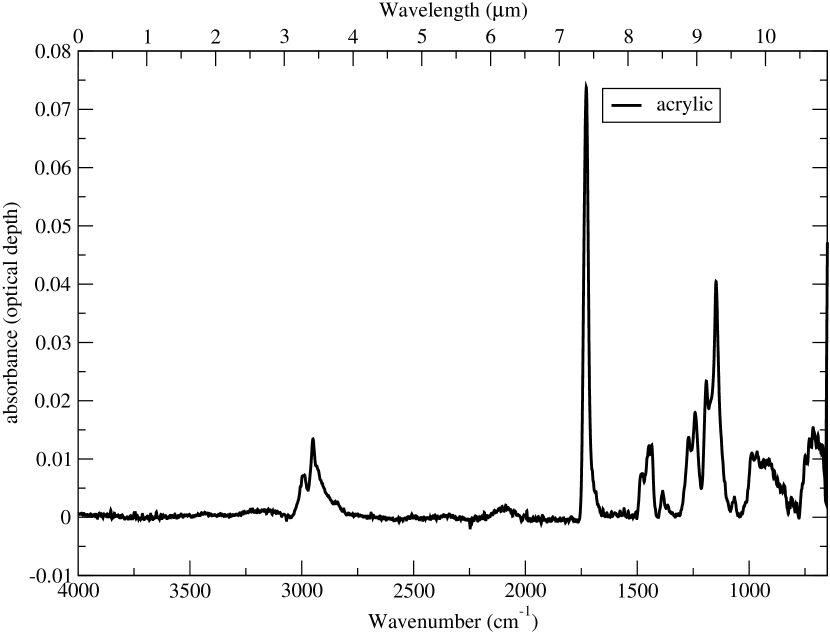
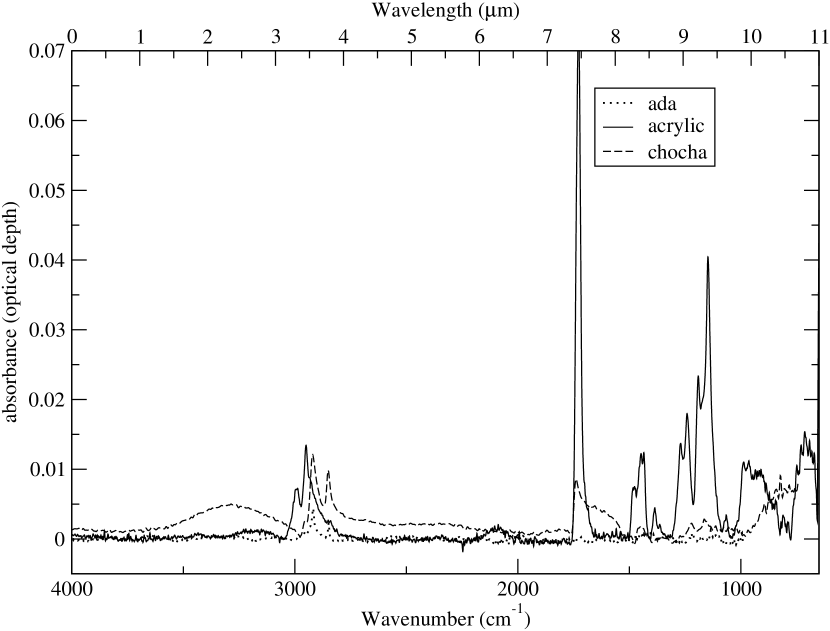
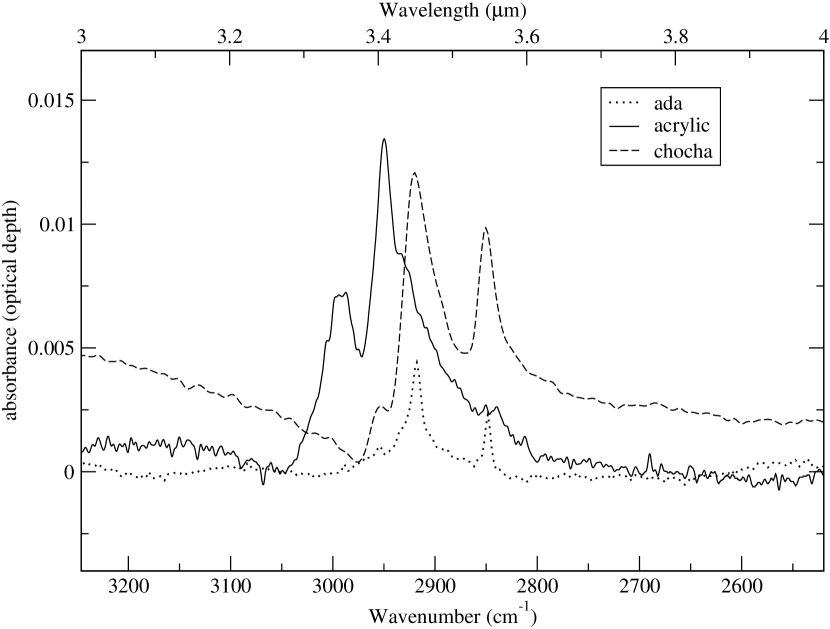
Although the acrylic embedding medium we used for our samples was removed from sections using chloroform vapors, we measured a piece of acrylic with FTIR under the same experimental conditions used for our samples to have a reference spectrum and ensure that the interpretations of the organics in the samples are not biased by the organics found in acrylic. Figure 13 shows a FTIR spectrum of this acrylic. The peaks observed are at 2990, 2949, 1727, 1480, 1447, 1435, 1386, 1270, 1240, 1190, 1147, 1065, 987, 970 and 910 cm-1. Peak assignments (Table 1) indicate that acrylic is composed of aliphatic hydrocarbons, ketones and carboxylic acids, aromatics and esters. There are also secondary cyclic alcohols. Figure 14 shows a comparison of acrylic with IDP Chocha and Wild 2 particle Ada. The spectrum of acrylic is very different from the other two spectra. First, the peaks in the 3000 cm-1 region are shifted in the acrylic toward higher values (2995 and 2950 cm-1), while both in Chocha and Ada these peaks are in similar positions and shifted toward lower values (2917 and 2848 cm-1). Acrylic has a C=C-H stretching that is absent in Ada and Chocha. Acrylic is dominated by CH3 while Ada and Chocha are dominated by CH2 groups (Table 1). Second, the relative heights of these peaks are very different in the acrylic spectrum. Third, Ada, Chocha and acrylic have a peak around 1700 cm-1, but in the acrylic this peak is very narrow and strong comparing to the one found in our samples and its position is slightly shifted to lower values comparing to our samples. Additionally, sample GS lacks a peak at this position (Figure 3), clearly indicating that the presence of this peak in our samples is not related to the acrylic embedding medium. Forth, all the peaks below 1500 cm-1 in the acrylic spectrum are narrower and stronger (more intense) than in Chocha (and they are absent in Ada). Fifth, some peaks in the acrylic spectrum (in the 1000 cm-1 region) are absent in our samples. In general, peaks in the acrylic spectrum are better defined (more net) and narrower and stronger than in the samples we studied. It is clear that the organic material measured in our samples is unambiguously indigenous to the particles and not a contamination from the acrylic embedding medium. The CH2/CH3 band depth ratio could not be calculated because acrylic does not have a CH2 peak at 2920 cm-1.
6 Discussion
The textures and morphologies of the carbonaceous materials we found in our samples are identical to the morphologies found in carbonaceous materials from carbonaceous chondrites (Garvie & Buseck 2004, 2006; Nakamura-Messenger et al. 2006), from interplanetary dust particles (Matrajt et al. 2012) and from other Wild 2 particles (Matrajt et al. 2008; De Gregorio et al. 2010; Matrajt et al. 2013). These carbonaceous materials are organic refractory molecules, given that they survive atmospheric entry or hypervelocity impact into aerogel (Matrajt et al. 2012, 2013). Both IDPs and Wild 2 samples suffered from heating while being decelerated either in the stratosphere or aerogel. The effects of heating on the organics in these type of samples are poorly known. However, past studies have shown that pyrolyzed terrestrial kerogens tend to increase their CH3/CH2 ratios as well as their degree of aromatization (Ehrenfreund et al. 1991). For example, under the effects of heating the Orgueil meteorite decreased its CH3/CH2 ratio. It was suggested that such a decrease means that the -CH3 groups are engaged in thermally labile structures (i.e. bounded to N and/or O). This would cause a faster decomposition of CH3 groups relative to the CH2 groups and would change the CH3/CH2 ratios (Ehrenfreund et al. 1991). It could also be due simply to the general loss of H from these materials during pyrolysis (Jones 2012a). This is, however, not the case for the samples analyzed in our study. Both IDPs and Wild 2 particles contain abundant O and N bonded to their organic materials (Flynn et al. 2003; Matrajt et al. 2005; Sandford et al. 2006; Matrajt et al. 2008; De Gregorio et al. 2010; Matrajt et al. 2012, 2013) indicating that the CH3 groups did not decompose by outgassing of thermally labile structures during deceleration. CH3 groups are simply less abundant in IDPs and Wild 2 samples relative to other astrophysical environments. Therefore, we believe that the CH2/CH3 ratios discussed in the following sections reflect the primary composition of the organic molecules from the parent bodies of our samples.
In the following paragraphs we will discuss the characteristics of the 3.4 m feature of this organic refractory material and we will compare this feature to the one observed in the interstellar medium, meteoritic material from carbonaceous chondrites (CCs), comet Hartley 2 and asteroid Themis. Because infrared spectroscopy is primarily a qualitative analytical technique, these comparisons will remain purely qualitative.
The meteoritic material that has been previously investigated with infrared spectroscopy consists of two different components. First, a general carbonaceous component of the meteorite, which consists of all the carbonaceous materials present in the sample. Second, a residue component, which consists of carbonaceous materials that are water insoluble and are usually termed insoluble organic matter (IOM). This residue is obtained by a series of acid treatments that involve several chemicals including hydrochloric acid (HCl) and hydrofluoric acid (HF). These treatments are designed to concentrate the carbonaceous material by dissolving the silicates (Reynolds et al. 1978; Alexander et al. 1998). The general carbonaceous component was investigated mainly in the Tagish Lake meteorite (Matrajt et al. 2004), whereas the acid residue component was investigated in the Orgueil and Murchison meteorites (Ehrenfreund et al. 1991; de Vries et al. 1993; Flynn et al. 2003, 2010). In the discussion that follows, we will refer to the IOM of Murchison and Orgueil meteorites. However, for Tagish Lake we will refer to Tagish Lake as the general carbonaceous component. This distinction is important given that it was recently demonstrated that exposing organic matter to HF and HCl, alters significantly the organic molecules by increasing the aliphatic CH3/CH2 ratio and changing the aromatic contents (Flynn et al. 2010).
6.1 The 3.4 m band
The C-H stretch region in the IR spectrum is also known as the 3.4 m band. Past observations of several lines of sight of the diffuse interstellar medium (Sandford et al. 1991; Pendleton et al. 1994; Chiar et al. 2000) have shown that this 3.4 m region shows strong similarities with the 3.4 m band of the insoluble organic matter (IOM) of meteorites Orgueil and Murchison (Ehrenfreund et al. 1991; de Vries et al. 1993). One way to directly compare the spectra of the DISM with meteoritic materials, including Wild 2 samples and IDPs, is through the comparison of the CH2/CH3 band depth ratio. The peaks at 2956 cm-1 and 2926 cm-1 correspond to the asymmetric stretching of CH3 and CH2, respectively. These peaks are almost always present in the IR spectra of both the DISM and meteoritic materials. By constructing a linear continuum across the range from about 3000 cm-1 to 2800 cm-1, as it was done by Sandford et al. (1991), we can derive the band depths of these two peaks and then calculate their ratios. This technique has been used extensively in the past for comparison of the DISM to different types of organic materials, whether extraterrestrial (Sandford et al. 1991; Ehrenfreund et al. 1991; de Vries et al. 1993; Flynn et al. 2003; Matrajt et al. 2004, 2005; Keller et al. 2006; Muñoz Caro et al. 2008) or terrestrial analogs (Sandford et al. 1991; Ehrenfreund et al. 1991; Pendleton et al. 1994; Pendleton & Allamandola 2002; Duley et al. 1998). We calculated the ratio for the four samples we analyzed and compared them with the published data of other samples, including CCs, the DISM, comet Hartley 2 and asteroid 24 Themis (Table 2). Given that the carrier of the 3.4 m interstellar absorption band appears to be widespread throughout the Galaxy and is present in several others (Pendleton 1997; Wright et al. 1996; Imanishi & Dudley 2000; Dartois et al. 2004; Dartois 2011; Godard et al. 2012), we used the interstellar CH2/CH3 ratio measured in the past by Sandford et al. (1991), Pendleton et al. (1994) and Pendleton & Allamandola (2002) for the comparison. Another tool that we used for the comparison is the presence of O and N in the organic materials. The organic material of the diffuse interstellar medium is mostly hydrocarbon in nature, having little N or O, with carbon distributed between aromatic and aliphatic molecules and no bands in the 1000-2000 cm-1 region (Pendleton & Allamandola 2002), while the organic refractory material in CCs contains O and N (de Vries et al. 1993; Matrajt et al. 2004).
6.1.1 The 3.4 m feature of Wild 2 particles
Wild 2 particle Febo has carbonaceous morphologies that slightly differ from Wild 2 particle Ada. Although both particles have smooth and globular morphologies (Matrajt et al. 2008), Febo has also dirty and vesicular morphologies which are absent in Ada. Both particles have several similarities in their IR spectra. For example, both particles have the CH3 symmetric stretch (2955 cm-1), the CH2 stretch (2918 and 2847 cm-1) and the C=O stretch (1710 cm-1). They also have C=C aromatic stretching although at different positions (1418 and 1650 cm-1). The main difference is that the CH3 peaks are slightly more pronounced in Febo than in Ada and the CH2 peaks are narrower and stronger in Ada. This indicates that CH2 groups are more dominant in Ada than in Febo and so the aliphatic chains are shorter and/or more branched in particle Febo. These morphological and spectroscopic differences suggest that comet Wild 2 has a heterogeneous composition. The organic carbonaceous materials vary at the track scale (few microns). Similar conclusions were found in past studies related to isotopic compositions of Wild 2 particles where it was found that Wild 2 particles may contain carbonaceous materials with isotopic anomalies adjacent to carbonaceous materials with normal isotopic compositions (Matrajt et al. 2008; De Gregorio et al. 2010, 2011; Nakamura-Messenger et al. 2011; Matrajt et al. 2013). The ratio of the band depth of the CH2/CH3 peaks was calculated for particle Febo (Table 2), and it is 1.96. This ratio is within the range found for IDPs (Flynn et al. 2003; Matrajt et al. 2005), and the ratios measured in other Wild 2 particles (Keller et al. 2006; Sandford et al. 2006; Muñoz Caro et al. 2008, Table 2). The CH2/CH3 ratio of Febo and other Wild 2 samples is slightly larger than the ratios (1-1.5) measured in organic materials from the IOM of CCs (Table 2) and the ratios (0.96-1.25) measured in several lines of sight of the diffuse interstellar medium of our galaxy (Sandford et al. 1991; Pendleton et al. 1994; Chiar et al. 2000). This indicates that the aliphatic molecules responsible of the 3.4 m band are longer and/or less branched in Wild 2 than in the IOM of CCs and the DISM and suggests that the origin of the organic carbonaceous materials in Wild 2 is not the same as in CCs, believed to be interstellar processes such as UV photoirradiation of ices (Muñoz Caro et al. 2008). The ratio of the band depth of the CH2/CH3 peaks was also calculated for particle Ada (Table 2) and it is 4.3. This ratio is within the range found for IDPs (Flynn et al. 2003) but considerably larger than the ratios measured in other Wild 2 particles (Keller et al. 2006; Sandford et al. 2006; Muñoz Caro et al. 2008). This difference is most likely related to the heterogeneity of the organic materials of comet Wild 2. The molecules responsible for the 3.4 m band in particle Ada are clearly different from the molecules making up the 3.4 m band in the IOM of CCs and DISM as the CH2/CH3 ratio is 3-4 times larger, indicating that the chains are longer and less ramified in Ada and, as stated above, that their origin is not interstellar. As it was suggested in previous studies (Sandford et al. 2006), most likely the Wild 2 organics are the result of protosolar nebular processes.
6.1.2 The 3.4 m feature of interplanetary dust particles
Particles GS and Chocha have similar carbonaceous morphologies and these account for the same surface area in both particles (90). However, they are quite different between themselves with respect to their IR spectra (Figures 3 and 7). While GS has small CH peaks, Chocha has stronger and narrower peaks. The positions of the peaks have some similarities between the two IDPs. For example, both particles have CH2 stretching (2920, 2847 cm-1), both samples have a OH stretching (3260 cm-1) indicating the presence of water in their structure. This water might be bonded to carbonates, carboxylic acids or alcohols. Carbonates were observed by TEM in particle GS. Particle Chocha does not have carbonates, therefore water might be part of the structure of its organics inventory (i.e. alcohols, esters, etc). There are also several differences in the positions of the peaks. First, particle Chocha has a very small asymmetric CH3 stretching (2955 cm-1) and the symmetric CH3 stretching (2865 cm-1) is absent. The asymmetric CH2 stretching (2847 cm-1) is present in both particles but in Chocha this is a much narrower and stronger peak. Additional peaks corresponding to CH2 bending and symmetric stretching (1448, 1220 and 1160 cm-1) and to C=O and C=C stretching (1740 and 1654 cm-1) are absent in particle GS but are present in particle Chocha (Table 1). The ratio of the band depth of the CH2/CH3 peaks was calculated for both IDPs (Table 2). The value found for GS is 1.01, within the IDP range (1.0-5.6) found in past studies (Flynn et al. 2003; Matrajt et al. 2005). The value found for Chocha was 4.6, also within the IDP range (Table 2). The aliphatic molecules making the 3.4 m band of Chocha are dominated by CH2 groups, and there is also evidence of OH and C=O groups, indicating that the molecules are made of long chains with OH and C=O groups branched to them. The profile of the IR spectrum of these organics looks quite different from the IOM of CCs and the DISM, suggesting that they did not originate from interstellar processes.
Both IDPs and Wild 2 particles seem to have several similarities in their carbonaceous materials. Morphologically, all 4 samples studied here have globular and smooth morphologies. Although all four particles have CH2 stretching peaks and few CH3 stretching peaks, in general CH2 dominates over CH3. All but GS have C=O carbonyl stretching and C=C aromatic peaks (Table 1). Only the IDP samples show bonded water (broad band at 3250 cm-1). These observations indicate that the organic materials in the parent bodies of IDPs are similar to Wild 2, with a propensity to have long, less ramified aliphatic chains (CH2 dominance), with some carbonyl and aromatic groups attached to them. However, the cometary particles have less hydrated phases (absence of hydrated minerals like carbonates and absence of OH stretching, Table 1) than the IDPs, which might be related to the way they were collected (hypervelocity impact in aerogel).
6.1.3 The meteorite 3.4 m feature
The 3.4 m feature has been studied in several carbonaceous chondrites. Murchison and Orgueil were among the first to be investigated (Ehrenfreund et al. 1991; Flynn et al. 2003, 2010). The Tagish lake meteorite was also investigated (Matrajt et al. 2004). The 3.4 m feature in the IOM of both Murchison and Orgueil are very similar and are also quite similar to the DISM (Ehrenfreund et al. 1991). In these objects and astrophysical environments the CH2 and CH3 peaks are comparable in both their positions, shapes and relative depths, whereas the 3.4 m feature in Tagish lake is dominated by CH2 groups (Matrajt et al. 2004). Also, in Tagish Lake the CH2 peaks are narrower than in the IOM of the other two meteorites and the DISM. The position of the peaks in these three meteorites are similar to the ones found in our samples (Table 3). However, the shape of the peaks in Murchison and Orgueil IOM differ from our samples given that in our samples, specially in Chocha and Ada, the CH2 peaks are much narrower and stronger relative to the CH3 peaks. The 3.4 m band of Tagish Lake has a similar profile than the 3.4 m band in our samples, where CH2 groups dominate over CH3 groups. The ratio CH2/CH3 of the IOM in Murchison has been measured independently by several groups (Ehrenfreund et al. 1991; Flynn et al. 2003). The value measured varies between 1.09 and 1.51. This range is probably related to the heterogeneity in the distribution of organic matter in Murchison (Pizzarello et al. 2004). In general the CH2/CH3 ratios in Wild 2 and IDPs are higher than in the IOM of Murchison and Orgueil (except for particle GS), suggesting that the carrier in these two CCs has more ramifications than the carriers in Wild 2 and IDPs. The 3.4 m band in both Orgueil and Murchison IOM is very similar. However, it is quite different from the Tagish Lake band. This difference might be attributed to the fact that Tagish Lake is an unclassified meteorite (Brown et al. 2000) with 5.8 wt of carbon (Grady et al. 2002), two-three times as much as it is found in Murchison and Orgueil (2 and 3 wt, respectively) (Oró et al. 1971; Kerridge 1985). However, we favor the idea from Flynn et al. (2010) that the acid extraction treatment alters the organic materials and thus this alteration might be the explanation for the differences seen and described above in the 3.4 m band between Tagish Lake and the IOM of Murchison and Orgueil.
6.1.4 The 3.4 m feature in asteroids and comets
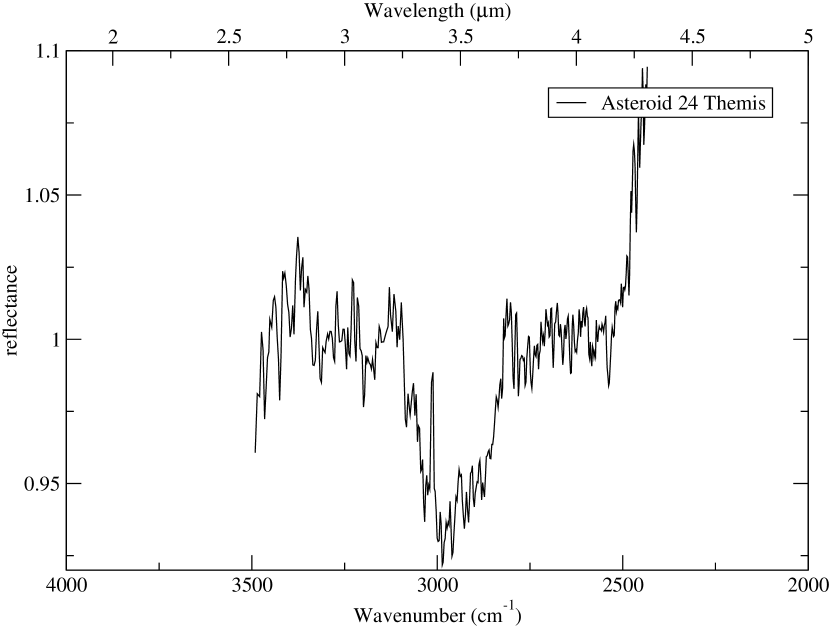
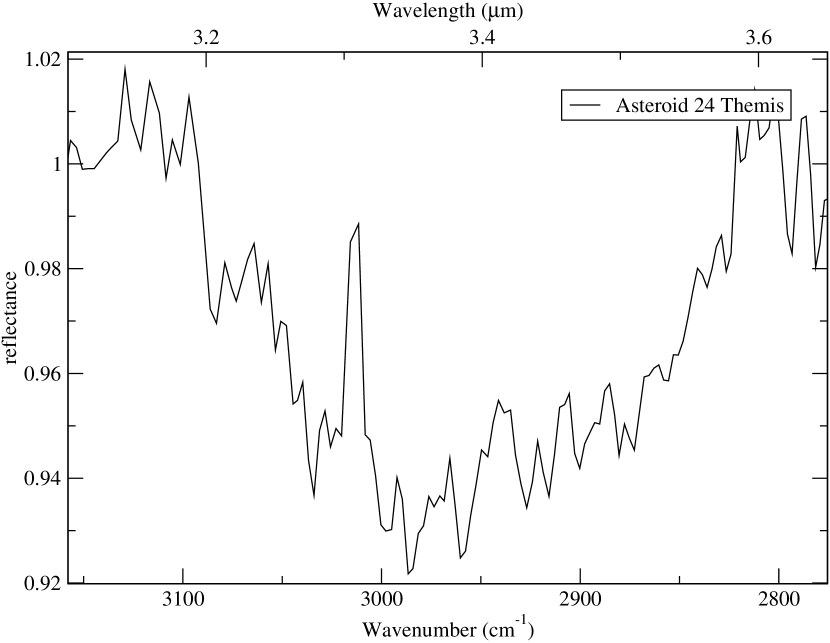
Organics have been detected in asteroid 24 Themis, an object with cometary characteristics (Hsieh & Jewitt 2006) that belongs to the same dynamical family as three of the five known Main Belt Comets (MBCs) (Campins et al. 2010; Rivkin & Emery 2010). The infrared spectrum obtained from these observations has been reproduced with permission from the respective authors in Figure 15. The general shape of the band extending from 2500 to 3500 cm-1 and centered at 3000 cm-1 is quite different from the 3.4 m band of the DISM, IOM of Murchison, Tagish Lake and our samples. The authors attributed this band to fine-grained water ice as a frost deposited on regolith grains. However, the spectral structure between 2700 and 3000 cm-1 cannot be explained by the presence of ice. Therefore, the authors performed simulations by including organics in their models (Campins et al. 2010; Rivkin & Emery 2010). The spectrum we reproduced in Figure 15 is in fact the 24 Themis spectrum ratioed to the water-ice model of Rivkin & Emery (2010). Although the band is quite saturated, many individual peaks can be distinguished (see zoom in Figure 15). They have positions at 2856, 2876, 2915, 2926, 2946, 2958 and 2994 cm-1. Many of these peaks are also found in the DISM and our samples (Table 3) but the overall profile of this spectrum is quite different from meteoritic materials (including our samples) and DISM. The presence of these peaks suggests that aliphatic chains containing CH3 and CH2 groups are present in the 3.4 m band of all these astrophysical environments, but the depth and general shape of these peaks is quite different from the DISM and meteoritic materials indicating that the compounds that make the 3.4 m band in 24 Themis are different from the ones in meteoritic materials and the DISM. For example, the weakness of the peak at 2856 cm-1 (CH2) relative to the peak at 2958 cm-1 (CH3) in the spectra of 24 Themis when compared to similar peaks in the spectra of Ada (Figure 12) or Febo (Figure 10), suggests that Wild 2 is richer in -CH2 groups than 24 Themis. The same comparison between the spectrum of 24 Themis and the IDPs Chocha (Figure 7) and GS (Figure 3) also shows that IDPs are richer in CH2 groups than 24 Themis. Due to over-saturation of peaks in the spectrum of 24 Themis we did not calculate the CH2/CH3 ratio. However, from the general profile of the band in 24 Themis we conclude that the organics in our samples are very different from the organics that make the 3.4 m band in 24 Themis.
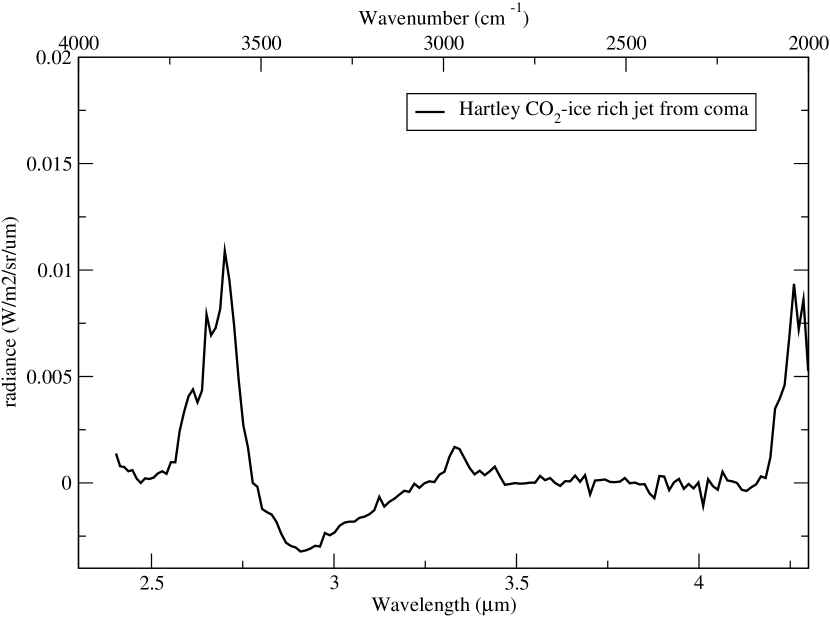
Organics were also detected in comet Hartley 2 (A’Hearn et al. 2011; Wooden et al. 2011). In Figure 16 we have plotted, with permission from the authors, the spectrum obtained with the EPOXI space mission of the coma of comet 103P/Hartley 2 (A’Hearn et al. 2011). This is an ice-rich spectrum obtained from a CO2 jet region of the coma (see Fig. 5 of A’Hearn et al. 2011). From this spectrum we can see 3 major peaks in the 3.4 m region at 3.336 m (2997 cm-1), 3.40 m (2941 cm-1) and 3.44 m (2907 cm-1). The relative depths and shapes of the peaks remain uncertain at this point, because the authors of this spectrum are still optimizing the calibration of the instrument, which will affect the continuum fit and therefore the absolute and relative flux level and shape of all of the features across all wavelengths (L. Feaga, personal communication). Therefore, our discussion will be limited to the peak positions only and no CH2/CH3 ratios will be calculated. Wooden et al. (2011) observed the coma of the comet and also obtained a spectrum, which is currently being processed for molecular methanol deconvolution and subtraction. The general profile of the 3.4 m band with peak positions was communicated to us (Wooden, personal communication) but the CH2/CH3 ratio is not available yet because the optical depths are uncertain until they can properly subtract off the methanol molecular bands from the entire 3.4 m feature. The spectrum they obtained (not shown) contains a broad band centered at 2938 cm-1 and peaks at 2875, 2865, 2847 and 2829 cm-1. The profile of the 3.4 m band of both spectra of comet Hartley 2 looks very different from the 3.4 m band in the DISM, 24 Themis, CCs and our samples, particularly the Wild 2 ones. From the spectrum shown in Figure 16, we can see 3 main peaks at positions that are not found in any of our samples, the DISM and CCs. Only two of those peaks, at 2941 and 2997 cm-1 (Table 3) are also found in another object, asteroid 24 Themis. The third peak at 2906 cm-1 is not found in any of the other objects and astrophysical environments we are comparing to. Comet Hartley 2 seems to be dominated by compounds that absorb at 2940 cm-1 and 2990 cm-1 and whose nature is at present unknown. Similar compounds seem to be present in asteroid 24 Themis (Table 3) but these compounds are absent in meteoritic materials and the DISM (Table 3). As stated above, this comparison is purely qualitative given that the Hartley 2 spectra still need further processing and it may change once the deconvolution of the spectra is fully completed. Nevertheless, if the spectral features between the cometary spectra and our samples are indeed dissimilar, these differences suggest that the carrier of the 3.4 m band in Hartley 2 is very different from the carrier of the 3.4 m band in Wild 2, CCs, and DISM. Of particular interest is to note that two comets have such a different 3.4 m band. While comet Wild 2 is dominated by CH2 groups, comet Hartley 2 has only small CH2 peaks and is dominated by an unknown compound. The non resemblance of the organics in these two comets suggest that there is either more than one way to manufacture organics in cometary regions or that the organics have been subsequently modified in their respective parent bodies. In any case more observations of comets are required to better constraint the nature and origin of the cometary organics responsible of the 3.4 m band.
6.1.5 The 3.4 m feature in the Interstellar Medium
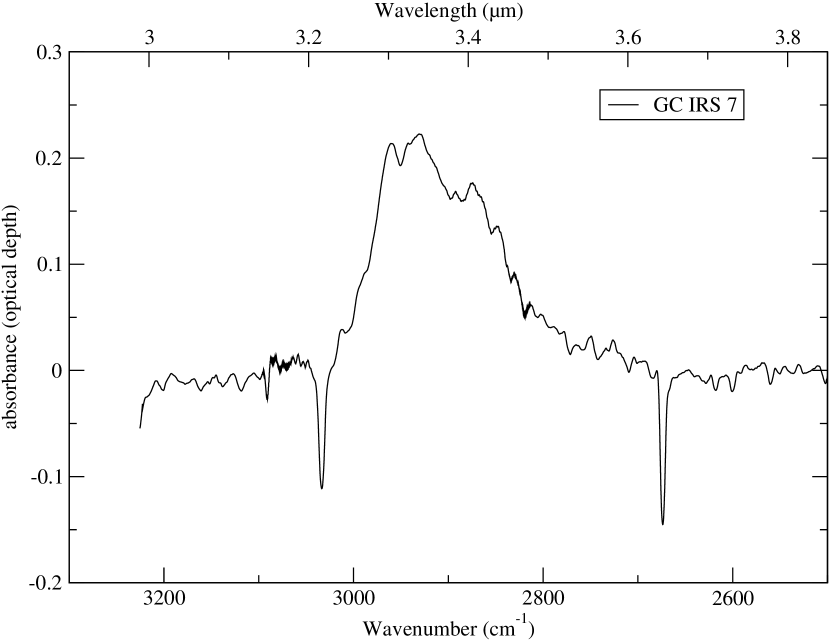
The spectrum of the source IRS 7 of the DISM (Figure 17) was obtained from the Infrared Space Observatory Data Center and was reproduced from Matrajt et al. (2004). This spectrum has several peaks in the 3000 cm-1 region: 3012 cm-1; 2959 cm-1 (CH3 asymmetric stretching); 2928 cm-1 (CH2 asymmetric stretching); 2890 cm-1 (CH3 symmetric stretching); 2872 cm-1 (CH3 symmetric stretching); 2848 cm-1 (CH2 symmetric stretching). The band depth CH2/CH3 ratio was calculated to be between 1.1-1.4 (Sandford et al. 1991; Pendleton et al. 1994; Matrajt et al. 2005). Comparisons of IR spectra obtained from other lines of sight, including some extragalactic ones, have shown that the 3.4 m band has similar profiles (Pendleton 1995; Dartois et al. 2004; Godard et al. 2012). As discussed previously, the general shape of this band is quite different from the 3.4 m band we observe in our samples. Nevertheless, many of these peaks are also found in other objects (Table 3). As stated above for the spectrum of 24 Themis, the presence of all these peaks indicates that aliphatic chains are present as part of the compounds that make up for this band. The dissimilarity in the positions and relative strengths of the various peaks are probably due to differences in the relative abundances of -CH2 and -CH3 groups in the organic molecules of the various objects and astrophysical environments we are comparing. For example, in the interstellar band the peaks corresponding to CH3 symmetric stretching (2890 and 2872 cm-1) are quite distinct whereas in the Wild 2 and IDP samples these are blended together in one unique peak at 2850 cm-1 (Table 3). The strength of the peak at 2959 cm-1 relative to the 2928 cm-1 peak in the interstellar band when compared to the same peaks in our samples suggests that the interstellar carrier is richer in CH3 groups than Wild 2 and IDPs. The CH2 peaks in our samples are stronger and narrower than in the interstellar band. All these observations indicate that the aliphatic carriers in Wild 2 and IDPs are dominated by CH2 groups (so they are mainly linear chains) whereas the carriers in the DISM are dominated by CH3 groups (so they are ramified chains).
6.1.6 The 1700 cm-1 (C=O) band in the DISM, IDPs and Wild 2 samples
The DISM of our galaxy is mainly composed of C and H with very little O given that no strong bands arising from other strong infrared active groups (like the C=O at 1700 cm-1) are seen in the mid-infrared spectra (Dartois et al. 2004). Only the extragalactic (Seyfert 2) NGC 1068 mid-infrared spectrum displays a carbonyl absorption at 1703 cm-1 (Dartois et al. 2004). Most of our samples show a carbonyl peak (Table 3). For example, particles Chocha and Febo have a prominent peak at 1738 and 1727 cm-1, respectively (Figures 18 and 19). Sample Ada has a small peak at 1715 cm-1 (Figure 20). Particle GS does not have a C=O peak. A carbonyl peak has been detected in other IDPs in previous IR studies (Flynn et al. 2003; Matrajt et al. 2005). Furthermore, studies with other analytical techniques, for example X-ray microscopy, have shown that IDPs (Flynn et al. 2003) and Wild 2 samples (Matrajt et al. 2008; De Gregorio et al. 2010, 2011) have a C=O peak associated with the organic materials. The presence of a carbonyl group on most IDPs and Wild 2 and its absence in the DISM of the Galaxy is a further indication that the organic materials in IDPs and Wild 2 are quite different from the interstellar organics, strongly suggesting that they did not originate in the DISM (see next section).
6.2 Comparison of the samples spectra to modeled spectra
Jones (2012a) modified the eRCN and DG models to better constraint and determine the infrared spectral properties of amorphous hydrocarbon grains (also known as hydrogenated amorphous carbons HAC) found in the ISM, as a function of their content in hydrogen atoms (noted XH). In this model, it was found that when the molecules suffer from structural annealing, they lose H atoms and transform from an aliphatic-rich structure to an aromatic-rich structure. This annealing would be UV photon-driven from the radiation field in the ISM environment. However, this annealing would highly depend on the size of the particles being exposed to the radiation and thermal effects (Jones 2012b). In particular, for carbonaceous grains 3 nm in radius the radiation effects are negligible (Jones 2012b) and so their IR spectra remain invariant. It is very interesting to compare our spectra to the spectra predicted by this model, because although our grains are typically 50 nm, the particles suffered from heating effects either during atmospheric entry or during deceleration into aerogel. In addition, the model predicts how the spectra should look as a function of the CH2/CH3 ratios calculated for the carbonaceous materials, because these ratios determine the atomic content of hydrogen (XH) in the molecules.
Using the CH2/CH3 ratios calculated for each of our 4 samples (Table 2) and using the graph of figure 3 from Jones (2012a), we determined the XH for each of our samples. Then, with the corresponding XH we searched for the corresponding spectrum predicted by the model (figures 8-10 from Jones (2012a)) and compared them. Particles Chocha and Ada have a CH2/CH3 equivalent to a XH of 0.53 (meaning the carbonaceous material has a hydrogen atom fraction of 53 ). The predicted spectrum obtained with such hydrogen fraction looks quite similar to our spectra. First, the intensity of the CH3 peak is very small relative to the intensity of the CH2 peak. Second, the spectrum does not seem to have peaks in the 6-6.67 m range (1600-1500 cm-1), typically of CH aromatic moieties. Our spectra do not have peaks in that region either. Third, the predicted spectrum does not have peaks in the 3.28 m region (3050 cm-1) typically of aromatics. Instead the spectrum has a nice little peak at 3.25 m and a nice sharp peak at 3.32 m (3078 and 3010 cm-1, respectively) corresponding to alkene (olefin C=C) groups. Our spectra do not have any type of aromatic or olefin peaks in this region, which makes the biggest difference between the predicted spectrum and our observed spectra. But the overall profile of the 3.4 m band matches up quite well between the predicted spectrum and our observed spectra. We think that the small discrepancies are related to differences in the composition of the carbonaceous materials of our samples. For example, we have determined previously that these carbonaceous materials all contain bonded O and N heteroatoms (Matrajt et al. 2008, 2012). The eRCN and DG models of Jones (2012a) do not take into account the presence of heteroatoms. In addition, the model predicts that aromatics tend to increase as aliphatics decrease under thermal effects but only for particles 10 nm, and as we previously stated, all of our materials are 50 nm. Finally, it is worth noting that this model presents discrepancies even with the ISM spectra, where the CH2/CH3 ratios range between 2-3 (equivalent to 53-55 of H atoms), corresponding to a predicted spectrum with much smaller CH3 than the one observed (Jones 2012a). To obtain a perfect match, one would need to increase the intensity of the CH3 band in order to obtain a good match to the observational data. We also noticed that all our spectra show an overall decrease in the intensity of the CH3 peak relative to the ISM spectra, and we think that this is a fundamental difference between the carbonaceous material of the ISM and our samples.
Regarding the other two samples, Febo and GS, the comparison is actually quite different. The CH2/CH3 ratios of these two particles correspond, respectively, to a XH of 0.55 and 0.58. The predicted spectra obtained with these hydrogen atomic fractions do not match our spectra. They seem to have much more CH2 than our spectra. In addition, the relative intensities of the CH3 and the CH2 peaks are quite different than the ones we observe in our spectra. Finally, the predicted spectrum shows some olefinic peaks that are absent in our spectra. As stated above, we think that some of the discrepancies encountered while doing this comparison are related to the presence of heteroatoms in our samples and the size of the carbonaceous grains.
This model predicts that sp3 C atoms (aliphatics) are transformed into sp2 C atoms (aromatics) as annealing proceeds. This could in principle tells us something about the effects of heating during atmospheric entry and impact into aerogel. However, as discussed above, what we observe is the exact opposite: we do not observe aromatics or olefinic material. Instead, the carbonaceous materials of our samples are dominated by aliphatics. Therefore, we think that, as stated by the model, the annealing effects are valid for a certain size, but because the carbonaceous materials of our samples are nm, we do not observe those effects.
6.3 Is the Origin of the 3.4 m band in IDPs and Wild 2 interstellar?
6.3.1 IDPs
We compared the 3.4 m band in the two IDPs we studied with the 3.4 m band found in IDPs of previous studies (Flynn et al. 2003; Matrajt et al. 2005). We found that our IDPs have a similar profile to most of the IDPs we studied previously in which there is clear dominance of CH2 over CH3, sometimes with CH3 almost nonexistent (for example Chocha in this study and samples L2011-F2, L2036-E19, W7116B-N and W7116B-U2 from Matrajt et al. (2005)). However, this profile is quite different from the 3.4 m band of the DISM, where there is not a marked dominance of CH2 groups over CH3 groups as seen in IDPs. Instead, in the 3.4 m band of the DISM the CH2 and CH3 features are comparable, whereas in all the spectra of the IDPs we studied previously, the CH2 tends to dominate (Flynn et al. 2003; Matrajt et al. 2005). In addition, the band depth ratios CH2/CH3 found for IDPs previously studied ranges from 1.88-3.69 with an average of 2.47 (Matrajt et al. 2005) and from 1.0-5.6 with an average of 2.4 (Flynn et al. 2003). The band depth CH2/CH3 ratio 1.01 found for particle GS (Table 2) is in good agreement with the ratios found previously and it is also within the range of values found for the DISM and for the IOM of CCs (Table 2). However, the profile of the 3.4 m band is quite different from the DISM and the IOM of CCs. Therefore, even if the ratios are similar the profiles are not, which suggests that the organic compounds that make up the 3.4 m band are not related to the DISM and the parent body of GS is not a carbonaceous chondrite parent body. The band depth ratio CH2/CH3 of sample Chocha is 4.6 (Table 2), still in the range previously found for IDPs but about 4 times bigger than the band depth CH2/CH3 ratio found for the DISM (1.1-1.25, Sandford et al. (1991)). Both the ratio and the profile of particle Chocha are considerably different from the DISM and the carbonaceous chondrites IOM, suggesting that the parent body of Chocha is not a CC. The organic material of Chocha has isotopic anomalies indicative of an origin in a cold environment which could be either the ISM or the edges of the protoplanetary disk (Matrajt et al. 2012). Given that the 3.4 m band seems quite different from the DISM as discussed above, we suggest that the origin of the carbonaceous materials in Chocha is not interstellar but in the edges of the protoplanetary disk. The other IDPs we studied here and in the past also show a 3.4 m band with a different profile, although for some of them the CH2/CH3 ratios are similar to the DISM. The average is, however, twice as big as the ratio found for the DISM and IOM of CCs (Table 2). This indicates, as previously observed (Sandford et al. 2006; Muñoz Caro et al. 2008), that the aliphatic molecules in most IDPs are longer (or less branched) than those in the DISM and suggest that they are not similar to the organic materials responsible for the 3.4 m feature in the DISM, which looks more similar to the insoluble organic matter found in Orgueil and Murchison (Table 2). These conclusions are further supported by the presence of O (detected by XANES, Flynn et al. (2003)), the presence of N (detected by XANES, Keller et al. (2004) and by NanoSIMS, Matrajt et al. (2012)) and the presence of the C=O (Table 3, Figure 7) in many of these IDPs. We conclude that the origin of the 3.4 m band in IDPs is not related to interstellar material. We also conclude that the organic materials making up this band are not related to the parent bodies of CCs. Based on all our observations discussed above we conclude that the origin of the 3.4 m band in IDPs is most likely in the outer parts of the solar nebula. These results are in agreement with recent models of the dynamics and evolution of icy grains exposed to UV irradiation and the production of complex organics, which have shown that organic compounds are natural byproducts during the evolution of the protoplanetary disk (Ciesla & Sandford 2012).
6.3.2 Wild 2
We compared the 3.4 m band of our two Wild 2 samples with the 3.4 m band of Wild 2 samples studied in the past (Sandford et al. 2006; Keller et al. 2006; Muñoz Caro et al. 2008) and with the DISM. The profile of the 3.4 m band of both of our Wild 2 samples is quite similar, with little to no CH3 features and a clear dominance of CH2 features with strong, narrow peaks. This profile resembles the profiles of other Wild 2 samples studied in the past (Sandford et al. 2006; Keller et al. 2006; Muñoz Caro et al. 2008). The band depth ratio CH2/CH3 of particle Febo is 1.96. This value is twice as big as the ratio in DISM and IOM of CCs. The band is dominated by CH2 groups. Similarly, the band depth CH2/CH3 ratio of particle Ada (4.3) is much bigger than the ratio found in the DISM and IOM of CCs. The profile of the band is also dominated by CH2 groups. This indicates that the aliphatic organic materials responsible of this band have longer or less branched chains than those in IOM of CCs and the DISM. In addition, we found the presence of the carbonyl group (C=O, Table 3, Figures 19 and 20) and previous studies have established that the organic materials in Wild 2 contain O and N (Sandford et al. 2006; Matrajt et al. 2008; De Gregorio et al. 2010; Matrajt et al. 2013). Muñoz Caro et al. (2008) compared the 3.4 m feature of several Wild 2 samples to ice residues obtained by UV-photoprocessing of interstellar ice analogs and showed that the 3.4 m band in Wild 2 samples is spectroscopically different from the analog organic residues. This indicates that the aliphatic organics that produced the 3.4 m band are not a direct product of interstellar ice photoprocessing. Isotopic compositions obtained from the two Wild 2 particles analyzed in our study (Matrajt et al. 2008) and from other Wild 2 particles (De Gregorio et al. 2010, 2011) showed 15N anomalies indicative of an origin in a cold environment. All these observations and the discussions presented above indicate that the DISM is not a good candidate for the synthesis of the aliphatics that make up the 3.4 m band in Wild 2 samples. Therefore we conclude that, similar to IDPs, the origin of the 3.4 m band in Wild 2 particles is most likely in the outer parts of the solar nebula. Our conclusions are in agreement with previous statements that the Wild 2 organic materials are not the direct result of diffuse ISM processes but rather result from protosolar nebular processes (Sandford et al. 2006).
7 Conclusions
This study showed that both IDPs and Wild 2 samples have a 3.4 m band dominated by CH2 groups, indicating that the organic compounds are predominantly long aliphatic chains with little ramifications. Previous studies showed that all these samples have O and N bonded to their organic materials, suggesting that these ramifications are O and N-rich groups. Most of our samples have the C=O carbonyl features between 1000-2000 cm-1. The comparison of all our samples to the 3.4 m band of the DISM and IOM of carbonaceous chondrites showed that the profile of the bands in Wild 2 and IDPs is quite different from the DISM and CCs because the band is mainly dominated by CH2 groups. In some of our samples the CH3 groups are absent while in the DISM and IOM of CCs the CH3 groups are of comparable abundance with the CH2 groups. This indicates that our samples are richer in CH2 than the DISM. All these observations suggest that the organic component in Wild 2 and IDPs does not have an interstellar origin. We conclude that the organic compounds in both IDPs and Wild 2 were formed at the edges of the protoplanetary disk through nebular processes. It is possible, however, that a pristine interstellar component lies underneath a more complex organic material that formed during solar nebula processing or later in the parent body of Wild 2 and IDPs. We favor, however, the scenario in which the organic materials in both Wild 2 samples and IDPs originated at the edges of the protoplanetary disk.
8 Acknowledgments
We are grateful to H. Campins and colleagues and to A. Rivkin and collaborators for having shared with us their 24 Themis spectra. We are also grateful to M. AHearn and collaborators and to D. Wooden for having shared their spectra of comet Hartley 2. We also thank H. Bechtel for his assistance. We would like to thank Anthony Jones, whose review and comments very much improved this article. This work is dedicated to the memory of Carl Sagan (1934-1996) who greatly inspired G.M throughout her career. G. M was funded by NASA grants NNX10AI89GS01 and NNG06GG00GS05.
Facilities: University of Washington, Brookhaven National Lab., Lawrence Berkeley National Lab.

| Peak position (in cm-1 ) | Vibration mode | Interpretation | sample that has it |
|---|---|---|---|
| 3255, 3270 | OH | water | GS, Chocha |
| 2990 | C=C-H | - | acrylic |
| 2951,2954,2950,2949,2958 | CH3 asymmetric stretching | aliphatic hydrocarbons | GS, Chocha, Febo, Ada, Acryic, DISM |
| 2920, 2918, 2929, 2925, 2922 | CH2 asymmetric stretching | aliphatic hydrocarbons | GS, Chocha, Febo, Ada, DISM |
| 2896, 2870, 2860, 2874 | CH3 symmetric stretching | aliphatic hydrocarbons | GS, Febo, DISM |
| 2845, 2847, 2855 | CH2 symmetric stretching | aliphatic hydrocarbons | GS, Chocha, Febo, Ada, DISM |
| 2160 | C=C stretching | - | Ada |
| 1740 | C=O carbonyl | esters | Chocha |
| 1730, 1717, 1700, 1714, 1727 | C=O carbonyl | ketone, carboxylic acid | Febo, Ada, acrylic |
| 1685 | H-O-H | water | Febo |
| 1654, 1650 | C=C stretching | aromatics | Chocha, Febo, Ada, acrylic |
| 1545-1455 | CO3- | carbonates | GS |
| 1480 | CH3 asymmetric bending | aliphatic hydrocarbons | Chocha, acrylic |
| 1447-1448 | CH2 asymmetric bending | aliphatic hydrocarbons | Chocha, acrylic |
| 1418, 1435 | C=C stretching | aromatics | Chocha, Febo, Ada, acrylic |
| 1350, 1386 | CH3 symmetric bending | aliphatic hydrocarbons | acrylic |
| 1240, 1270 | C-O-C | esters | acrylic |
| 1220 | CH2 symmetric bending | aliphatic hydrocarbons | Chocha |
| 1147, 1190 | unknown | - | - |
| 1160 | CH2 twisting | aliphatic hydrocarbons | Chocha |
| 1065 | C-OH | secondary cyclic alcohols | acrylic |
| 987, 970, 910 | CH=CH bending | - | acrylic |
| 1070, 1060, 952 | Si-O | pyroxene | GS, Febo |
| 1216, 1136, 1106, 1010, 930 | Si-O | silicates | Febo, Ada |
| 880 | Si-O | olivine | Febo |
| Object/sample | CH2/CH3 | Reference |
|---|---|---|
| DISM (GC IRS7) | 0.96-1.25 | (Sandford et al. 1991) |
| DISM (GC IRS7) | 0.92-1.2 average 1.06 | (Pendleton et al. 1994) |
| Extragalactic ISM (Seyfert 2) | 2.0 | (Dartois et al. 2004) |
| Tagish Lake | 4.36 | (Matrajt et al. 2004) |
| IDPs | 1.0-5.6 average 2.4 | (Flynn et al. 2003) |
| IDPs | 1.88-3.69 average 2.47 | (Matrajt et al. 2005) |
| Wild 2 samples | 1.7-2.8 average 2.15 aerogel 2.15 | (Muñoz Caro et al. 2008) |
| Wild 2 samples | 2.5 | (Keller et al. 2006; Sandford et al. 2006) |
| IOM Murchison | 1.5 | (Ehrenfreund et al. 1991) |
| IOM Murchsion | 1.09 | (Flynn et al. 2003) |
| IOM Orgueil | 1-1.51 | (Ehrenfreund et al. 1991) |
| ultracarbonaceous IDP Chocha | 4.6 | this study |
| ultracarbonaceous IDP GS | 1.01 | this study |
| Wild 2 Febo | 1.96 | this study |
| Wild 2 Ada | 4.3 | this study |
| Comet 103P/Hartley 2 (coma) | no CH3 or CH2 bands so no ratio calculated | (A’Hearn et al. 2011; Wooden et al. 2011) |
| Asteroid 24 Themis | not calculated | (Campins et al. 2010; Rivkin & Emery 2010) |
| Peak (cm-1) | GS | Chocha | Febo | Ada | DISM | Seyfert 2 | IOM Murchison | IOM Orgueil | Tagish Lake | 24 Themis | Hartley 2 |
|---|---|---|---|---|---|---|---|---|---|---|---|
| 3250-2670 (OH) | yes | yes | no | no | no | - | yes | yes | yes | yes | - |
| 2950-2955 (CH3) | yes | yes | yes | yes | yes | yes | yes | yes | yes | yes | yes |
| 2918-2925 (CH2) | yes | yes | yes | yes | yes | yes | yes | yes | yes | yes | no |
| 2865-2896 (CH3) | yes | no | no | no | blended | yes | yes | yes | yes | yes | yes |
| 2845-2855 (CH2) | yes | yes | yes | yes | blended | no | no | no | yes | yes | yes |
| 1700 (C=O) | no | yes | yes | yes | no | yes | yes | - | no | - | - |
References
- A’Hearn et al. (2011) A’Hearn, M. F., Belton, M. J. S., Delamere, W. A., et al. 2011, Science, 332, 1396
- Aleon et al. (2003) Aleon, J., Robert, F., Chaussidon, M., & Marty, B. 2003, Geochim. Cosmochim. Acta, 67, 3773
- Alexander et al. (1998) Alexander, C. M. O. ., Russell, S., Arden, J., et al. 1998, Meteorit. Planet. Sci., 33, 603
- Bajt et al. (2009) Bajt, S., Sandford, S. A., Flynn, G. J., et al. 2009, Meteoritics and Planetary Science, 44, 471
- Brown et al. (2000) Brown, P. G., Hildebrand, A. R., Zolensky, M. E., et al. 2000, Science, 290, 320
- Brownlee et al. (2006) Brownlee, D., Tsou, P., Aléon, J., et al. 2006, Science, 314, 1711
- Brownlee et al. (1976) Brownlee, D. E., Ferry, G. V., & Tomandl, D. 1976, Science, 191, 1270
- Campins et al. (2010) Campins, H., Hargrove, K., Pinilla-Alonso, N., et al. 2010, Nature, 464, 1320
- Chiar et al. (2000) Chiar, J. E., Tielens, A. G. G. M., Whittet, D. C. B., et al. 2000, ApJ, 537, 749
- Ciesla & Sandford (2012) Ciesla, F. J., & Sandford, S. A. 2012, Science, 336, 452
- Clemett et al. (1993) Clemett, S., Maechling, C., Zare, R., Swan, P., & Walker, R. 1993, Science, 262, 721
- Clemett et al. (2010) Clemett, S. J., Sandford, S. A., Nakamura-Messenger, K., Hörz, F., & McKay, D. S. 2010, Meteoritics and Planetary Science, 45, 701
- Cody et al. (2011) Cody, G. D., Heying, E., O’D. Alexander, C. M., et al. 2011, Proceedings of the National Academy of Sciences, 108, 19171 –19176
- Cody et al. (2008) Cody, G. D., Ade, H., O’D. Alexander, C. M., et al. 2008, Meteoritics and Planetary Science, 43, 353
- Dartois (2011) Dartois, E. 2011, in EAS Publications Series, Vol. 46, EAS Publications Series, ed. C. Joblin & A. G. G. M. Tielens, 381–391
- Dartois et al. (2004) Dartois, E., Marco, O., Muñoz-Caro, G., et al. 2004, A&A, 423, 549
- De Gregorio et al. (2011) De Gregorio, B. T., Stroud, R. M., Cody, G. D., et al. 2011, Meteoritics and Planetary Science, 46, 1376
- De Gregorio et al. (2010) De Gregorio, B. T., Stroud, R. M., Nittler, L. R., et al. 2010, Geochim. Cosmochim. Acta, 74, 4454
- de Vries et al. (1993) de Vries, M. S., Reihs, K., Wendt, H. R., et al. 1993, Geochim. Cosmochim. Acta, 57, 933
- Duley et al. (1998) Duley, W. W., Scott, A. D., Seahra, S., & Dadswell, G. 1998, ApJ, 503, L183
- Ehrenfreund et al. (1991) Ehrenfreund, P., Robert, F., D’Hendencourt, L., & Behar, F. 1991, AA, 252, 712
- Floss et al. (2006) Floss, C., Stadermann, F. J., Bradley, J. P., et al. 2006, Geochim. Cosmochim. Acta, 70, 2371
- Flynn et al. (2003) Flynn, G. J., Keller, L. P., Feser, M., Wirick, S., & Jacobsen, C. 2003, Geochim. Cosmochim. Acta, 67, 4791
- Flynn et al. (2010) Flynn, G. J., Wirick, S., Keller, L. P., & Jacobsen, C. 2010, LPI Contributions, 1538, 5162
- Gallien et al. (2008) Gallien, J.-P., Khodja, H., Herzog, G. F., et al. 2008, Meteoritics and Planetary Science, 43, 335
- Garvie & Buseck (2004) Garvie, L. A. J., & Buseck, P. R. 2004, Earth and Planetary Science Letters, 224, 431
- Garvie & Buseck (2006) —. 2006, Meteoritics and Planetary Science, 41, 633
- Godard et al. (2012) Godard, M., Geballe, T. R., Dartois, E., & Muñoz Caro, G. M. 2012, A&A, 537, A27
- Grady et al. (2002) Grady, M. M., Verchovsky, A. B., Franchi, I. A., Wright, I. P., & Pillinger, C. T. 2002, Meteoritics and Planetary Science, 37, 713
- Hsieh & Jewitt (2006) Hsieh, H. H., & Jewitt, D. 2006, Science, 312, 561
- Imanishi & Dudley (2000) Imanishi, M., & Dudley, C. C. 2000, ApJ, 545, 701
- Jones (2012a) Jones, A. P. 2012a, A&A, 540, A1
- Jones (2012b) —. 2012b, A&A, 542, A98
- Keller et al. (2004) Keller, L. P., Messenger, S., Flynn, G. J., et al. 2004, Geochim. Cosmochim. Acta, 68, 2577
- Keller et al. (2006) Keller, L. P., Bajt, S., Baratta, G. A., et al. 2006, Science, 314, 1728
- Kerridge (1985) Kerridge, J. F. 1985, Geochim. Cosmochim. Acta, 49, 1707
- Matrajt et al. (2004) Matrajt, G., Borg, J., Raynal, P., et al. 2004, A&A, 416, 983
- Matrajt & Brownlee (2006) Matrajt, G., & Brownlee, D. 2006, Meteoritics and Planetary Science, 41, 1715
- Matrajt et al. (2012) Matrajt, G., Messenger, S., Brownlee, D., & Joswiak, D. 2012, Meteoritics and Planetary Science, 47, 525
- Matrajt et al. (2013) —. 2013, submitted to Geochim. Cosmochim. Acta
- Matrajt et al. (2005) Matrajt, G., Muñoz Caro, G. M., Dartois, E., et al. 2005, A&A, 433, 979
- Matrajt et al. (2008) Matrajt, G., Ito, M., Wirick, S., et al. 2008, Meteoritics and Planetary Science, 43, 315
- Messenger (2000) Messenger, S. 2000, Nature, 404, 968
- Messenger (2002) —. 2002, Meteoritics and Planetary Science, 37, 1491
- Muñoz Caro et al. (2008) Muñoz Caro, G. M., Dartois, E., & Nakamura-Messenger, K. 2008, A&A, 485, 743
- Muñoz Caro et al. (2006) Muñoz Caro, G. M., Matrajt, G., Dartois, E., et al. 2006, A&A, 459, 147
- Nakamura et al. (2008) Nakamura, T., Noguchi, T., Tsuchiyama, A., et al. 2008, Science, 321, 1664
- Nakamura-Messenger et al. (2011) Nakamura-Messenger, K., Keller, L. P., Clemett, S. J., Messenger, S., & Ito, M. 2011, Meteoritics and Planetary Science, 46, 1033
- Nakamura-Messenger et al. (2006) Nakamura-Messenger, K., Messenger, S., Keller, L. P., Clemett, S. J., & Zolensky, M. E. 2006, Science, 314, 1439
- Oró et al. (1971) Oró, J., Gibert, J., Lichtenstein, H., Wikstrom, S., & Flory, D. A. 1971, Nature, 230, 105
- Pendleton (1995) Pendleton, Y. J. 1995, Planet. Space Sci., 43, 1359
- Pendleton (1997) —. 1997, Origins of Life and Evolution of the Biosphere, 27, 53
- Pendleton & Allamandola (2002) Pendleton, Y. J., & Allamandola, L. J. 2002, ApJS, 138, 75
- Pendleton et al. (1994) Pendleton, Y. J., Sandford, S. A., Allamandola, L. J., Tielens, A. G. G. M., & Sellgren, K. 1994, ApJ, 437, 683
- Pizzarello et al. (2004) Pizzarello, S., Huang, Y., & Fuller, M. 2004, Geochim. Cosmochim. Acta, 68, 4963
- Reynolds et al. (1978) Reynolds, J. H., Frick, U., Neil, J. M., & Phinney, D. L. 1978, Geochim. Cosmochim. Acta, 42, 1775
- Rivkin & Emery (2010) Rivkin, A. S., & Emery, J. P. 2010, Nature, 464, 1322
- Sandford (1987) Sandford, S. A. 1987, Fund. Cosmic Phys., 12, 1
- Sandford et al. (1991) Sandford, S. A., Allamandola, L. J., Tielens, A. G. G. M., et al. 1991, ApJ., 371, 607
- Sandford et al. (2006) Sandford, S. A., Aléon, J., Alexander, C. M. O. D., et al. 2006, Science, 314, 1720
- Schramm et al. (1989) Schramm, L. S., Brownlee, D. E., & Wheelock, M. M. 1989, Meteoritics, 24, 99
- Simon et al. (2008) Simon, S. B., Joswiak, D. J., Ishii, H. A., et al. 2008, Meteoritics and Planetary Science, 43, 1861
- Stadermann & Floss (2008) Stadermann, F. J., & Floss, C. 2008, in Lunar and Planetary Inst. Technical Report, Vol. 39, Lunar and Planetary Institute Science Conference Abstracts, 1889
- Thomas et al. (1993) Thomas, K. L., Blanford, G. E., Keller, L. P., Klock, W., & McKay, D. S. 1993, Geochim. Cosmochim. Acta, 57, 1551
- Wirick et al. (2009) Wirick, S., Flynn, G. J., Keller, L. P., et al. 2009, Meteoritics and Planetary Science, 44, 1611
- Wooden et al. (2011) Wooden, D. H., Woodward, C. E., Kelley, M. S., et al. 2011, in EPSC-DPS Joint Meeting 2011, 1557
- Wopenka et al. (2008) Wopenka, B., Matrajt, G., Bajt, S., Joswiak, D. J., & Brownlee, D. E. 2008, in Lunar and Planetary Inst. Technical Report, Vol. 39, Lunar and Planetary Institute Science Conference Abstracts, 1827
- Wright et al. (1996) Wright, G. S., Bridger, A., Geballe, T. R., & Pendleton, Y. 1996, in Astrophysics and Space Science Library, Vol. 209, New Extragalactic Perspectives in the New South Africa, ed. D. L. Block & J. M. Greenberg, 143