Thermodynamic Analysis Using First-Principles Calculations of Phases and Structures of
Abstract
, which has a spinel framework structure, is a promising candidate for the cathode material of next-generation lithium-ion batteries with high energy density. We investigate the structural transition in () through first-principles calculations using the projector augmented wave method with the generalized gradient approximation. We calculate all the unique Li-site occupation configurations in a unit cell to obtain the total energies and the most stable structures for various compositions. Thermodynamic analysis shows that with is the only stable phase for . The decomposition energy is lower than 0.1 eV for , but is distinctly higher for . The decomposition energy reaches 0.39 eV at . The ratios of the structures at room temperature are calculated from Boltzmann factors by using the energy differences between structures. The crystal structure of the unit cell changes gradually from to , but changes markedly from to . This first-principles study provides a general evaluation of the variation in the crystal structure with the composition of the bulk material, which affects the cyclability of the electrode.
pacs:
61.50.Ah, 64.60.-i, 64.70.qd, 71.15.NcI Introduction
the high energy density of lithium-ion batteries makes them particularly suitable energy storage devices for the many new portable electronic devices that are coming onto the market. is widely used as a cathode material for lithium-ion batteries, because it has a voltage of up to 4 V versus metallic lithium Mizushima et al. (1980). Voltage is a fundamental property of batteries; higher voltages are closely related to larger electrical energy capacities and faster electronic performance in processing units. Recently, several transition-metal-doped spinel cathode materials with voltages of 5 V, such as (M = Ni, Cr, Co, Fe, Cu), have been reported Koksbang et al. (1996); Xu and Meng (2010); Churikov and Sycheva (2011); Cho et al. (2011). is a particularly promising material because of its high voltage, electrochemical stability, and lack of trace metal impurities Zhong (1997); Fang et al. (2006). Furthermore, materials such as Wu et al. (2011); Cho et al. (2011), Karan et al. (2009), and Son and Cairns (2007) are based on . The physical and chemical properties of have been experimentally determined by X-ray diffraction, scanning electron microscopy, infrared-Raman spectroscopy, electron diffraction, and cyclic voltammetry Ariyoshi et al. (2004); Mat et al. (2006); Xia et al. (2007). Although the crystallographic and electrochemical properties of have been well reported, the microscopic changes in the crystal structure and electrochemical properties during the lithiation and delithiation of an crystal are not yet fully understood. Charging and discharging are primary functions of secondary batteries; therefore, the change in the composition and structure of electrodes is unavoidable, and the changes influence cyclability. Predicting these structural changes will help to accelerate the development of electrode materials.
Theoretical and microstructural analysis can provide a valuable alternative to experimental studies for understanding the properties of materials. First-principles calculation based on density functional theory (DFT) is among the most powerful methods for determining the fundamental characteristics of electrodes. The theoretical band structures and crystal structures of various Li-transition metal oxides, including Aydinol et al. (1997a); Koyama et al. (2003a) and Koyama et al. (2003b), have been thoroughly investigated. Several studies using theoretical calculations and basic thermodynamic models have shown that the average electrochemical potential of is derived from the difference in total energy between the fully lithiated and delithiated materials Aydinol et al. (1997b, a); Yi et al. (2008). However, a method has not yet been established for evaluating the changes in crystal structure and electrochemical potential with varying Li composition. To analyze the properties of crystals at intermediate compositions quantitatively, we investigated the sublattice structures of Li and used DFT to evaluate their thermodynamic stability at various compositions between and . We propose a method for predicting the average electrochemical potential as well as the change in electrochemical potential as the composition of the bulk material is varied. This information is useful for designing new electrode materials, because the electrochemical potential and cyclability of an electrode material is strongly affected by the change in the atomic structure during lithiation and delithiation.
II Computational Procedure
II.1 Crystal Structure
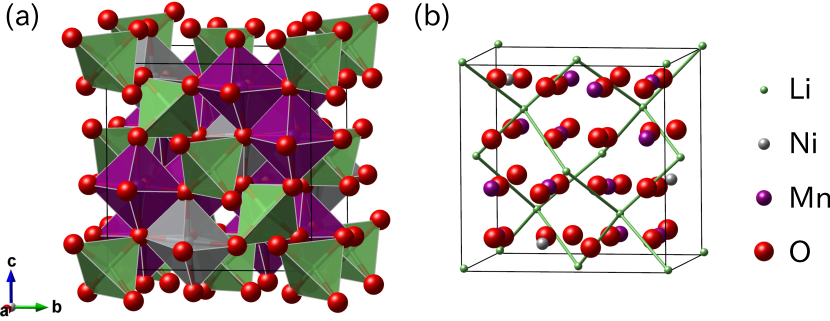
The starting structure for our study was a unit cell of crystal (Fig. 1). The cell belongs to the space group and consists of 8 formula units containing 56 atoms in total: Ariyoshi et al. (2004). The O atoms are located at the 8(c) and 24(e) sites, and form a distorted face-centered cubic (fcc) structure in the cell. Cations occupy the ordered polyhedral sites formed by the O sublattice; the Li, Ni, and Mn atoms are present in the octahedral 8(c) sites, 4(b) sites, and 12(d) sites, respectively. The Li sublattice forms a slightly distorted diamond structure. The eight Li sites in the unit cell were labeled as shown in Table 1. The initial cells for geometry optimization at various compositions were made by removing () Li atoms from the cell, resulting in a cell. The Li sites are symmetrically equivalent in the space group. Therefore, for , and , the unit cell crystal structure is the same. For , the configurations of the occupied and unoccupied Li sites were considered. We calculated all the unique configurations in the symmetry operations of its space group (Table 2). The geometry of each cell was optimized to obtain the most stable lattice volume, shape, and atomic coordinates; the total energies of the cells were computed at the same time. We examined differences in energy of the various structures. The change in Gibbs energy is expressed by However, was of the order of 0.04-4 (eV/cell), was of the order of (eV/cell), and was of the order of the thermal energy in this study Aydinol and Ceder (1997); Aydinol et al. (1997a); Courtney et al. (1998). Because the and terms have little effect on , the assumption that can be approximated by only the change in the internal energy, , is valid.
| axis | L000 | L220 | L111 | L331 | L202 | L022 | L313 | L133 |
|---|---|---|---|---|---|---|---|---|
| 0 | 0.5 | 0.25 | 0.75 | 0.5 | 0 | 0.75 | 0.25 | |
| 0 | 0.5 | 0.25 | 0.75 | 0 | 0.5 | 0.25 | 0.75 | |
| 0 | 0 | 0.25 | 0.25 | 0.5 | 0.5 | 0.75 | 0.75 |
| structure | L000 | L220 | L111 | L331 | L202 | L022 | L313 | L133 | |
|---|---|---|---|---|---|---|---|---|---|
| 0 | A | – | – | – | – | – | – | – | – |
| 1 | B | – | – | – | – | – | – | – | |
| 2 | C | – | – | – | – | – | – | ||
| 2 | D | – | – | – | – | – | – | ||
| 2 | E | – | – | – | – | – | – | ||
| 3 | F | – | – | – | – | – | |||
| 3 | G | – | – | – | – | – | |||
| 3 | H | – | – | – | – | – | |||
| 4 | I | – | – | – | – | ||||
| 4 | J | – | – | – | – | ||||
| 4 | K | – | – | – | – | ||||
| 4 | L | – | – | – | – | ||||
| 4 | M | – | – | – | – | ||||
| 4 | N | – | – | – | – | ||||
| 4 | O | – | – | – | – | ||||
| 5 | P | – | – | – | |||||
| 5 | Q | – | – | – | |||||
| 5 | R | – | – | – | |||||
| 6 | S | – | – | ||||||
| 6 | T | – | – | ||||||
| 6 | U | – | – | ||||||
| 7 | V | – | |||||||
| 8 | W |
II.2 Thermodynamic analysis of phases
The ratio of structures at equilibrium was determined for a total Li content in the bulk of . The lithiated and delithiated material was assumed to be , where was . Because this is a pseudo-unitary system of Li, we examine Li content only. For compositions of , and in , the decomposition reaction is
| (1) |
The decomposition energy of this reaction, , is
where is the Gibbs energy of the most stable structure at composition . Positive values of indicate that the left side of Eq. (1) is thermodynamically unstable, whereas negative values indicate that it is stable. gives the ratio of the equilibrium amounts of species on each side of Eq. (1) by using the Boltzmann factor,
| (2) |
where and are the ratios of both edges in Eq. (1) in the bulk, is the Boltzmann constant, and is the temperature. was assumed to be room temperature, 298 K. The sum of the ratios of all states at a given a given value of must be 1:
| (3) |
The composition was treated as a discrete value. Each ratio of the decomposed state in the bulk, and , was calculated by solving simultaneous equations 2 and 3. Then, each ratio, , was derived from
| (7) |
Assuming that ideal monovalent cations are the only charge carriers, the average electrochemical potential versus between of , , is given by
| (8) |
where is the Faraday constant, and is the chemical potential of Li in a metallic Li anode Aydinol and Ceder (1997); Aydinol et al. (1997a); Chevrier et al. (2010).
II.3 Computational conditions
The spin-polarized calculations were performed by DFT Hohenberg and Kohn (1964); Kohn and Sham (1965) using the plane-wave projector augmented-wave method Blöchl (1994) as implemented in the VASP code. Kresse and Hafner (1993); Kresse and Furthmüller (1996); Kresse and Joubert (1999) The exchange-correlation term was treated with the Perdew-Burke-Ernzerhof functional Perdew et al. (1996). For the unit cell of , a cutoff energy of 500 eV and a -mesh of were determined through preliminary test calculations. A cutoff energy of 500 eV and a -mesh of were calculated for Li metal in a primitive cell with body-centered cubic structure. Geometry optimization was truncated when the residual forces on the atoms became less than 0.02 eV/Å.
III Results and discussion
III.1 Thermodynamic stability and phase transition
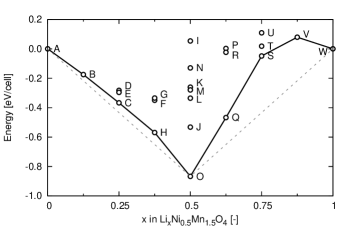
Fig. 2 shows the calculated energies of all the structures after geometry optimization. For clarity, the values of energies shown on the vertical axis, , were corrected with linearly approximated chemical potential of Li, :
| (9) | |||||
| (10) |
The line connecting the energies of the most stable structures for neighboring compositions was concave except for the area around (Fig. 2). This indicates that only one composition, , was thermodynamically stable, except for the end member compositions, and . The Li sublattice in the cell labeled O forms an fcc-like structure. The fcc structure has high symmetry and uniform distance between atoms. The electrostatic repulsion between ions makes it preferable for them to be positioned as far apart as possible. Thus, the high stability of the cell is reasonable. In the region , the energy profile was concave, suggesting that should decompose to and at 0 K. However, the decomposition energy, , was less than 0.1 eV. This slight instability would produce the structures labeled B, C, and H at intermediate compositions through the thermal effect, even at room temperature. The most stable structure changes were A, B, C, H, and O for compositions varying from to . Table 2 shows that the change in the most stable structure between neighboring compositions can be represented by replacing occupied Li sites with unoccupied sites, or unoccupied sites with occupied sites. For example, the only difference between structures H and O is at the L022 site. This simple mechanism would result in smooth changes in the atomic structure as the composition changes and may contribute to good cyclability. In contrast, the decomposition energy, , was high in the region . In particular, was 0.39 eV for structure S. The bulk material should be a mixture of two separate phases, namely, structures O and W. Therefore, the crystal structure of the unit cell changed considerably in this region. The cells that transformed from to were stressed by the volume change, which was estimated to be about 4%.
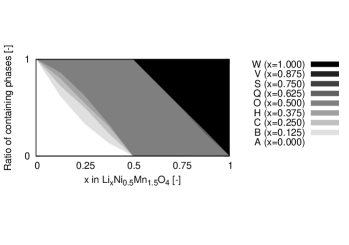
The most stable structures, which are on the solid line in Fig. 2, are dominant at certain concentrations because of the Boltzmann factor. Therefore, we can assume that they are the only structures in the bulk material. We used the energies in Fig. 2 and Eq. 7 to calculate the ratio of structures in bulk at 298 K (Fig. 3). This figure shows that the unit cell structure changed gradually via intermediate concentrations when the total Li content was varied from to , whereas the structure changed markedly from to . These results suggest that it would be difficult to detect a difference in the internal structure of () by experimental methods. The cyclability of an electrode is expected to depend on how smoothly its crystal structure changes. Therefore, it is valuable to describe the change in structure quantitatively as in Fig. 3 in order to predict the durability of new electrode materials.
III.2 Electrochemical potential
There were three thermodynamically stable compositions, where , and . The electrochemical potential in the region and was calculated by using Eq. (8). Fig. 4 shows the variation of the electrochemical potential with the total Li content in a bulk electrode. The calculated values of 3.99 and 3.56 V were lower than the experimental values of 4.739 and 4.718 V Ariyoshi et al. (2004). However, first-principles calculations using the generalized gradient approximation typically give underestimates Aydinol et al. (1997a), and the calculated and experimental results showed good agreement. The total change in the theoretical electrochemical potentials for compositions of was calculated as 0.43 V. The changes in the electrochemical potential shown in Fig. 4 correspond to the changes in the slope of the dotted line in Fig. 2 because the electrochemical potential is reflected in of the material. The small change in electrochemical potential resulted from being only slightly stable, that is, having slightly negative decomposition energy. the small stability of . If there were no stable phase in intermediate composition of , the material would theoretically have constant electrochemical potential. However, during lithiation and delithiation, an intermediate composition that is highly unstable results in a sharp change in atomic structure, which is an obstacle to good cyclability.

IV Conclusion
In summary, first-principles calculations revealed the microscopic structure and stability of , which is among the most promising materials for lithium-ion battery cathodes. We quantitatively evaluated the energies of all the configurations of Li-site occupation for intermediate compositions of (). In this way, we assessed the thermodynamic stability of each structure and the change in the electrochemical potential with varying total Li content in the bulk. () was the only stable phase for . The decomposition energy was lower than 0.1 eV for , but was high for . The thermodynamic analysis showed that the change in structure with varying Li content was gradual for low Li content compositions, and rapid for high Li content compositions. The theoretical change in electrochemical potential at was found to be 0.43 V, which reflects having lower stability than and . We have demonstrated that theoretical calculations can reveal precise changes in structure, phase, and electrochemical potential and can explain the cyclability of electrode materials. In particular, visualizing the change in the crystal structure as shown in Fig. 3 will be particularly valuable for discovering durable electrode materials.
Acknowledgements.
We thank Dr. K. Ariyoshi for fruitful discussion.References
- Mizushima et al. (1980) K. Mizushima, P. Jones, P. Wiseman, and J. Goodenough, Materials Research Bulletin 15, 783 (1980).
- Koksbang et al. (1996) R. Koksbang, J. Barker, H. Shi, and M. Saïdi, Solid State Ionics 84, 1 (1996).
- Xu and Meng (2010) B. Xu and S. Meng, Journal of Power Sources 195, 4971 (2010).
- Churikov and Sycheva (2011) A. Churikov and V. Sycheva, Russian Journal of Electrochemistry 47, 1117 (2011).
- Cho et al. (2011) Y. Cho, S. Lee, Y. Lee, T. Hong, and J. Cho, Advanced Energy Materials 1, 821 (2011).
- Zhong (1997) Q. Zhong, Journal Of The Electrochemical Society 144, 205 (1997).
- Fang et al. (2006) H.-s. Fang, Z.-x. Wang, X.-h. Li, H.-j. Guo, and W.-j. Peng, Journal of Power Sources 153, 174 (2006).
- Wu et al. (2011) L. Wu, K.-W. Nam, X. Wang, Y. Zhou, J.-C. Zheng, X.-Q. Yang, and Y. Zhu, Chemistry of Materials 23, 3953 (2011).
- Karan et al. (2009) N. K. Karan, D. P. Abraham, M. Balasubramanian, M. M. Furczon, R. Thomas, and R. S. Katiyar, Journal of The Electrochemical Society 156, A553 (2009).
- Son and Cairns (2007) J.-t. Son and E. Cairns, Korean Journal Of Chemical Engineering 24, 888 (2007).
- Ariyoshi et al. (2004) K. Ariyoshi, Y. Iwakoshi, N. Nakayama, and T. Ohzuku, Journal of The Electrochemical Society 151, A296 (2004).
- Mat et al. (2006) A. Mat, K. S. Sulaiman, and M. A. Sulaiman, Solid State Science and Technology 14, 141 (2006).
- Xia et al. (2007) H. Xia, S. Tang, L. Lu, Y. Meng, and G. Ceder, Electrochimica Acta 52, 2822 (2007).
- Aydinol et al. (1997a) M. Aydinol, A. Kohan, G. Ceder, K. Cho, and J. Joannopoulos, Physical Review B 56, 1354 (1997a).
- Koyama et al. (2003a) Y. Koyama, I. Tanaka, and H. Adachi, Advances in Quantum Chemistry 42, 145 (2003a).
- Koyama et al. (2003b) Y. Koyama, I. Tanaka, H. Adachi, Y. Uchimoto, and M. Wakihara, Journal of The Electrochemical Society 150, A63 (2003b).
- Aydinol et al. (1997b) M. K. Aydinol, A. F. Kohan, and G. Ceder, Journal of Power Sources 68, 664 (1997b).
- Yi et al. (2008) T.-F. Yi, Y.-R. Zhu, and R.-S. Zhu, Solid State Ionics 179, 2132 (2008).
- Aydinol and Ceder (1997) M. K. Aydinol and G. Ceder, Journal of the Electrochemical Society 144, 3832 (1997).
- Courtney et al. (1998) I. A. Courtney, J. S. Tse, O. Mao, J. Hafner, and J. R. Dahn, Physical Review B 58, 15583 (1998).
- Chevrier et al. (2010) V. Chevrier, S. Ong, R. Armiento, M. Chan, and G. Ceder, Physical Review B 82, 075122 (2010).
- Hohenberg and Kohn (1964) P. Hohenberg and W. Kohn, Physical Review 136, B864 (1964).
- Kohn and Sham (1965) W. Kohn and L. J. Sham, Physical Review 140, A1133 (1965).
- Blöchl (1994) P. E. Blöchl, Physical Review B 50, 17953 (1994).
- Kresse and Hafner (1993) G. Kresse and J. Hafner, Physical Review B 47, 558 (1993).
- Kresse and Furthmüller (1996) G. Kresse and J. Furthmüller, Physical review B 54, 11169 (1996).
- Kresse and Joubert (1999) G. Kresse and D. Joubert, Physical Review B 59, 1758 (1999).
- Perdew et al. (1996) J. P. Perdew, K. Burke, and M. Ernzerhof, Physical Review Letters , 3865 (1996).