A black-hole mass measurement from molecular gas kinematics in NGC4526
Abstract
The masses of the supermassive black-holes found in galaxy bulges are correlated with a multitude of galaxy properties[1, 2], leading to suggestions that galaxies and black-holes may evolve together[3]. The number of reliably measured black-hole masses is small, and the number of methods for measuring them is limited[4], holding back attempts to understand this co-evolution. Directly measuring black-hole masses is currently possible with stellar kinematics (in early-type galaxies), ionised-gas kinematics (in some spiral and early-type galaxies[5, 6, 7]) and in rare objects which have central maser emission[8]. Here we report that by modelling the effect of a black-hole on the kinematics of molecular gas it is possible to fit interferometric observations of CO emission and thereby accurately estimate black hole masses. We study the dynamics of the gas in the early-type galaxy NGC 4526, and obtain a best fit which requires the presence of a central dark-object of 4.5108 M⊙ (3 confidence limit). With next generation mm-interferometers (e.g. ALMA) these observations could be reproduced in galaxies out to 75 megaparsecs in less the 5 hours of observing time. The use of molecular gas as a kinematic tracer should thus allow one to estimate black-hole masses in hundreds of galaxies in the local universe, many more than accessible with current techniques.
For this study, we targeted the fast-rotating early-type galaxy (ETG) NGC 4526. This object has a stellar velocity dispersion within one effective radius[9] km s-1 . This galaxy has not had its black-hole mass measured by any other technique to date but, given that most galaxies with bulges seem to have a black hole[2, 5], from the relation[10] we can estimate . The SMBH sphere of influence (SOI) would thus be pc or at the Mpc distance of NGC 4526 (derived from surface-brightness fluctuations[11]). NGC 4526 also has a large molecular gas reservoir (total molecular hydrogen mass [12]), previously mapped at low spatial resolution[13] (4′′). The molecular gas co-rotates with the stars[14] and Hubble Space Telescope (HST) images show that it is coincident with regular dust lanes extending up to the galaxy centre, strongly suggesting that molecular gas with regular kinematics exists around the SMBH[7].
NGC 4526 was observed in the CO(2-1) line ( GHz) using the Combined Array for Research in Millimetre Astronomy (CARMA) in A, B and C configurations[15]. The data were reduced in the standard manner[16, 17], and more details are presented in Figure 1. The spatial resolution achieved along the kinematic major axis of the galaxy is ( pc), equal to the predicted SMBH SOI. The gas in this source seems to be distributed in a central component, and an inner ring with spiral spurs which lead outwards to another ring at larger radii. A detailed analysis of the molecular gas morphology will be conducted in a future work. We note, however, that the gas structures lie in the plane of the galaxy and appear to be regularly rotating; they are therefore likely to be dynamically cold, and a good tracer of the potential[18].
We created a grid of simulations of NGC 4526 spanning a range of SMBH masses (no SMBH, = 3, and then 5 – in linear steps) and -band mass-to-light ratios ( – in linear steps). For full details of these simulations see Section 1.1 in the online supplementary information. We fix the inclination of the gas disk[19] (), and use an axisymmetric mass model of NGC 4526[9] (carefully fitted to avoid contamination due to dust; see Section 1.1.2 in the supplementary material) to derive the circular-velocity curve expected from the luminous matter alone. The presence of a SMBH in NGC 4526 manifests itself as an inner Keplerian rise of the rotation curve (above that expected from luminous matter only). On larger angular scales such fast-rising rotation curves have been observed, and used to infer the masses of central star clusters and bulges[20]. We fit these models to our observed data in order to determine if such an excess due to a central dark mass is detectable in NGC 4526.
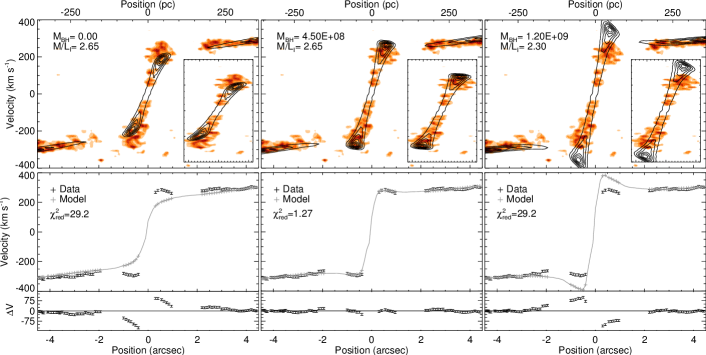
Figure 1 shows three different simulated position-velocity diagrams (PVDs) overlaid on the observed PVD of NGC 4526, with insets. The first panel shows the best model with no SMBH, with a clear excess of high-velocity molecular gas at the centre. The middle panel shows our overall best-fit model, clearly reproducing better the observed PVD at all radii, with and . The final panel shows a model with a much larger SMBH, clearly incompatible with our data. The lower panels of Figure 1 show the trace extracted from the observed PVD (as described in the supplementary material), and associated errors. The grey line shows the trace extracted from the models in the same way (with points denoting the values at the same radius as the observed points). The residuals between the data and the model at each position (V=data minus model) are shown in the bottom panel. Clearly the best-fit model produces a significantly better fit to the data.
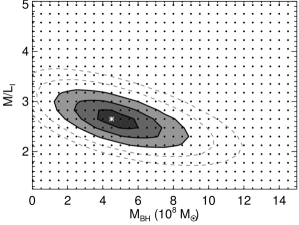
Figure 2 shows the contours of our fits (conducted as described in the supplementary material) as a function of and . A clear global minimum is present at the best-fit values, with a minimum reduced of 1.27. We define uncertainties for each of our fitted parameters from likelihood functions of each parameter (marginalised over the other), by finding the region containing respectively and of the probability. Our final best-fit values are with ( confidence level), and with ( confidence level). These values are fully consistent within the 3-uncertainties with the reported - relation[10]. Our formal uncertainties (0.14 dex and 0.5 dex at 1 and 3, respectively) are also similar (and in many cases smaller) to the average uncertainties reported by other authors. For instance the mean 1 error reported when using dynamical stellar and ionised gas techniques is 0.6 dex[10] (however the rather different systematic errors involved make direct comparison difficult).
The contours show the usual degeneracy between SMBH mass and mass-to-light ratio found in other studies. To fit the data without a SMBH, a negative gradient would be necessary, with older stellar populations dominating in the inner parts (high ) and young stars at large radii (low ). While the real is unlikely to be exactly constant, this is opposite to the trend reported by reddening free stellar population studies[21] and that expected from the presence of molecular gas and star-formation in the central regions[22].
The ability to determine a black-hole mass accurately using molecular-gas can be affected by many of the same issues that affect measurements of ionised-gas. Turbulent motions are in general small in molecular gas, but could conceivably increase around a black-hole. Similarly, if the inner gas were to be misaligned from the stellar body, our mass estimate would be systematically affected in a way that is degenerate with a change in . In this galaxy, however, we find no evidence that the velocity dispersion increases in the inner regions (as described in Section 1.1.1 in the supplementary material), and constrain the inner gas to be aligned with the stellar body within 3∘. Such a misalignment could change velocities by an insignificant amount (3km s-1; see Section 1.1.2 in the supplementary material). The presence of dust could also cause mass models to underestimate the contribution of luminous matter to the potential. We again believe this should not introduce significant errors in this object, because of our careful treatment of dust in the mass model (see Section 1.1.2 in the Supplementary Information). Future studies using this technique should choose their targets to minimise the impact of such effects, but can also include warps and turbulent motions in their gas disk models[23], and use near-infrared photometry as done in previous studies of dusty objects[23].
The use of molecular gas as a kinematic tracer holds great promise to increase the total number of SMBH mass measurements in galaxies of all types where CO is detected. Angular resolutions of up to can be achieved with current mm-interferometers, allowing for instance to resolve the SOI of a SMBH in a galaxy with km s-1 only out to around Mpc. The next generation of millimetre interferometers will have over an order of magnitude greater angular resolution (for example, mas at GHz with ALMA), as well as greatly increased sensitivity. In less the 5 hours of integration time with ALMA one could achieve the same sensitivity and linear resolution as the observations presented here, in a galaxy 75 Mpc away. Galaxies of lower mass (with smaller SMBHs) will also become accessible. For instance, the SOI of a Milky Way-like SMBH[24] ( , km s-1) will be resolved up to Mpc.
Measurements using a single technique will thus be possible over the entire range of the - relation, leading to much needed reduced uncertainties in the slope and normalisation of black hole-galaxy relations. This will allow the study of a large number of spiral galaxies, that cannot currently be probed easily using stellar dynamical techniques. Furthermore, it will also provide access to a larger number of systems than ionised gas techniques (currently limited by the 005 resolution of HST). Even considering that only some of the accessible objects will have suitably relaxed and centrally-peaked distributions of molecular gas, measuring SMBH masses will be possible in many hundreds of spiral (and early-type) galaxies, many times more than possible using conventional stellar and ionised-gas tracers today. This technique could also be extended using other spectral lines, such as the very bright atomic gas cooling lines at higher frequencies (in order to increase the spatial resolution achieved even further), and optically thin transitions such as 13CO (which would allow determinations of black-hole masses even in systems that are exactly edge on).
Received 11th September; accepted 27th November 2012
References
- [1] J. Magorrian et al., The Demography of Massive Dark Objects in Galaxy Centers, Astron. J. 115, 6, 2285-2305 (1998).
- [2] A. Graham, P. Erwin, N. Caon, I. Trujillo, A Correlation between Galaxy Light Concentration and Supermassive Black Hole Mass, Astrophys. J. 563, L11-L14 (2001).
- [3] J. Silk, M. Rees, Quasars and galaxy formation, Astron. Astrophys. 331, L1-L4 (1998).
- [4] L. Ferrarese, H. Ford, Supermassive Black Holes in Galactic Nuclei: Past, Present and Future Research, Space Sci. Rev. 116, 523-624, (2005).
- [5] M. Sarzi et al., Supermassive Black Holes in Bulges, Astrophys. J. 550, 65-74 (2001).
- [6] A. J. Barth et al., Evidence for a Supermassive Black Hole in the S0 Galaxy NGC 3245, Astrophys. J. 555, 685-708 (2001).
- [7] L. C. Ho et al., An Efficient Strategy to Select Targets for Gasdynamical Measurements of Black Hole Masses Using the Hubble Space Telescope, Publ. Astron. Soc. Pac. 114, 137-143 (2002).
- [8] K. Y. Lo, Mega-Masers and Galaxies, Annu. Rev. Astron. Astrophys. 43, 625-676 (2005).
- [9] M. Cappellari et al., The SAURON project - IV. The mass-to-light ratio, the virial mass estimator and the Fundamental Plane of elliptical and lenticular galaxies, Mon. Not. R. Astron. Soc. 366, 1126-1150 (2006).
- [10] K. Gultekin et al., Determination of the intrinsic scatter in the M-sigma and M-L relations, Astrophys. J. 698, 198-221 (2009).
- [11] J. Tonry et al., The SBF Survey of Galaxy Distances. IV. SBF Magnitudes, Colors, and Distances, Astrophys. J. 546, 2, 681-693 (2001).
- [12] F. Combes, L. M. Young, M. Bureau, Molecular gas and star formation in the SAURON early-type galaxies, Mon. Not. R. Astron. Soc. 377, 1795-1807, (2007).
- [13] L. M. Young, M. Bureau, M. Cappellari, Structure and Kinematics of Molecular Disks in Fast-Rotator Early-Type Galaxies, Astrophys. J. 676, 317-334 (2008).
- [14] T. A. Davis et al., The ATLAS3D project - X. On the origin of the molecular and ionized gas in early-type galaxies, Mon. Not. R. Astron. Soc. 417, 2, 882-899, (2011).
- [15] D. Bock et al., CARMA: Combined Array for Research in Millimeter-Wave Astronomy, Proc. SPIE, 6267, 13 (2006).
- [16] Alatalo et al. 2012, The ATLAS3D project XVIII. CARMA CO imaging survey of early-type galaxies, Mon. Not. R. Astron. Soc., accepted (arXiv:1210.5524)
- [17] R. Sault, P. Teuben, M. Wright, A Retrospective View of MIRIAD, ASP Conf. Series 77, 433 (1995).
- [18] T. A. Davis et al., The ATLAS3D Project - XIV. The extent and kinematics of molecular gas in early-type galaxies, Mon. Not. R. Astron. Soc., 429, 1, 534-555 (2013).
- [19] T. A. Davis et al., The ATLAS3D project - V. The CO Tully-Fisher relation of early-type galaxies, Mon. Not. R. Astron. Soc. 414, 2, 968-984, (2011)
- [20] Y. Sofue , J. Koda, , H. Nakanishi, & S. Onodera, The Virgo High-Resolution CO Survey: II. Rotation Curves and Dynamical Mass Distributions, Publ. Astron. Soc. Japan., 55, 59-74 (2003).
- [21] H. Kuntschner et al., The SAURON project - XVII. Stellar population analysis of the absorption line strength maps of 48 early-type galaxies, Mon. Not. R. Astron. Soc. 408, 97-132, (2010).
- [22] A. F. Crocker, M. Bureau, L. M. Young, F. Combes, Molecular gas and star formation in early-type galaxies, Mon. Not. R. Astron. Soc. 410, 1197-1222, (2011).
- [23] N. Neumayer, M. Cappellari, J. Reunanen, et al., The Central Parsecs of Centaurus A: High-excitation Gas, a Molecular Disk, and the Mass of the Black Hole Astrophys. J. 671, 2, 1329-1344, (2007).
- [24] A. Ghez et al., Measuring Distance and Properties of the Milky Way’s Central Supermassive Black Hole with Stellar Orbits, Astroph. J. 689, 2, 1044-1062, (2008).
The research leading to these results has received funding from the European Community’s Seventh Framework Programme. MB is supported by the rolling grants ‘Astrophysics at Oxford’ and from the UK Research Councils. MC acknowledges support from a Royal Society University Research Fellowship. MS acknowledges support from a Science and Technology Facilities Council (STFC) Advanced Fellowship. Support for CARMA construction was derived from the states of California, Illinois, and Maryland, the James S. McDonnell Foundation, the Gordon and Betty Moore Foundation, the Kenneth T. and Eileen L. Norris Foundation, the University of Chicago, the Associates of the California Institute of Technology, and the National Science Foundation. Ongoing CARMA development and operations are supported by the National Science Foundation under a cooperative agreement, and by the CARMA partner universities.
T.A.D prepared and reduced the observations, and created the modelling tool. TAD and MB prepared the manuscript. MC created the mass model. All authors discussed the results and implications and commented on the manuscript at all stages.
Reprints and permissions information is available at www.nature.com/reprints. The authors declare no competing financial interests. Readers are welcome to comment on the online version of this article. Correspondence and requests for materials should be addressed to T.A.D (email: tdavis@eso.org).
See pages 1,2 of SI.pdf