Evolution of the high-mass end of the stellar initial mass functions in starburst galaxies
Abstract
We investigate the time evolution and spatial variation of the stellar initial mass function (IMF) in star-forming disk galaxies by using chemodynamical simulations with an IMF model depending both on local densities and metallicities ([Fe/H]) of the interstellar medium (ISM). We find that the slope () of a power-law IMF () for stellar masses larger than evolves from the canonical Salpeter IMF () to be moderately top-heavy one () in the simulated disk galaxies with starbursts triggered by galaxy interaction. We also find that in star-forming regions correlates with star formation rate densities ( in units of yr-1 kpc-2). Feedback effects of Type Ia and II supernovae are found to prevent IMFs from being too top-heavy (). The simulation predicts for (i.e., more top-heavy in higher ), which is reasonably consistent well with corresponding recent observational results. The present study also predicts that inner regions of starburst disk galaxies have smaller thus are more top-heavy ( kpc-1 for kpc). The predicted radial gradient can be tested against future observational studies of the variation in star-forming galaxies.
1 Introduction
A growing number of recent observational studies have suggested that stellar initial mass functions (IMFs) can be different in galaxies with different star-formation activities, dynamical parameters (e.g., stellar velocity dispersion), environments, and redshifts (e.g., Hoversten & Glazebrook 2008; van Dokkum 2008; Meurer et al. 2009, M09; Treu et al. 2010; Cappellari et al. 2012; Ferreras et al. 2012; van Dokkum & Conroy 2012). One of important questions relating to possibly variable IMFs is as to whether IMFs can be top-heavy in starburst galaxies (e.g., Elmegreen 2009 for a recent review). It has been still controversial whether the IMF is almost universal in different galaxies or depends on local environments such as densities and metallicities of star-forming gas clouds (e.g., Bastian et al. 2010; Kroupa et al. 2012).
Recent observational studies on the physical relations between the slopes of power-law IMFs (, where is the canonical Salpeter IMF) and galaxy properties (e.g., mass densities and SFRs) have provided new clues to the nature of IMFs in actively star-forming galaxies. M09 investigated the extinction-corrected flux ratio of and far-ultraviolet (FUV) light and found that the flux ratios are different between different galaxies and depend on surface densities of flux () and -band luminosity densities of galaxies (). Their observations are consistent with decreasing (i.e., becoming more top-heavy) with increasing and . Gunawardhana et al. (2011, G11) investigated of galaxies and their correlations with SFRs (in units of yr-1) and SFR densities (in units of yr-1 kpc-2) and found correlations between and SFRs () and between and (). It should be noted here that they take a linear scaling between H luminosity and the SFR based on in deriving the SFR. In reality, a linear scaling does not apply if is varying: the exact scaling dependent on the behavior of the IMF in detail (e.g. the mass limits and any changes in at the low mass end) is beyond the scope of this paper to determine. Although these observed correlations appear to strongly suggest top-heavy IMFs in starburst galaxies, the origin of the correlations has been discussed by only a few theoretical models in a quantitative manner (Pflamm-Altenburg et al. 2009; Weidner et al. 2011; Kroupa et al. 2012).
Pipino & Matteucci (2004) showed that the observed colors of massive elliptical galaxies can be reproduced better by their chemical and photometric evolution models with slightly flatter (i.e., top-heavy) IMFs. Nagashima et al. (2005) demonstrated that the observed chemical abundances (e.g., [Mg/Fe]) of elliptical galaxies can be explained by top-heavy IMFs. These previous works, however, did not investigate how IMFs evolve in the starburst phases of elliptical galaxy formation. Although starbursts have been demonstrated to be triggered by galaxy interaction in previous numerical simulations (e.g., Noguchi & Ishibashi 1986), the evolution of IMFs during starbursts has not been investigated in the simulations of galaxy interaction. Thus it is theoretically unclear whether or not the IMFs of galaxies become top-heavy when they are in the starburst phases.
The two main purposes of this Letter are as follows. Firstly, we discuss whether or not the IMFs in starburst galaxies can become top-heavy by using our original chemodynamical simulations that incorporate the new physical IMF model proposed by Marks et al. (2012, M12). Secondly, we test whether or not the present model can reproduce the observed correlations between , SFRs, and derived by G11. We investigate at individual star-forming regions in disk galaxies at each time step so that we can investigate not only the time evolution of IMF but also local variation of . We focus our investigation on the IMF evolution of galaxies with starbursts triggered by strong galaxy-galaxy interaction and merging. In the present paper, we compare between the observed and simulated relations, even though the observed relation would be less precisely derived by assuming the fixed Salpter IMF for the estimation of SFRs.
2 The model
In order to perform numerical simulations of galaxies on GPU clusters, we use our original chemodynamical code (Bekki 2013) that is a revised version of our previous code (‘GRAPE-SPH’; Bekki 2009). The new GPU-version chemodynamical code allows us to investigate the time evolution of chemical abundances and dust properties of galaxies self-consistently. We adopt a disk galaxy model that broadly mimics the structural and kinematical properties of baryonic and dark matter components of the Milky Way Galaxy (as listed in Binney & Tremaine 2007). The disk galaxy is composed of dark matter halo, bulge, stellar disk, and gas disk. The density distribution of the dark halo is represented by the ‘NFW’ profile predicted by the cold dark matter cosmology (Navarro et al. 1996), and the total mass, the virial radius, and the -parameter are set to be , 245 kpc, and 10, respectively.
The stellar bulge is assumed to have the Hernquist profile with the total mass of and the disk size of 3.5 kpc. The radial () and vertical () density profiles of the stellar disk are assumed to be proportional to with scale length = 3.5 kpc and to with scale height = 0.7 kpc, respectively. In addition to the rotational velocity caused by the gravitational field of disk, bulge, and dark halo components, the initial radial and azimuthal velocity dispersions are assigned to the disc component according to the epicyclic theory with Toomre’s parameter = 1.5. The maximum circular velocity of the disk is 222 km s-1 for the adopted structure parameters of the stellar and dark matter components.
The gas disk represented by SPH particles has a gas mass fraction of 0.1 and an exponential radial profile with the scale-length of 3.5 kpc and the size of 35 kpc. The gas disk has an initial temperature of K and a metallicity gradient with the central [Fe/H] of 0.34 and the slope () of dex kpc-1 (Andrievsky et al. 2004). The gas particles are converted into new stars if the following physical conditions are met: (i) the local dynamical time scale is shorter than the sound crossing time scale (mimicking the Jeans instability) and (ii) the local velocity field is identified as being consistent with gravitationally collapsing (i.e., div v). The feedback energy of erg is imparted to neighboring gas particles around a new star when the star becomes a Type Ia or Type II supernova (SN Ia and SN II, respectively).
For a new star formed from Jeans-unstable gas, the IMF slope () for stellar masses () larger than is investigated. In the following, the high-mass IMF slope (originally in the Kroupa IMF; Kroupa 2001) is referred to as for convenience. M12 proposed that depends on mass densities () and [Fe/H] of proto-cluster gas clouds as follows:
| (1) |
This equation holds for , where , and for (M12). We slightly modify the M12’s IMF model in the following two points. Firstly, we do not introduce the threshold , mainly because the -dependence at is not so clear (not so flat as M12 showed) owing to a small number of data points.
Secondly, we estimate from local gas density of Jeans-unstable gas particles in equation (1). This is because the present simulation can not resolve the rather high-density cores of star-forming or cluster-forming molecular gas clouds. The local value of at each Jeans-unstable gas is estimated by multiplying by a constant :
| (2) |
The derivation process of is as follows. The Jeans-unstable gas is assumed to be star-forming giant molecular clouds and thus have the following size-mass scaling relation derived from the observed mass-density relation by Larson (1981):
| (3) |
Since the equation (1) is based largely on the observed properties of the Galactic globular clusters (GCs hereafter) and nearby star clusters, a reasonable can be the typical density ratio of GCs to GC-host GMCs. We here consider that (i) should correspond to a typical mean mass density for GCs, (ii) typical GC mass () and size () are and 3pc, respectively (Binney & Tremaine 2007), (iii) original GCs just after their formation from GMCs should be times more massive than the present ones (e.g., Decressin et al. 2010; Marks & Kroupa 2010; Bekki 2011), and (iv) a star formation efficiency of GC-host GMCs is . For and pc in the typical GC-host GMC, a reasonable () is estimated to be . The present models do not show large (; very steep IMF) that is needed to explain the observed FUV flux ratios of low surface brightness galaxies (LSBs) in M09. This is mainly because star formation can occur only in higher density gaseous regions where can be smaller in the present models. Although the original IMF model by M12 is theoretically derived from observations on physical properties of GCs and star clusters, we assume that the IMF model applies for all new stars in each bin (i.e., not just for star clusters).
The disk galaxy is assumed to interact with a companion galaxy represented by a point-mass particle. The mass-ratio of the companion to the disk galaxy is a free parameter denoted as . The initial distance of the two galaxies is fixed at 280 kpc and the orbital eccentricity () and the orbital pericenter () are free parameters. The angle between the axis and the vector of the angular momentum of the disk is denoted as . We mainly describe the results of the fiducial model with , (i.e., parabolic), kpc, and (i.e., prograde interaction). In order to discuss briefly the parameter dependences, we investigate the following five representative models: weaker () and stronger () tidal interaction, retrograde interaction (), low surface brightness (LSB; kpc), and no SN feedback effects. For comparison, we also investigate the isolated model (i.e., no tidal interaction) and the major merger one in which two identical disks merge with each other in a prograde-prograde manner. For the merger model, kpc and are adopted. The total number of particles is 716700 for isolated and interaction models and 1433400 for the merger model. The gravitational softening length is 2.3 kpc for dark matter and 0.25 kpc for baryonic components. In the following, in a simulation represents the time that has elapsed since the simulation started.
3 Results
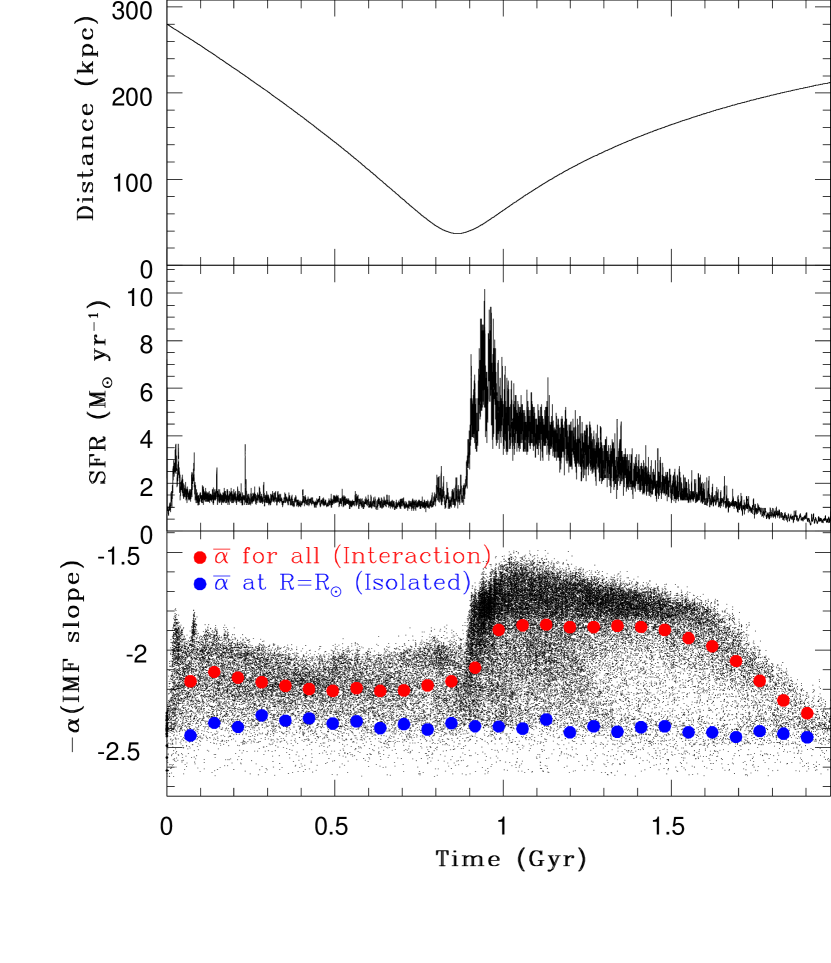
Figure 1 shows how changes during a starburst triggered by galaxy interaction in the fiducial model. After the pericenter passage of the companion galaxy, the strong tidal field can compress the gas disk so that rather high-density gaseous regions can be formed. As a result of this, the star formation rate (SFR) of the disk galaxy can be significantly enhanced (up to ) and the mean () increases from (pre-starburst) to (during starburst). The time evolution of SFR is clearly synchronized with that of , which implies that can be described as a function of SFR in galaxies. Individual local regions of the disk galaxy during the triggered starburst have different ranging from to owing to locally different gas densities and [Fe/H]. These results thus demonstrate that IMFs can become moderately top-heavy in starburst galaxies because of the formation of rather high-density and Jeans-unstable gaseous regions.
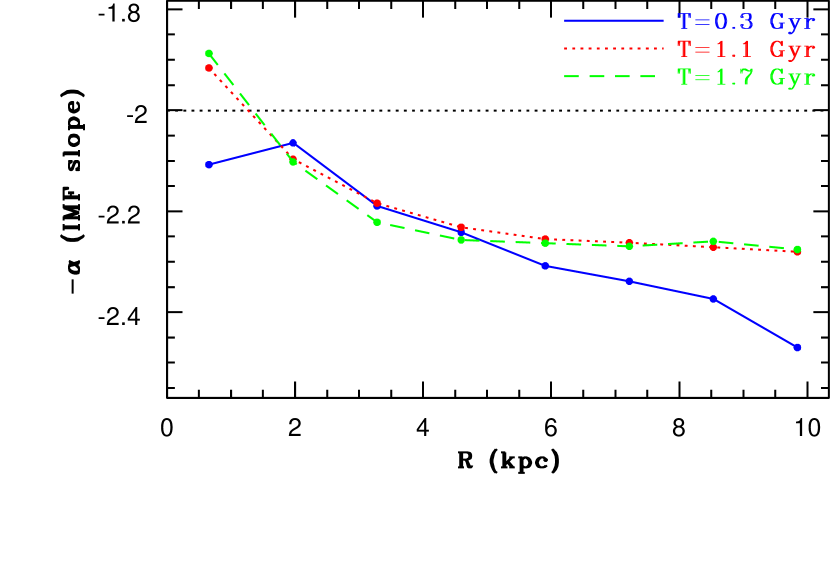
Figure 2 shows that in individual radial bins (i.e., azimuthally averaged ) of the disk galaxy correlates with SFR densities () in the fiducial model. Although dispersions are large at a given , radial bins with higher are more likely to show smaller (i.e., more top-heavy IMFs). These simulated positive correlations between and are qualitatively consistent with the corresponding observational results by G11. Figure 3 describes the radial gradients of the star-forming disk at pre-starburst (T=0.3 Gyr), strong starburst (T=1.1 Gyr), and post-starburst phase (T=1.7 Gyr). Clearly, more top-heavy IMFs (i.e., smaller ) can be seen in the inner regions of the interacting disk galaxy for the three epochs. The disk has of kpc-1 for the central 5 kpc at and 1.7 Gyr. The derived positive gradients can be seen in all models of the present study and thus regarded as a robust prediction.
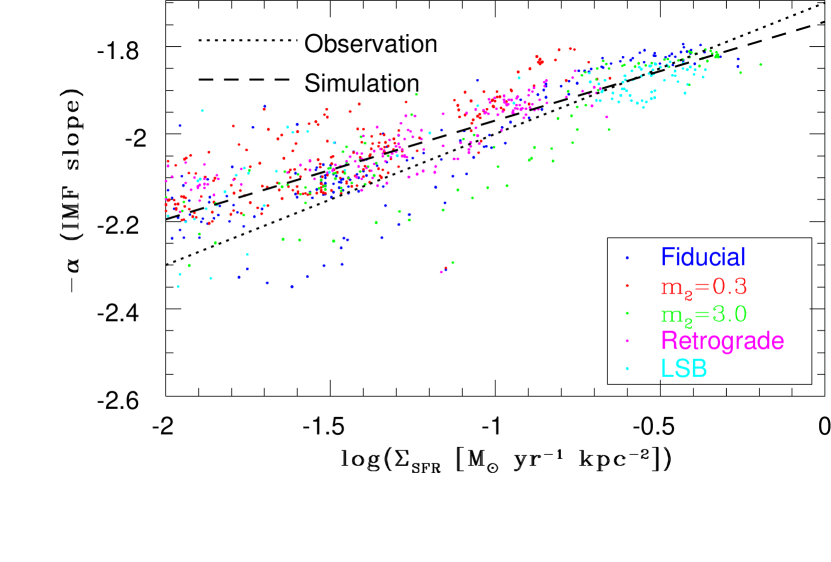
Figure 4 shows the correlation of individual radial bins with in the five different interacting galaxies with starbursts. Clearly, radial bins with higher can have more top-heavy IMFs (i.e., smaller ). A least-squares fit to these simulated star-forming regions gives
| (4) |
which is similar to the observed relation of in G11. It should be noted here, however, that the observed relation is derived from averaged and (over individual galaxies) whereas the simulated points are derived from the average of star forming regions in each radial bin, with the points belonging to different galaxies. It should be also noted that the simulated relations can be slightly different between different models. For example, in the fiducial model, which is pretty close to the observed relation by G11, whereas in the model with . The LSB model can show more top-heavy IMFs in some regions, because high-density gaseous regions can form owing to efficient gas-transfer to the central region during tidal interaction hence original LSB galaxies achieves a high surface brightness in the interaction.
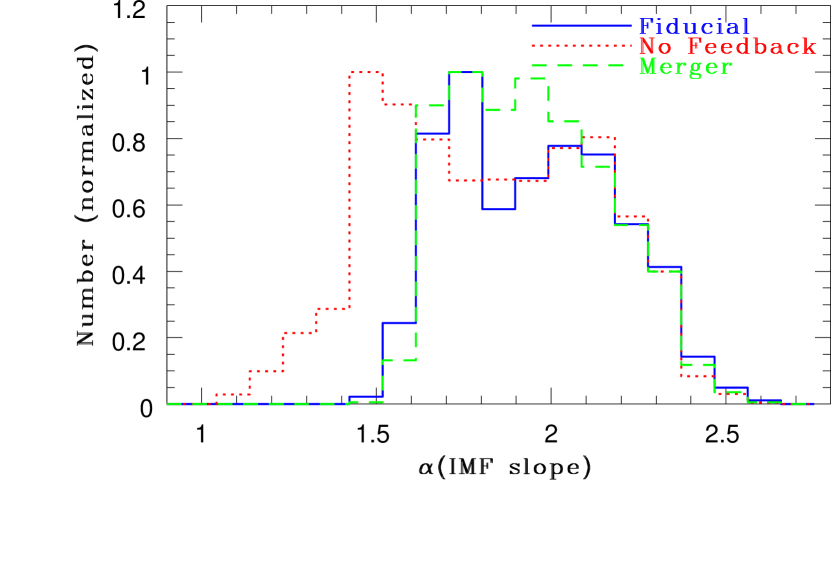
Figure 5 shows that (i) number distributions of in the fiducial model and the model without SN feedback effects are bimodal (i.e., two peaks) and (ii) they are significantly different between the two models. The first peak at lower (‘low- peak’) is due to a starburst and the second peak at higher (‘high- peak’) represents the mean for pre-starburst IMFs. The model without SN feedback has the low- peak at lower (), which means that the IMF is more top-heavy in comparison with the fiducial model. This difference between the two models clearly demonstrates that the feedback effects of SN Ia and SN II can suppress the formation of overly high-density, Jeans-unstable gaseous regions and therefore prevent IMFs from being too top-heavy (). Figure 5 also shows that the location of the low- peak in the merger model is coincident with that of the fiducial one, which confirms that the IMF can become moderately top-heavy in major galaxy merging.
4 Discussion and conclusions
The consistency between the observed and simulated relations implies that the adopted IMF model (M12) can be useful in simulating the time evolution and spatial variation of in galaxies. However, this does not necessarily mean that the adopted IMF model for Jeans-unstable gas clouds is the best one that can be adopted for discussing galaxy evolution caused by varying IMFs. Larson (1998) adopted an IMF that is similar to the Salpeter IMF at the upper end and flatter one below a characteristic stellar mass (, which is typically in the present day universe) and discussed a number of observational results in terms of time-varying . Following the IMF model proposed by Larson (1998), Davé (2008) and Narayanan & Davé (2012) considered IMFs with depending on redshifts and thereby discussed the origin of the observed redshift-evolution of the relation between stellar masses and SFRs in galaxies. It should be noted here that the IMF model by M12 is observationally supported whereas the variation model by Larson is a working hypothesis for which there is not much observational evidence.
Given that a growing number of observations have recently revealed possible evidence for varying IMFs (e.g., Kroupa et al. 2012), it would be important for theoretical studies of galaxy formation and evolution to incorporate varying IMFs in their models. It is however unclear what varying IMF models should be adopted for galaxy formation and evolution studies. The results of numerical simulations on galaxy formation would depend on whether IMF models with varying (with fixed ) or those with varying are adopted. A reasonable varying IMF model would need to explain recent observational results on IMFs in nearby galaxies such as correlations between /FUV flux ratios and galaxy properties (e.g., M09) and between equivalent width and optical colors (e.g., Hoversten & Glazebrook 2008; G11) in a self-consistent manner.
One robust prediction in the present study is that inner regions of actively star-forming disk galaxies have smaller (i.e., more top-heavy). Such radial gradients of IMFs are also discussed in the context of the integrated galaxy IMF theory (Pflamm-Altenburg & Kroupa 2008). The predicted positive gradient is a natural consequence of the adopted IMF model: the metallicity gradient act to flatten the IMF with increasing radius, but the -dependence is stronger so the new gradient is a steeper IMF at larger radius. Since observational studies have not yet extensively investigated radial (or azimuthal) gradients of IMFs in nearby galaxies, it is not clear whether the predicted gradient is qualitatively or consistent with observations. We suggest that observed radial gradients of IMFs and their correlations with local galaxy properties (e.g., local gas densities and -band local surface luminosity densities) would give some constraints on whether IMF models with varying or should be adopted for galaxy formation studies.
Recent observations have suggested that (i) massive early-type galaxies have the steeper (i.e., bottom-heavy) IMF in the mass range to (e.g., van Dokkum & Conroy 2011) and (ii) the IMF slope depends on stellar velocity dispersions of the galaxies (e.g., Ferreras et al. 2012). Since metal-rich star formation can lead to “bottom-heavy” IMFs for in M12, it is our future study to incorporate an IMF for that depends on physical properties of ISM in our chemodynamical simulations for elliptical galaxy formation. Such more sophisticated chemodynamical simulations with variable IMF slopes below and above will enable us to discuss the origin of the observed possibly bottom-heavy IMFs in massive early-type galaxies (e.g., Cenarro et al. 2003).
References
- (1) Andrievsky, S. M., Luck, R. E., Martin, P., & Lépine, J. R. D. 2004, A&A, 413, 159
- (2) Bastian, N., Covey, K. R., & Meyer, M. R. 2010, ARA&A, 48, 339
- (3) Bekki, K. 2009, MNRAS, 399, 2221
- (4) Bekki, K. 2012, MNRAS, 412, 2241
- (5) Bekki, K. 2013, submitted to MNRAS
- (6) Binney, J. & Tremaine, S. 2007, Galactic Dynamics, 2nd ed., ed. J. P. Ostriker & D. Spergel (Princeton, NJ: Princeton Univ. Press) 124
- (7) Cappellari, M. et al. 2012, Nature, 484, 485
- (8) Cenarro, A. J., Gorgas, J., Vazdekis, A., Cardiel, N., & Peletier, R. F. 2003, MNRAS, 339, L12
- (9) Davé, R. 2008, MNRAS, 385, 147
- (10) Decressin, T., Baumgardt, H., Charbonnel, C., & Kroupa, P. 2010, A&, 516, 73
- (11) Elmegreen, B. G. 2009, in The Evolving ISM in the Milky Way and Nearby Galaxies, Edited by K. Sheth, A. Noriega-Crespo, J. Ingalls, and R. Paladini.
- (12) Ferreras, I., La Barbera, F., de la Rosa, I. G., Vazdekis, A., de Carvalho, R. R., Falcón-Barroso, J., & Ricciardelli, E. 2012, MNRAS in press
- (13) Gunawardhana, M. L. P., et al. 2011, MNRAS, 415, 1647 (G11)
- (14) Hoversten, E. A., & Glazebrook, K. 2008, ApJ, 675, 163
- (15) Kroupa, P., Weidner, C., Pflamm-Altenburg, J., Thies, I., Dabringhausen, J., Marks, M., & Maschberger, T. 2011, preprint (arXiv1112.3340).
- (16) Kroupa, P. 2001, MNRAS¡ 322, 231
- (17) Larson, R. B. 1981, MNRAS, 194, 809
- (18) Larson, R. B. 1998, MNRAS, 301, 569
- (19) Marks, M., & Kroupa, P. 2010, MNRAS, 406, 2010
- (20) Marks, M., Kroupa, P., Dabringhausen, J., & Pawlowski, M. S. 2012, MNRAS, 422, 2246 (M12)
- (21) Meurer, G. R., et al. 2009, ApJ, 695, 765 (M09)
- (22) Nagashima, M., Lacey, C. G., Okamoto, T., Baugh, C. M., Frenk, C. S., & Cole, S. 2005, MNRAS, 363, L31
- (23) Narayanan, D., & Davé, R. 2012, MNRAS, 3601, 3615
- (24) Navarro, J. F., Frenk, C. S., & White, S. D. M. 1996, ApJ, 462, 563 (NFW)
- (25) Noguchi, M., & Ishibashi, S. 1986, MNRAS, 219, 305
- (26) Pipino, A., & Matteucci, F. 2004, MNRAS, 347, 968
- (27) Pflamm-Altenburg, J., & Kroupa, P. 2008, Nature, 455, 641
- (28) Treu, T., Auger, M. W., Koopmans, L. V. E., Gavazzi, R., Marshall, P. J., & Bolton, A. S. 2010, ApJ, 709, 1195
- (29) van Dokkum, P. G. 2008, ApJ, 674, 29
- (30) van Dokkum, P. G., & Conroy, C. 2012 ApJ, 760, 70
- (31) Weidner, C., Kroupa, P., & Pflamm-Altenburg, J. 2011, MNRAS, 412, 979